0680
Quantification of Long and Ultra-short Relaxation Times in Tissues with Ultra-short TE MR Fingerprinting (UTE-MRF)1Center for Brain Imaging Science and Technology, Key Laboratory for Biomedical Engineering of Ministry of Education, College of Biomedical Engineering and Instrumental Science, Zhejiang University, Hangzhou, China, 2State Key Laboratory of Modern Optical Instrumentation, College of Optical Science and Engineering, Zhejiang University, Hangzhou, China
Synopsis
Magnetic resonance fingerprinting (MRF) has been combined with ultra-short echo time technique (UTE-MRF) to enable the quantification of ultra-short T2/T2* tissues. A TE sinusoidal variation pattern is introduced to UTE-MRF acquisition to improve the ultra-short T2 detection accuracy to sub-millisecond. With the golden angle spiral acquisition and sliding window reconstruction, quantitative T1 and T2 maps of regular and ultra-short T2/T2* tissue components are acquired at 14s per slice. Since the B0 induced phase variation has been encoded into the signal evolution with variable TE, the B0 map is simultaneously obtained.
Introduction
T1 quantification of tissues with ultra-short T2/T2* is sensitive to the motion for the long acquisition time1-2. T2 quantification for such kind of tissues is even more challenging due to the fast T2 decay. MR fingerprinting3 is a promising technique for rapidly quantifying T1 and T2 relaxation times simultaneously. However, the TE limitation has made the fast decay signal with ultra-short T2 invisible to conventional MRF. Additionally, the MRF T2 reconstruction resolution is limited to 5~10 ms rendering almost impossible for differentiation of T2 changes in 1 ms or shorter (ultra-short T2/T2* components). In this study, we propose a 2D ultra-short echo time MRF (UTE-MRF) method with sinusoidal TE variations to quantify the ultra-short T2 signal.Theory and Methods
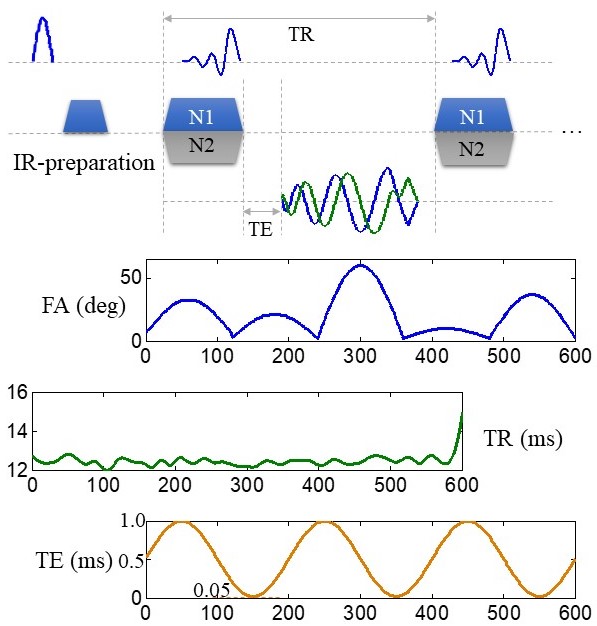
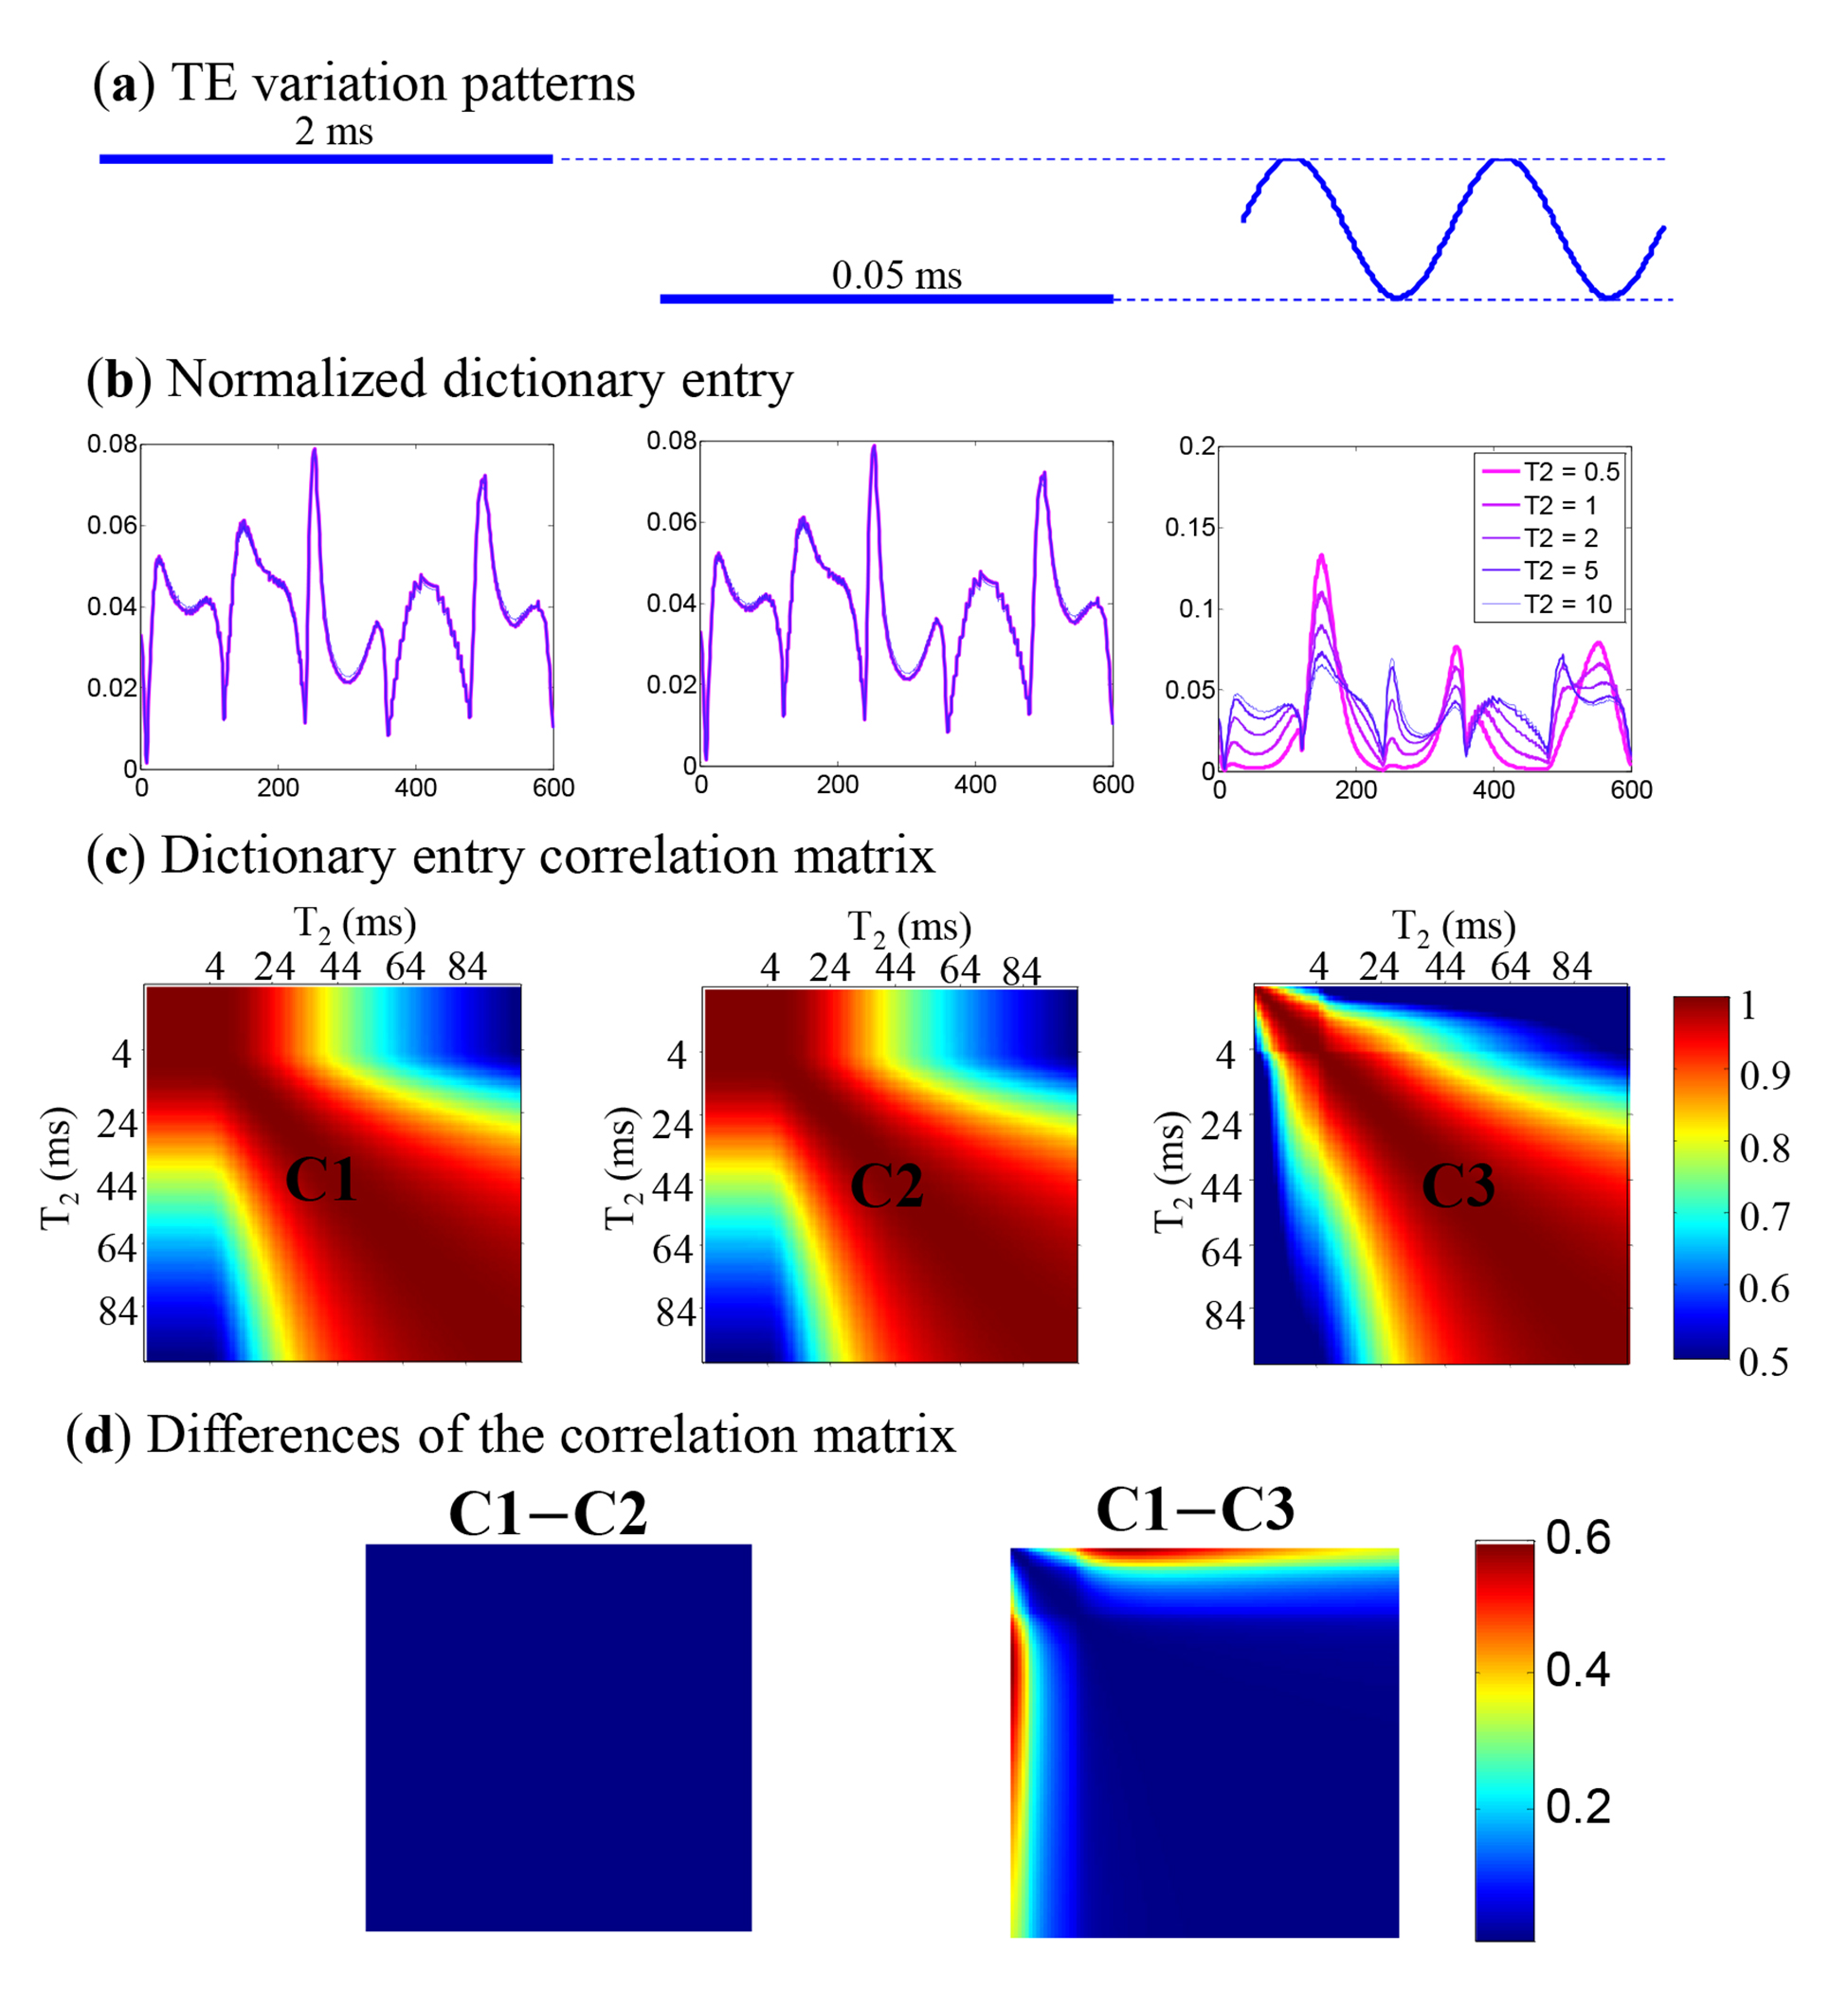
The sequence diagram of UTE-MRF is shown in Fig.1. MRF image series are acquired with half pulse excitation and spiral-out acquisition with varying FA, TR and TE. The signal evolution of selected tissues with T2 = 0.5, 1, 2, 5 and 10 ms and T1 = 180 ms is simulated and plotted in Fig.2. Ultra-short T2/T2* tissues are invisible in the conventional MRF due to the relatively long echo time (e.g. 2 ms) compared to the fast decay (e.g. 1 ms). Even with half pulse excitation to minimize the TE to 50 us, constant TE MRF acquisition shows negligible difference among the dictionary elements. While with sinusoidal TE variation, the separability of MRF dictionary elements for ultra-short T2 signals is significantly increased (Fig. 2b). The distances among different the dictionary elements are reported as the correlation matrix (Fig. 2c and 2d). To test the ultra-short T2 detection accuracy with different TE variation patterns, we respectively explored the influence of TEmin, TEmax and cycle of the sinusoidal via simulation. The impact of noise levels was also investigated. For each test, the T2 candidate was randomly initialized from 1.5 to 2.5 ms and matched with the dictionary elements of T2 from 0.2 ms to 4 ms (step = 0.1 ms). Each test was repeated for 100 times. To reduce the fat and bone marrow induced image blurry, a fat-suppression UTE-MRF was also implemented. Phantom and in vivo experiments were performed on a 3T MAGNETOM Prisma. UTE-MRF image series were acquired with a 40x under-sampling spiral (1mm × 1mm) in conjunction with golden angle acquisition for 600 time points with varying FA and TR (Fig. 1). The TEmin, TEmax, and sinusoidal cycles were set to 0.05 ms, 1 ms and 3, respectively, to balance the SNR of ultra-short T2/T2* signals and T2 detection accuracy in MRF. A sliding window reconstruction algorithm4 was applied to increase the signal SNR along the temporal domain after the image reconstruction using NUFFT5.Results
Fig. 3 shows the impact of sinusoidal TE coefficients on the T2 detection accuracy. The T2 recognition error is almost exponentially reduced with the TE variation scale (TEmax-TEmin). Signal SNR is more crucial to the detection accuracy, but the number of the sinusoidal cycle has little impact. Fig. 4 shows the results of phantom experiments in comparison with the images acquired with the conventional MRF (Tacq = 10 s) at the minimum echo time of 2.35 ms. The quantitative T1 value is in agreement with the FISP-MRF method, while the T2 values in UTE-MRF are in general shorter than in FISP-MRF. Fig. 5 shows the in vivo results of a human shank with and without fat suppression.Discussion
To the best of our knowledge, this is the
first time the MRF schemes are used to quantifying ultra-short echo time
tissues. MRF with TE variation can improve the separability of dictionary
elements, which has been demonstrated on EPI-MRF6 and MRF
pattern optimization7. In this work, we use a sinusoidal TE variation
pattern and have shown its ability to separate the signal with ultra-short T2/T2*
via simulation and experiments. Simulation results demonstrate with a 0.05 ms to 1 ms TE variation, the ultra-short T2 signal can be detected
within the error of 0.1 ms.
Besides the quantification of regular tissues like FISP-MRF, our results of phantom and in vivo experiments suggest that UTE-MRF can simultaneous quantify the tissues with ultra-short T2/T2*. The regular T2 value measured in UTE-MRF was found to be shorter than the FISP-MRF method due to the varying TE induced T2* weighting. The decoded B0 map could be applied for off-resonance compensation and further increase the dictionary detection accuracy.
Conclusion
We have demonstrated that UTE-MRF with a sinusoidal TE variation pattern could simultaneously obtain the accurate T1, (regular and ultra-short) T2, and B0 maps of tissues with ultra-short T2/T2*.Acknowledgements
The authors thank Dr. Yi Sun for his kind discussions and revision. This work was supported by the National Key R&D Program of China (2017YFC0909200), National Natural Science Foundation of China (81401473, 91632109, 61701436) and the Fundamental Research Funds for the Central Universities (2017QNA5016).References
[1] Jiang Du, Michael Carl, Mark Bydder, Atsushi Takahashi, Christine B. Chung, Graeme M. Bydder, Qualitative and quantitative ultraultra-short echo time (UTE) imaging of cortical bone, In Journal of Magnetic Resonance, Volume 207, Issue 2, 2010, Pages 304-311.
[2] Techawiboonwong A, Song H K, Leonard M B, et al. Cortical Bone Water: In Vivo Quantification with Ultra-short Echo-Time MR Imaging[J]. Radiology, 2008, 248(3): 824-833.
[3] Ma D, Gulani V, Seiberlich N, et al. Magnetic Resonance Fingerprinting[J]. Nature, 2013, 495(7440): 187-192.
[4] Cao, X., Liao, C., Wang, Z., Chen, Y., Ye, H., He, H. and Zhong, J. (2017), Robust sliding-window reconstruction for Accelerating the acquisition of MR fingerprinting. Magn. Reson. Med, 78: 1579–1588.
[5] Fessler J A. On NUFFT-based gridding for non-Cartesian MRI. Journal of Magnetic Resonance, 2007, 188(2): 191-195.
[6] Rieger B, Zimmer F, Zapp J, Weingärtner S, Schad LR. Magnetic resonance fingerprinting using echo-planar imaging: Joint quantification of T1 and T2* relaxation times. Magn. Reson. Med. 2016.
[7] Mathies B., Sebastian F., and Mark E., On optimizations of MRF patterns based on generalized MR sequence schemes, ISMRM, 2017.
Figures