0679
Correlation of MR fingerprinting with whole mount histopathology reveals epithelial and stromal density drive T1, T2 measurements in regions of prostatitis and prostate cancer: Preliminary findings1Biomedical Engineering, Case Western Reserve University, Cleveland, OH, United States, 2Radiology, Case Western Reserve University, Cleveland, OH, United States, 3Radiology, University Hospitals, Cleveland, OH, United States, 4Pathology, University Hospitals, Cleveland, OH, United States, 5Urology, University Hospitals, Cleveland, OH, United States
Synopsis
Magnetic Resonance Fingerprinting (MRF) is a new technology aimed at generating quantitative T1 and T2 maps. In this study, histo-morphometric attributes that may be driving the MRF measurements of cancerous and prostatitis regions are explored via correlation of in vivo MRF maps with post surgical ex vivo histopathology. Our results suggest that epithelial density may be driving T1 and T2 MRF measurements in prostatitis regions while stromal density may be driving the T1 MRF signals within cancerous regions.
Introduction
Magnetic resonance fingerprinting (MRF) is a recently developed technology that yields simultaneous quantitative T1 and T2 maps. The MR signal acquired with a set of user-defined parameters is allowed to vary in a pseudorandom manner and the timecourse in each pixel is matched to a dictionary consisting of all possible ranges of signal evolutions1, yielding the properties of interest for each pixel. It has been shown2 that T1 and T2 MRF maps along with traditionally acquired apparent diffusion coefficient (ADC) resulted in a near perfect separation between prostate cancer and normal peripheral zone (NPZ) and an AUC of 0.83 for separating low-grade from intermediate and high-grade cancer. In this study, we aim to correlate MRF derived measurements with pathologic features obtained from corresponding whole mount sections post radical prostatectomy (RP). These correlations enable a better understanding of the morphologic attributes driving the T1, T2 measurements on MRF. Specifically, associations between computationally derived pathologic features including epithelium, lumen and stromal density and various first order statistics of MRF and MRI signal intensities within cancerous and prostatitis regions were explored in this study.Materials and Methods
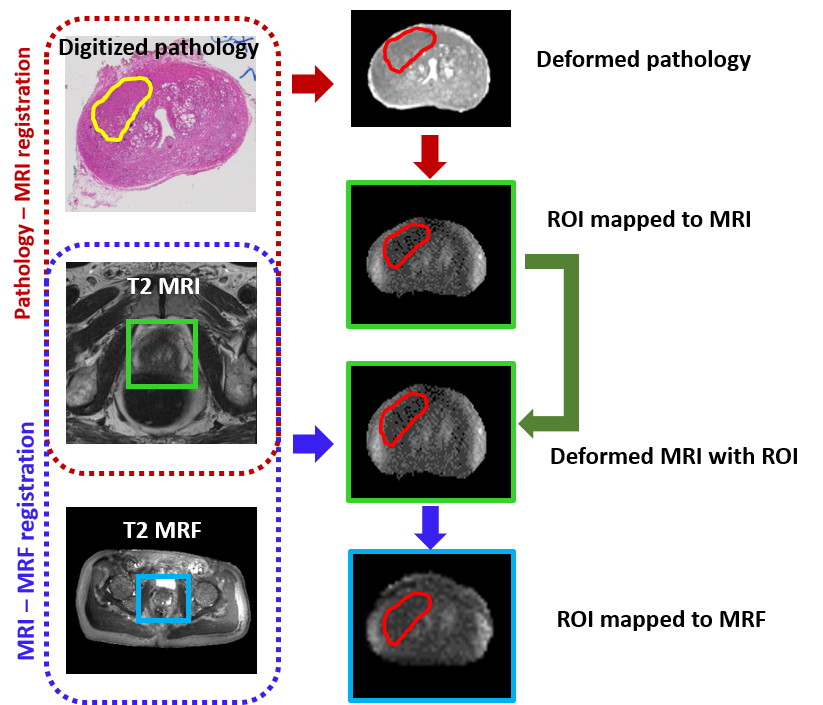
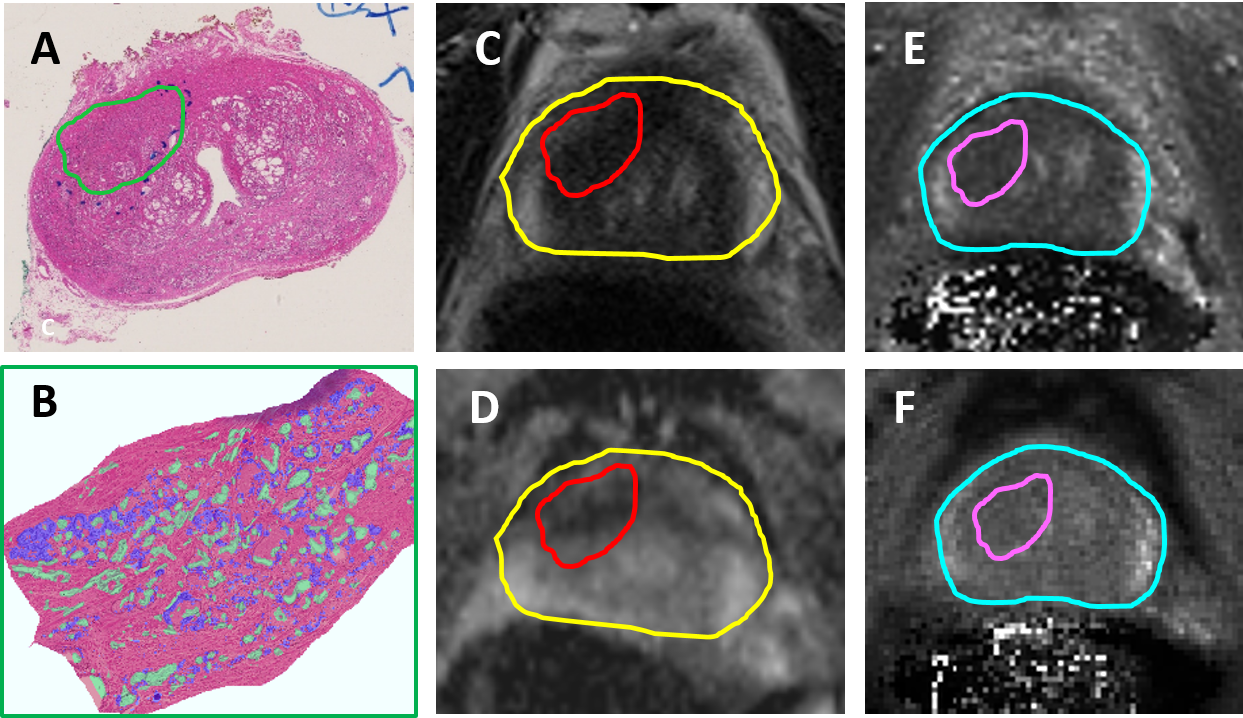
This retrospective, institutional review board approved and HIPAA compliant study comprised 6 patients who underwent 3T multi-parametric MRI (mpMRI) along with the acquisition of T1, T2 MRF maps prior to RP. Hematoxylin and eosin stained whole mount specimens were obtained and digitized post RP. To obtain accurate regions of interest (ROIs), lesions identified by an experienced pathologist, including cancer and prostatitis, on ex-vivo digitized whole mount specimens were mapped on to in-vivo MRI and subsequently to MRF via deformable co-registration using a multi-scale approach3 (illustrated in Figure 1). The ROI’s transferred on to MRI and MRF were corrected by the radiologist for errors arising from slice mismatch and artifacts from co-registration. Registration was evaluated in terms of target registration error (TRE) between the landmarks on whole mount pathology, MRI and MRF. Deep-learning based segmentation approaches were used to identify epithelium, lumen and stromal density within the delineated ROIs on pathology (Figure 2). These metrics were correlated with statistics of MRF (T1, T2) and MRI (T2, ADC) within the mapped ROIs in terms of Pearson’s correlation coefficient (R). To minimize the effect of potential errors, statistics of signal intensities within all ROIs of each patient were considered instead of each ROI separately.Results
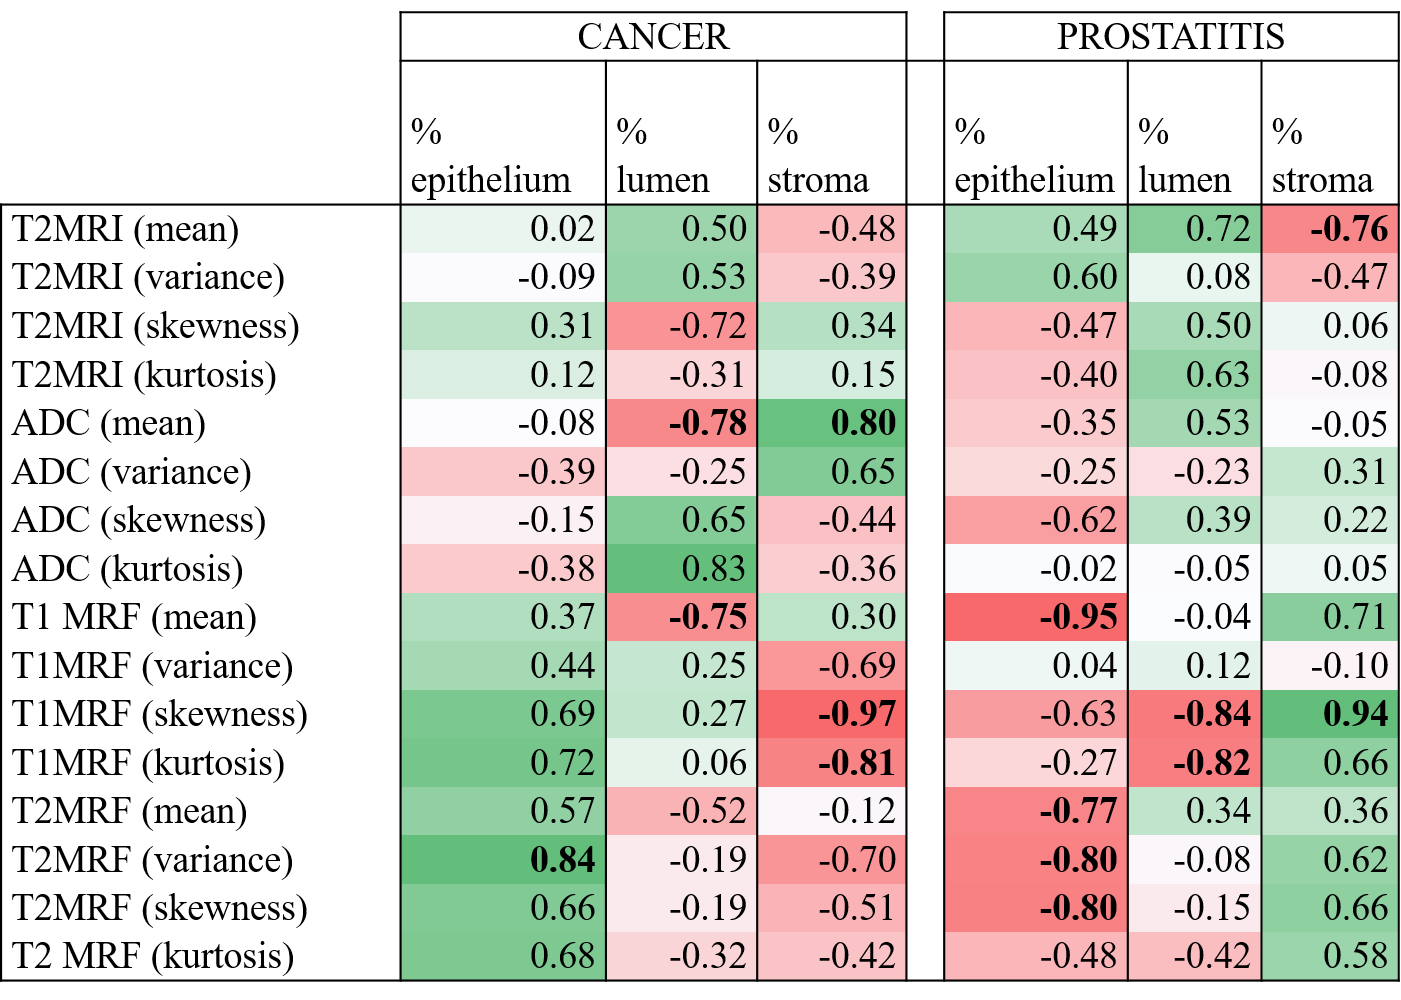
The average TREs for pathology–MRI and MRI–MRF co-registrations were 2.2 mm and 2.8 mm, respectively. A high correlation within cancerous ROIs was observed (R > 0.8) between mean ADC and stromal density. Also, a high inverse correlation (R < –0.8) within cancerous ROIs was observed between T1 MRF distribution statistics and stromal density. A high inverse correlation was observed between mean T1, T2 MRF measurements and epithelial density within prostatitis ROIs. These results are detailed in Figure 3.Discussion
The correlation results provide a preliminary histo-morphometric understanding of quantitative MR measurements. As shown in Figure 3, our results indicate that quantitative measurements such as (MRF and ADC) are suggestive of specific characteristics on pathology. In our study, mean ADC within cancer ROI’s showed strong correlation with stromal density which is in-line with previous studies4,5 that explain low ADC measurements in cancerous regions are on account of decreasing volumes of higher-diffusivity stroma. Mean T1, T2 MRF values within prostatitis ROIs showed strong inverse correlation with epithelial density. Prostatitis is characterized by an increase in intra-epithelial lymphocytes6 that is reflected by ROIs containing low T1, T2 measurements on MRF maps. Distribution statistics namely skewness and kurtosis (quantify asymmetry and spread of distributions) of T1 MRF within cancer ROIs showed a strong inverse correlation with stromal density. This indicates that higher skewness or abundance of low T1 MRF measurements in cancerous ROIs is associated with a lower stromal density which in turn indicates a dense gland packing characteristic of prostate cancer. It is also evident from Figure 3 that while positive correlations between T1, T2 MRF measurements and epithelial density were observed for cancer, negative correlations were observed in case of prostatitis. This trend was also observed in correlations between T1, T2 MRF measurements and stromal density. This suggests that two different pathological characteristics (cancer and prostatitis) may result in similar measurements on MRF.Conclusion
Prostatitis is characterized by regions of low T1, T2 measurements on MRF which correlated with regions of high epithelial density on histopathology. Prostate cancer, characterized by focal regions of low T1 measurements on MRF, correlated with regions of low stromal density which indicates a dense gland packing on histopathology. Further studies on a larger cohort are needed to validate the findings.Acknowledgements
No acknowledgement found.References
1. Ma D, Gulani V, Seiberlich N, Liu K, Sunshine JL, Duerk JL, Griswold MA. Magnetic resonance fingerprinting. Nature. 2013 Mar 14;495(7440):187–192. doi:10.1038/nature11971 PMID: 23486058 PMCID: PMC3602925
2. Yu AC, Badve C, Ponsky LE, Pahwa S, Dastmalchian S, Rogers M, Jiang Y, Margevicius S, Schluchter M, Tabayoyong W, Abouassaly R, McGivney D, Griswold MA, Gulani V. Development of a Combined MR Fingerprinting and Diffusion Examination for Prostate Cancer. Radiology. 2017 Jun;283(3):729–738. doi:10.1148/radiol.2017161599 PMID: 28187264 PMCID: PMC5452885
3. Li L, Pahwa S, Penzias G, Rusu M, Gollamudi J, Viswanath S, Madabhushi A. Co-Registration of ex vivo Surgical Histopathology and in vivo T2 weighted MRI of the Prostate via multi-scale spectral embedding representation. Sci Rep. 2017 Aug 18;7(1):8717. doi:10.1038/s41598-017-08969-w PMID: 28821786 PMCID: PMC5562695
4. Langer DL, van der Kwast TH, Evans AJ, Plotkin A, Trachtenberg J, Wilson BC, Haider MA. Prostate tissue composition and MR measurements: investigating the relationships between ADC, T2, K(trans), v(e), and corresponding histologic features. Radiology. 2010 May;255(2):485–494. doi:10.1148/radiol.10091343 PMID: 20413761
5. Chatterjee A, Watson G, Myint E, Sved P, McEntee M, Bourne R. Changes in Epithelium, Stroma, and Lumen Space Correlate More Strongly with Gleason Pattern and Are Stronger Predictors of Prostate ADC Changes than Cellularity Metrics. Radiology. 2015 Dec;277(3):751–762. doi:10.1148/radiol.2015142414 PMID: 26110669
6. Dikov D, Bachurska S, Staikov D, Sarafian V. Intraepithelial lymphocytes in relation to NIH category IV prostatitis in autopsy prostate. The Prostate. 2015 Jul 1;75(10):1074–1084. doi:10.1002/pros.22991 PMID: 25917232
Figures