0678
MR Vascular Fingerprinting during Gas ChallengesThomas Christen1, Wendi W. Ni1, Jia Guo1, Audrey P. Fan1, Michael M. Moseley1, and Greg Zaharchuk1
1Radiology, Stanford University, Stanford, CA, United States
Synopsis
The MR vascular fingerprinting (MRvF) approach extends the concept of MR fingerprinting to the study of microvascular properties and functions. Encouraging results have been obtained in healthy human volunteers as well as in stroke and tumor models in rats. However, it has been suggested that the method has a low sensitivity to blood oxygenation measurements. In this study, we tested the MRvF approach in healthy volunteers while breathing different gas mixtures (Hyperoxia (100%O2), Normoxia (21%O2), hypoxia (14%O2)) and examined the results when different types of fingerprints are considered.
Introduction:
The MR vascular fingerprinting (MRvF) approach1 extends the concept of MR fingerprinting2 to the study of microvascular properties and functions. The MR signal evolution (Free Induction Decay + Spin echo=fingerprint) is sampled in each voxel and compared to a dictionary of curves obtained using advanced numerical simulations of the same experiment. The results are high-resolution parametric maps representing blood volume fraction (CBV), blood vessels radius (R), and blood oxygenation (SO2). Encouraging results have been obtained in healthy human volunteers1 as well as in stroke and tumor models in rats3. However, it has been suggested that the method has a low sensitivity to blood oxygenation measurements1,4. In this study, we tested the MRvF approach in healthy volunteers while breathing different gas mixtures (Hyperoxia (100%O2), Normoxia (21%O2), hypoxia (14%O2)) and examined the results when different types of fingerprints are considered.Materials and Methods:
The local IRB committee approved all studies. Experiments were performed at 3T (GE Healthcare Systems, Waukesha, WI) with an 8-channel GE receive-only head coil. The MR acquisition protocol included: (1) a blood T2 mapping sequence based on the TRUST approach5 for independent blood oxygenation measurements (acq matrix=64x64, FOV=22x22cm2, NA=4, TR=10s, TEs=20-40-60-100ms, Acq time=264s). (2) A GESFIDE sequence for fingerprinting (TR=2000ms, 40echoes, SE=100ms, FOV=20*20cm2, ST=1.5mm, 128*128, 12slices, Tacq=4min). 10 volunteers were scanned while breathing different gas mixtures (Hyperoxia (100%O2), Normoxia (21%O2), hypoxia (14%O2)). Each epoch lasted 6 minutes and acquisitions started after 1 min to ensure stable gas environment and subject physiology. The protocol was repeated after intravenous injection of Feraheme (off label contrast agent, 7 mg Fe/kg, AMAG Pharmaceuticals Inc., Cambridge, MA, USA) and the ratio of the GESFIDE acquisitions pre and post contrast was initially taken as ‘vascular fingerprint’1. Simulations and post processing were performed as previously described1.Results:
Physiological monitoring and TRUST measurements (Fig.1) indicated global changes of blood oxygenation during the gas challenges. MRvF parametric maps obtained in one volunteer during the 3 challenges are presented in Fig.2a-c. CBV maps show a good contrast between GM and WM, while Vessel Radius and Blood oxygen saturation maps are more homogeneous. The numerical values obtained during normoxia and averaged over the volunteers are consistent with previous reports. However, no changes were observed in SO2 estimates between the gas challenges. The accuracy of the fingerprinting approach depends on the ability to separate the fingerprints signals in the dictionary. In order to study the sensitivity of MRvF to SO2, we examined the dictionaries (pre-contrast, post-contrast, ratio pre/post, Fig.3a-c) when CBV and R are fixed (Fig.3d-f). It can be observed that the maximum sensitivity to SO2 appears in the pre-contrast dictionary (green arrow) while only a portion of the ratio dictionary allows for curves discrimination. These findings are summarized in Fig.3g-i where the standard deviation of the curves is computed at each echo time. Figure 4 extends the previous results for all parameters. It confirms that the maximum sensitivity to SO2 is obtained in the pre-contrast dictionary (although CBV also influences the results) and shows that the method is mostly sensitive to CBV changes (especially using the post-contrast dictionary). R measurements should be extracted from the ratio dictionary. Given these observations, we designed a new fingerprint that concatenates the pre, post and ratio signals. Figure 5 shows the new results after using this updated dictionary. The CBV and R results are similar to those initially obtained but the SO2 estimates now show significant differences between hypoxic and hyperoxic measurements.Conclusion:
This study shows that MRvF maps can be obtained in healthy volunteers while modifying the inspired oxygen content. Results confirm that the original MRvF fingperprint pattern has a low sensitivity for SO2 measurements. By analyzing the properties of the dictionaries, we show that it is possible to design a new fingerprint pattern with higher SO2 sensitivity which seems promising for non-invasive detection of hypoxic tissues in several pathologies.Acknowledgements
Supported in part by (NIH 5R01NS066506, NIH 2RO1NS047607, NCRR 5P41RR09784, R21-NS087491).References
[1] Christen et.al, Neuroimage, 2014 [2] Ma et.al, Nature, 2013 [3] Lemasson et.al, Scientific Reports 2016 [4] Pouliot et.al, Neuroimage 2017 [5] Lu and Ge, MRM, 2008.Figures
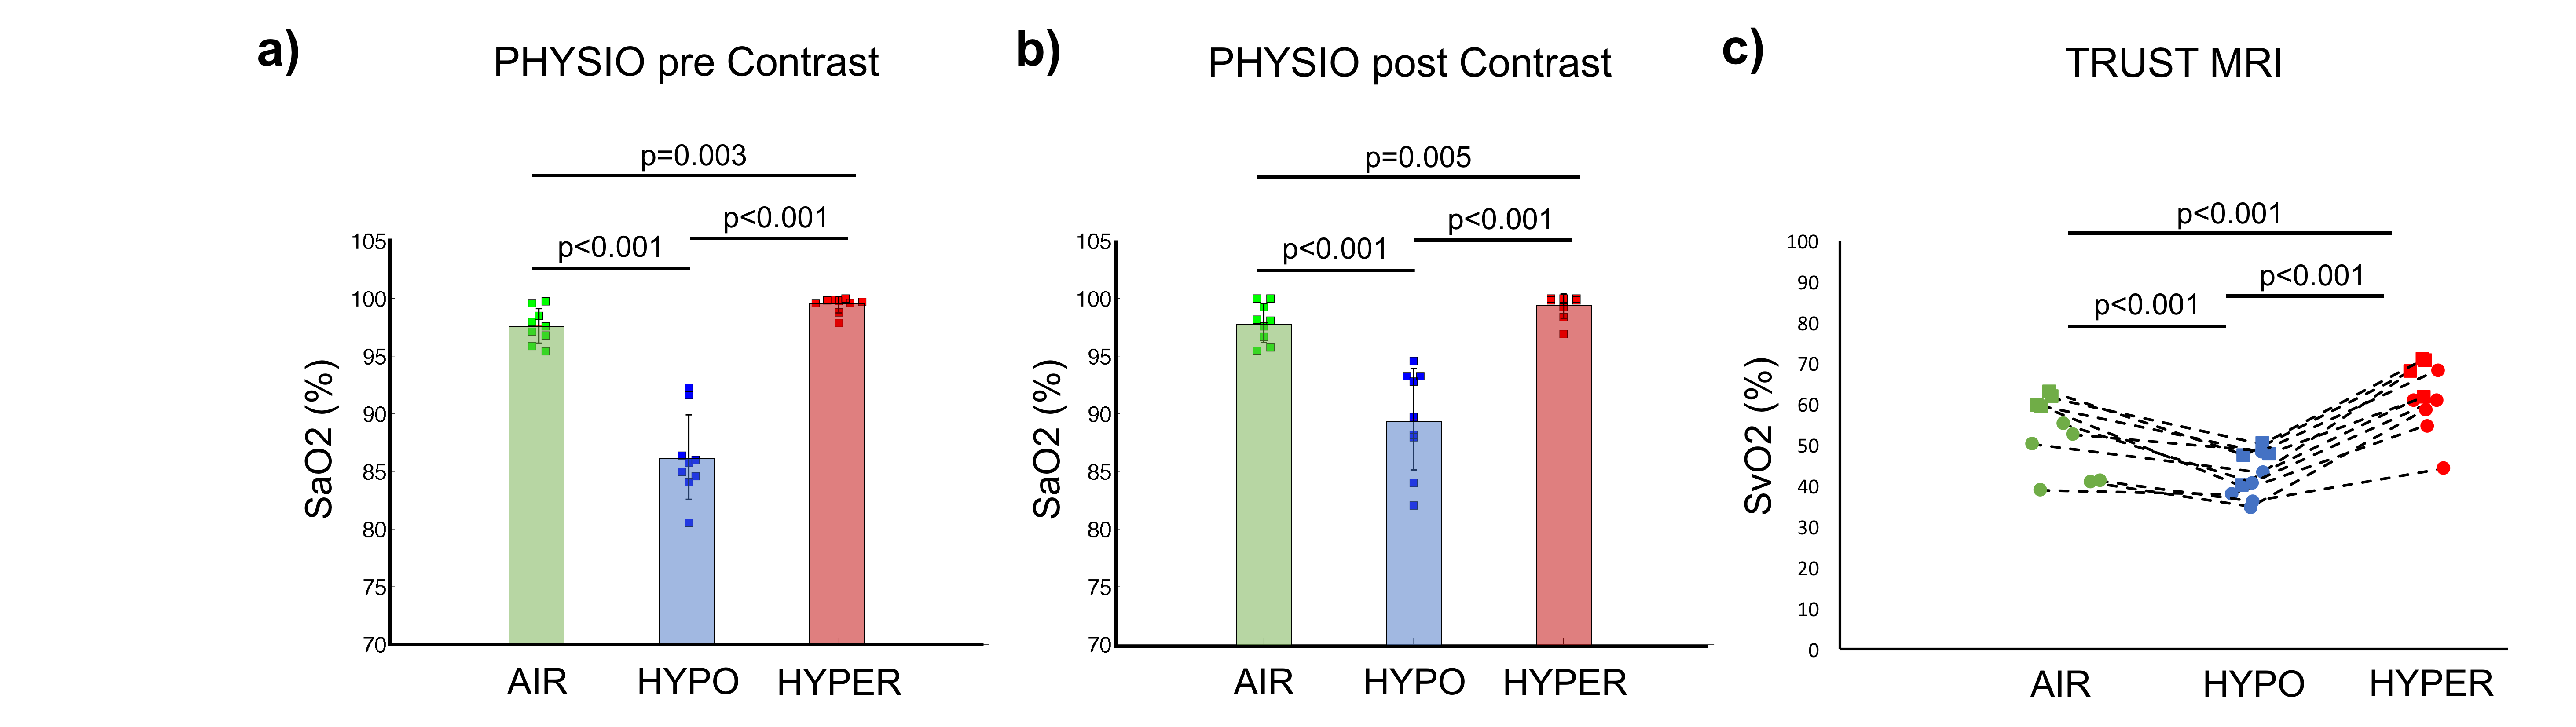
Figure 1:
Physio (arterial oxygenation) and TRUST (venous oxygenation) results in all
volunteers during the 3 gas challenges.
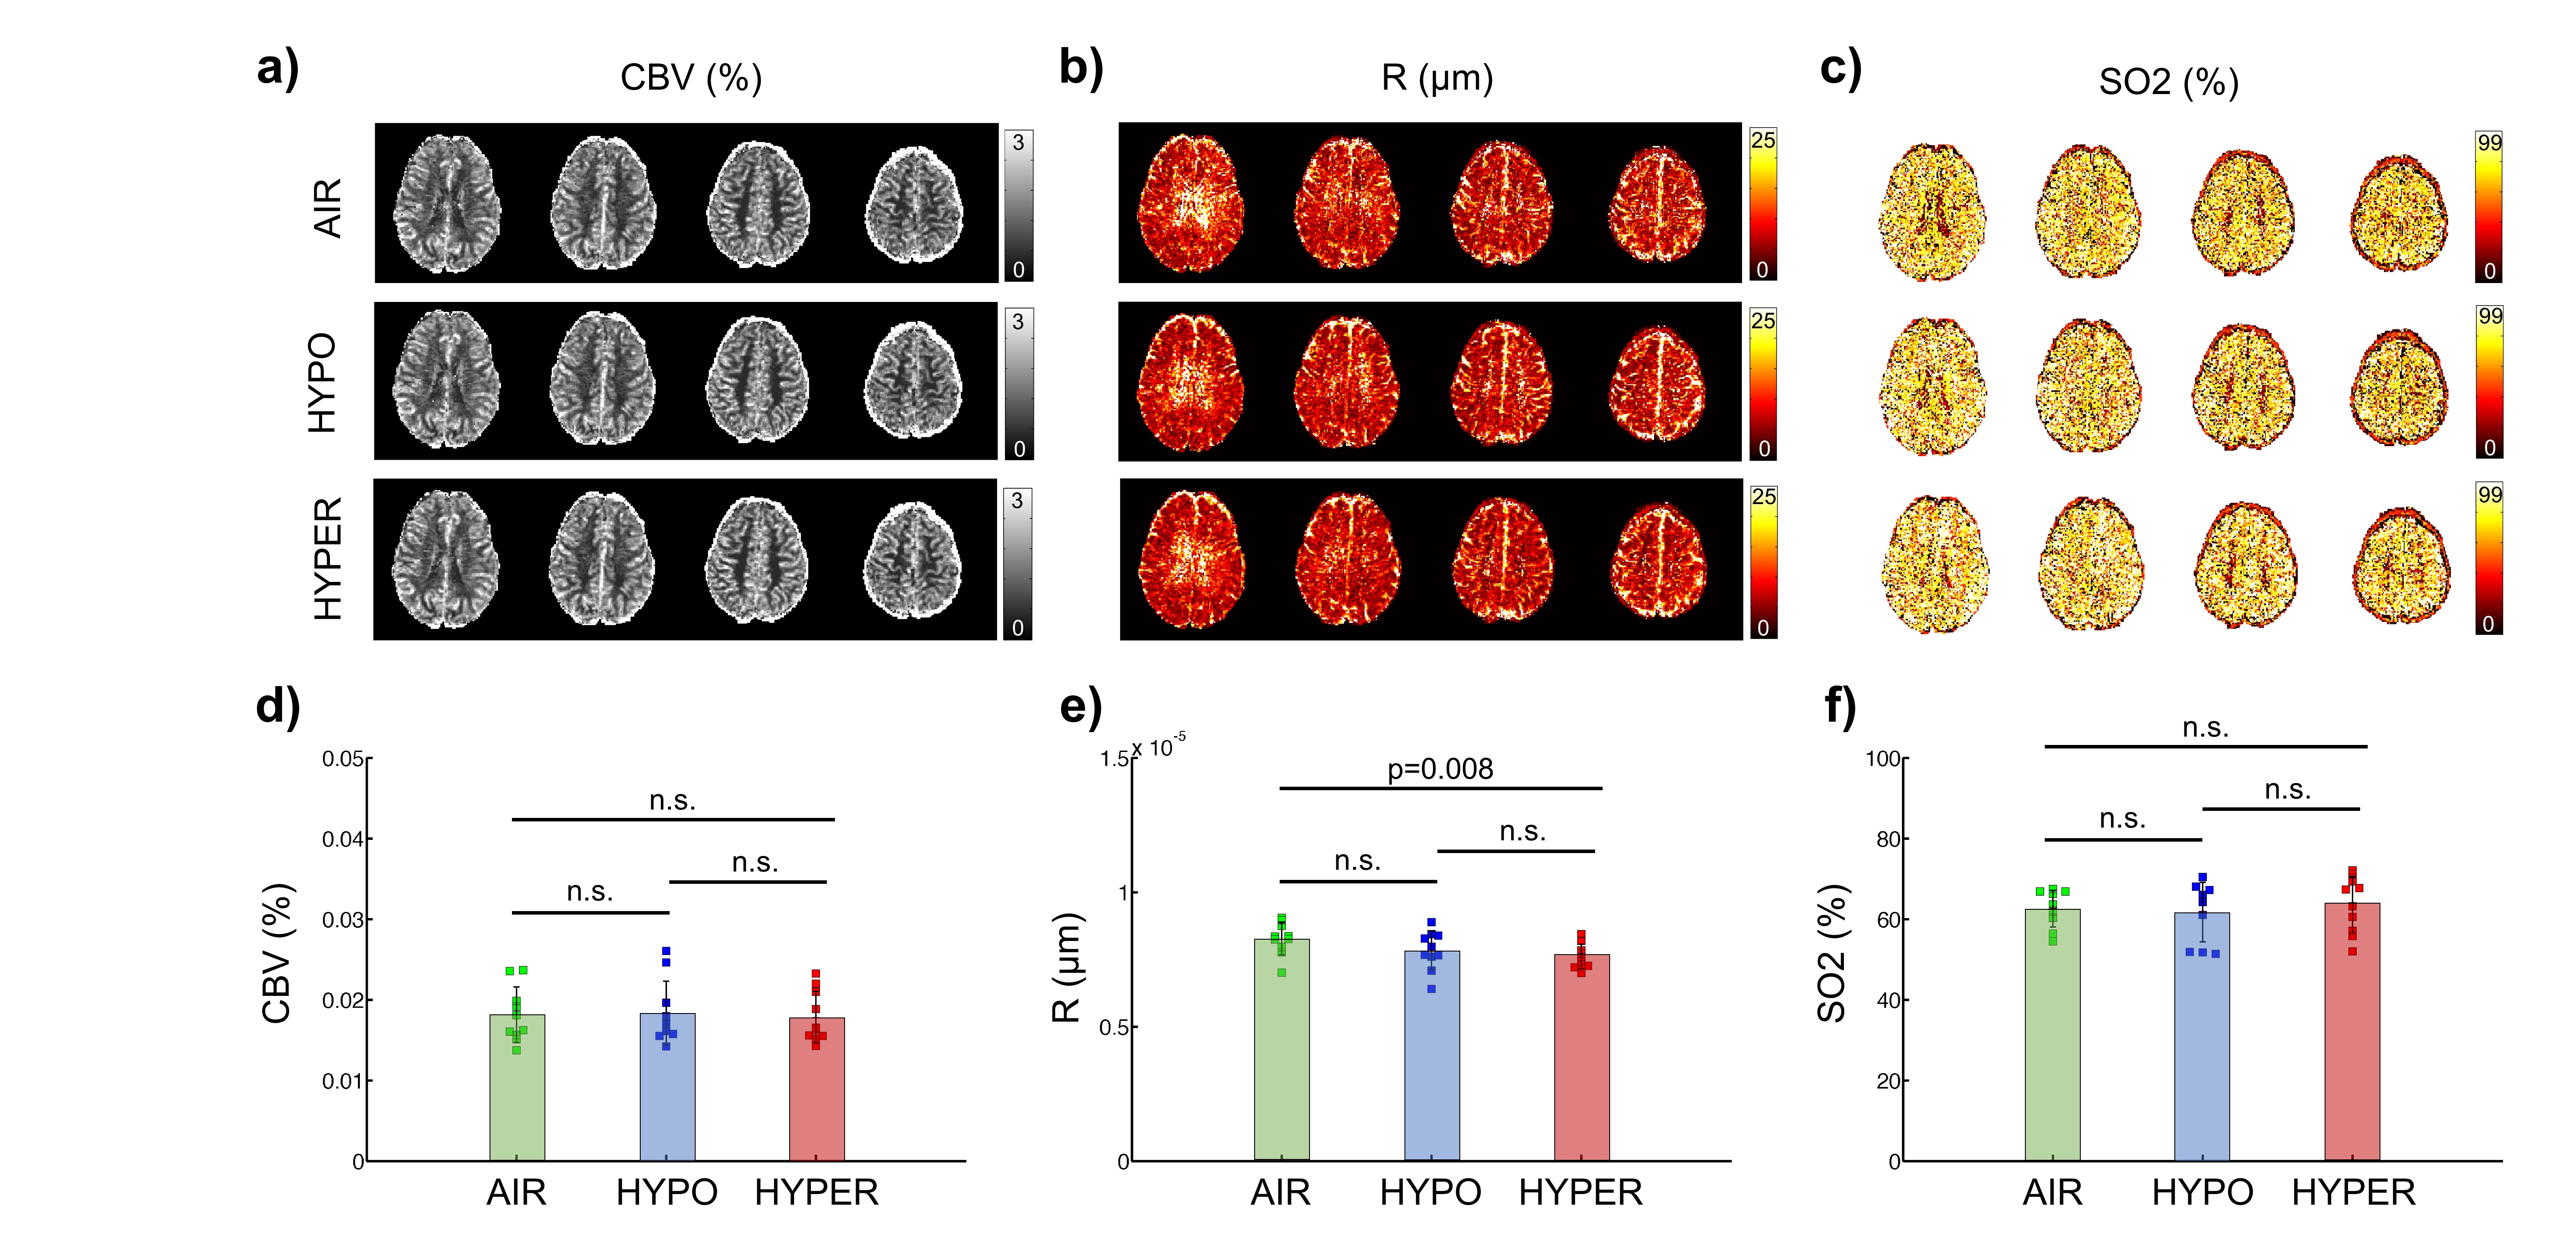
Figure 2: MRvF results obtained with the ratio fingerprint.
A-C) Maps obtained in one volunteers. D-F) Averaged results obtained in 10
volunteers.
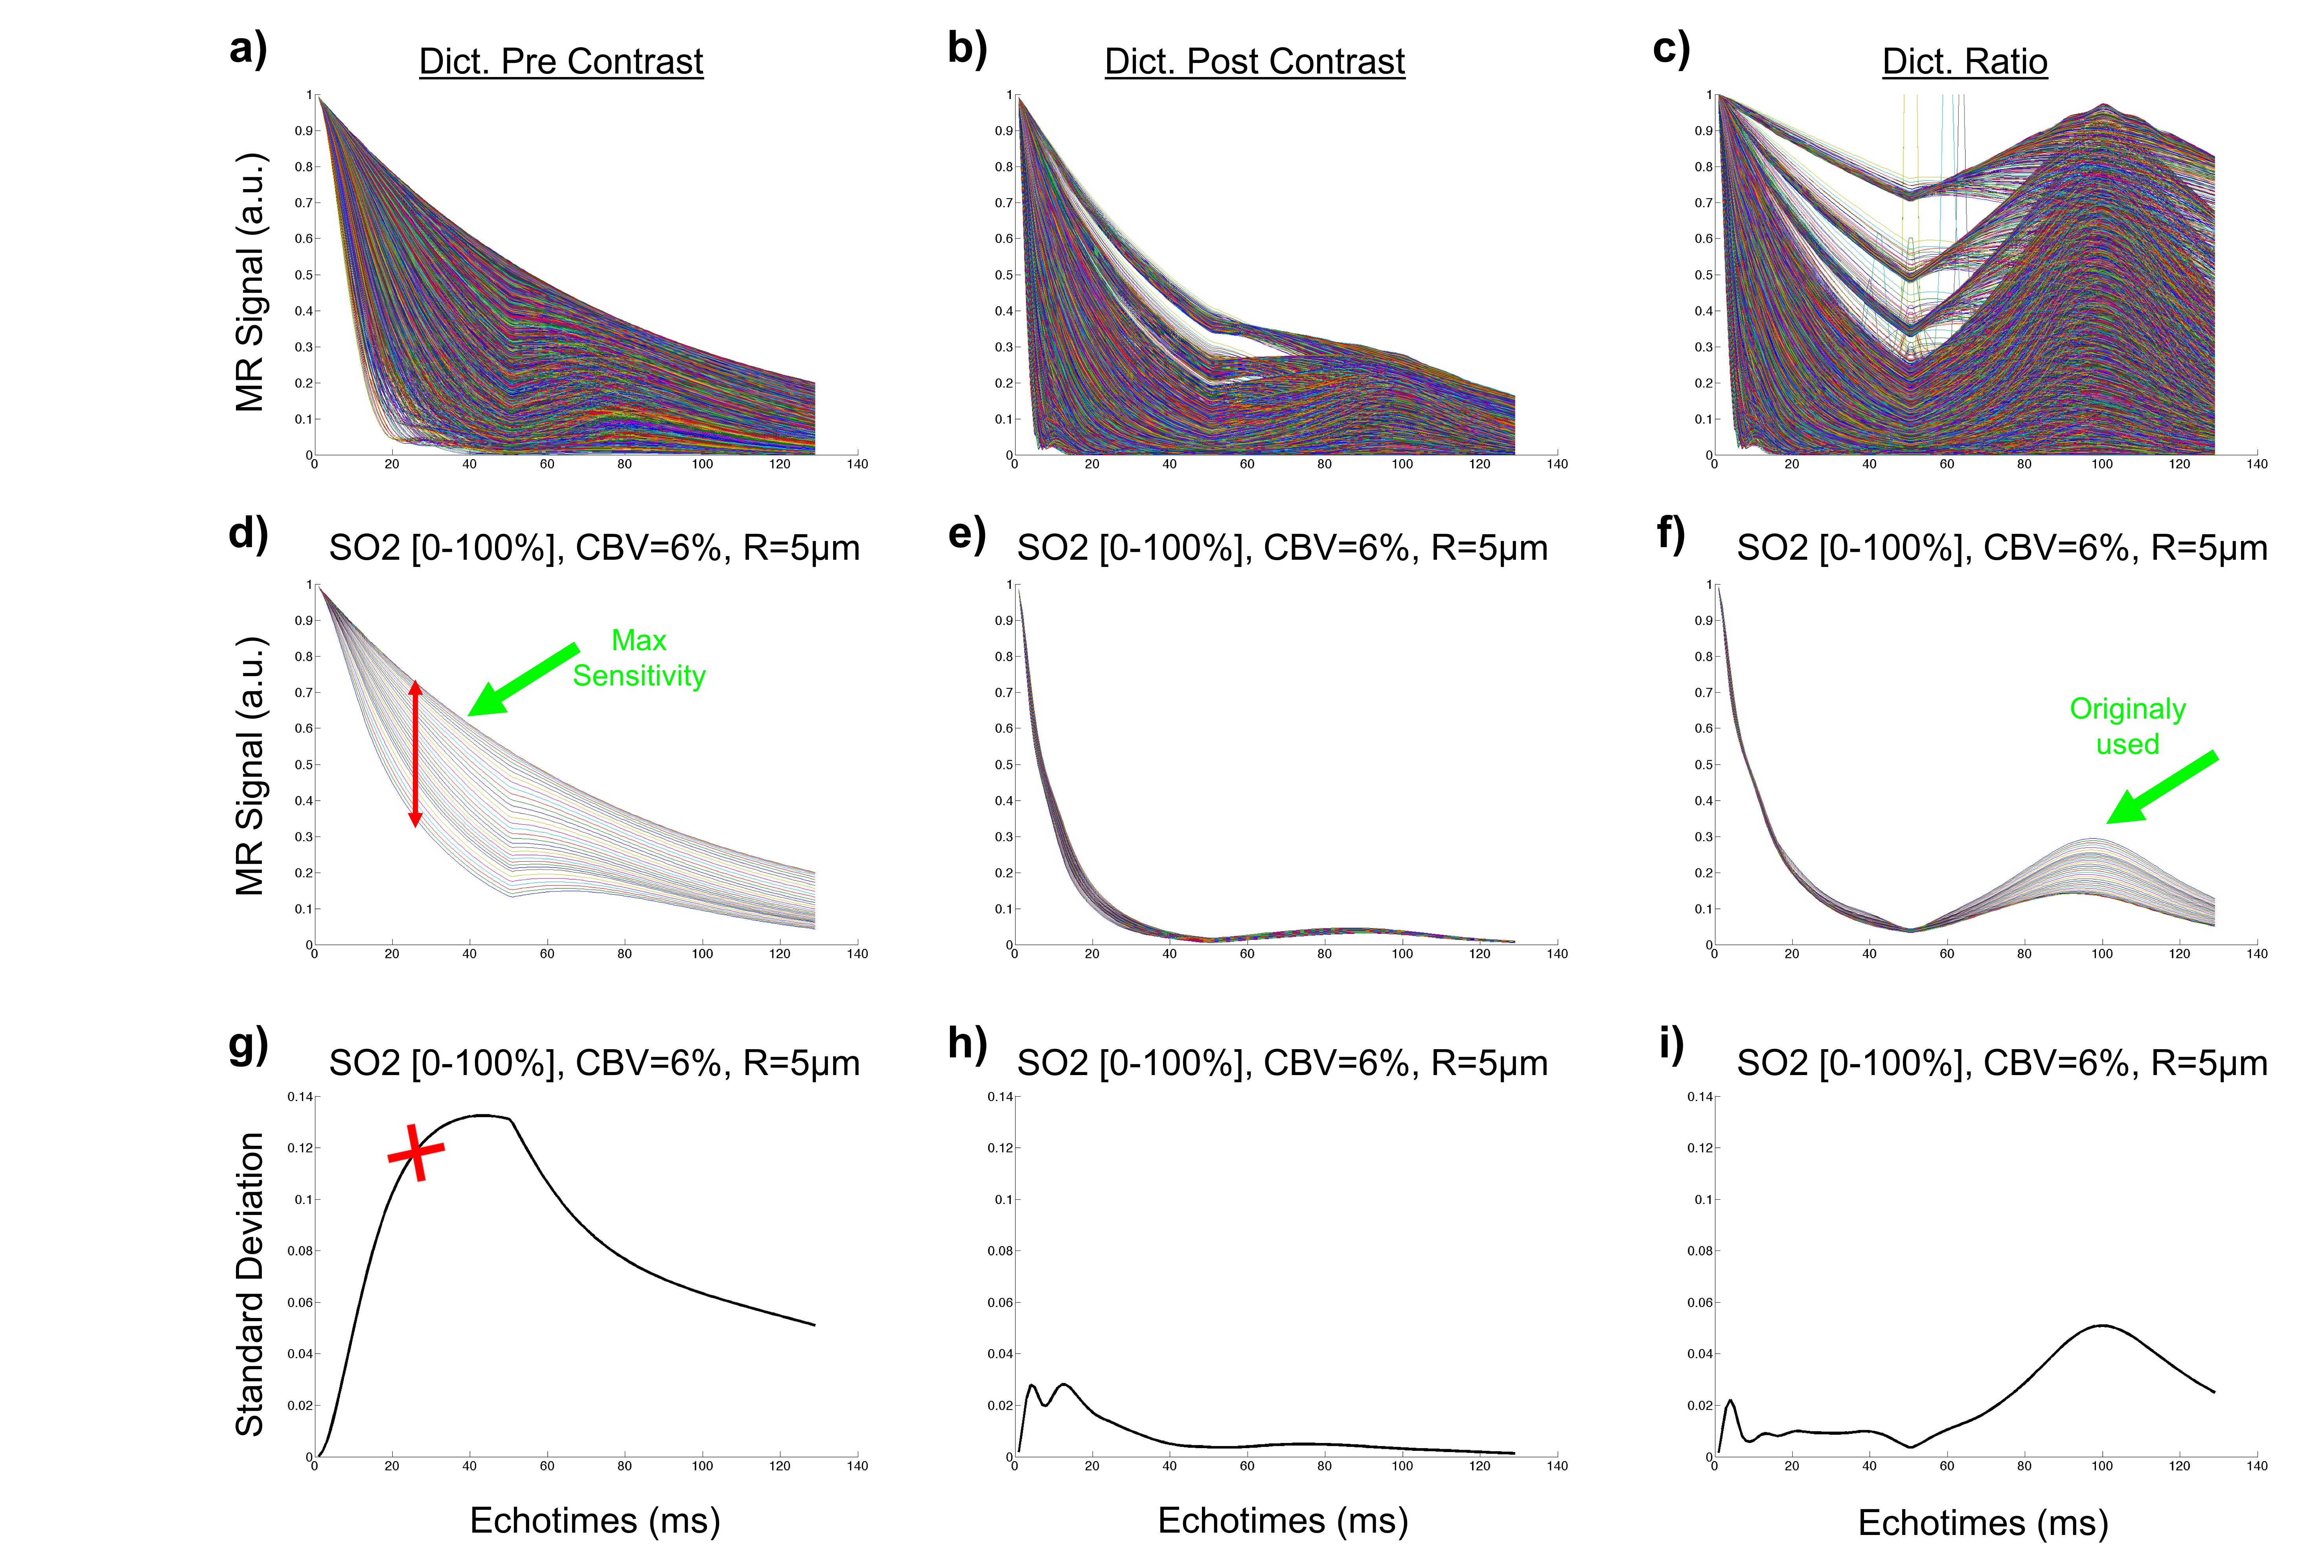
Figure 3: SO2 effects on dictionary signals. A-C) Pre, Post and ratio dictionaries.
E-G) Subset of dictionaries when CBV and R are fixed. G-I) Standard deviation
of the curves in E-G computed at each echo time.
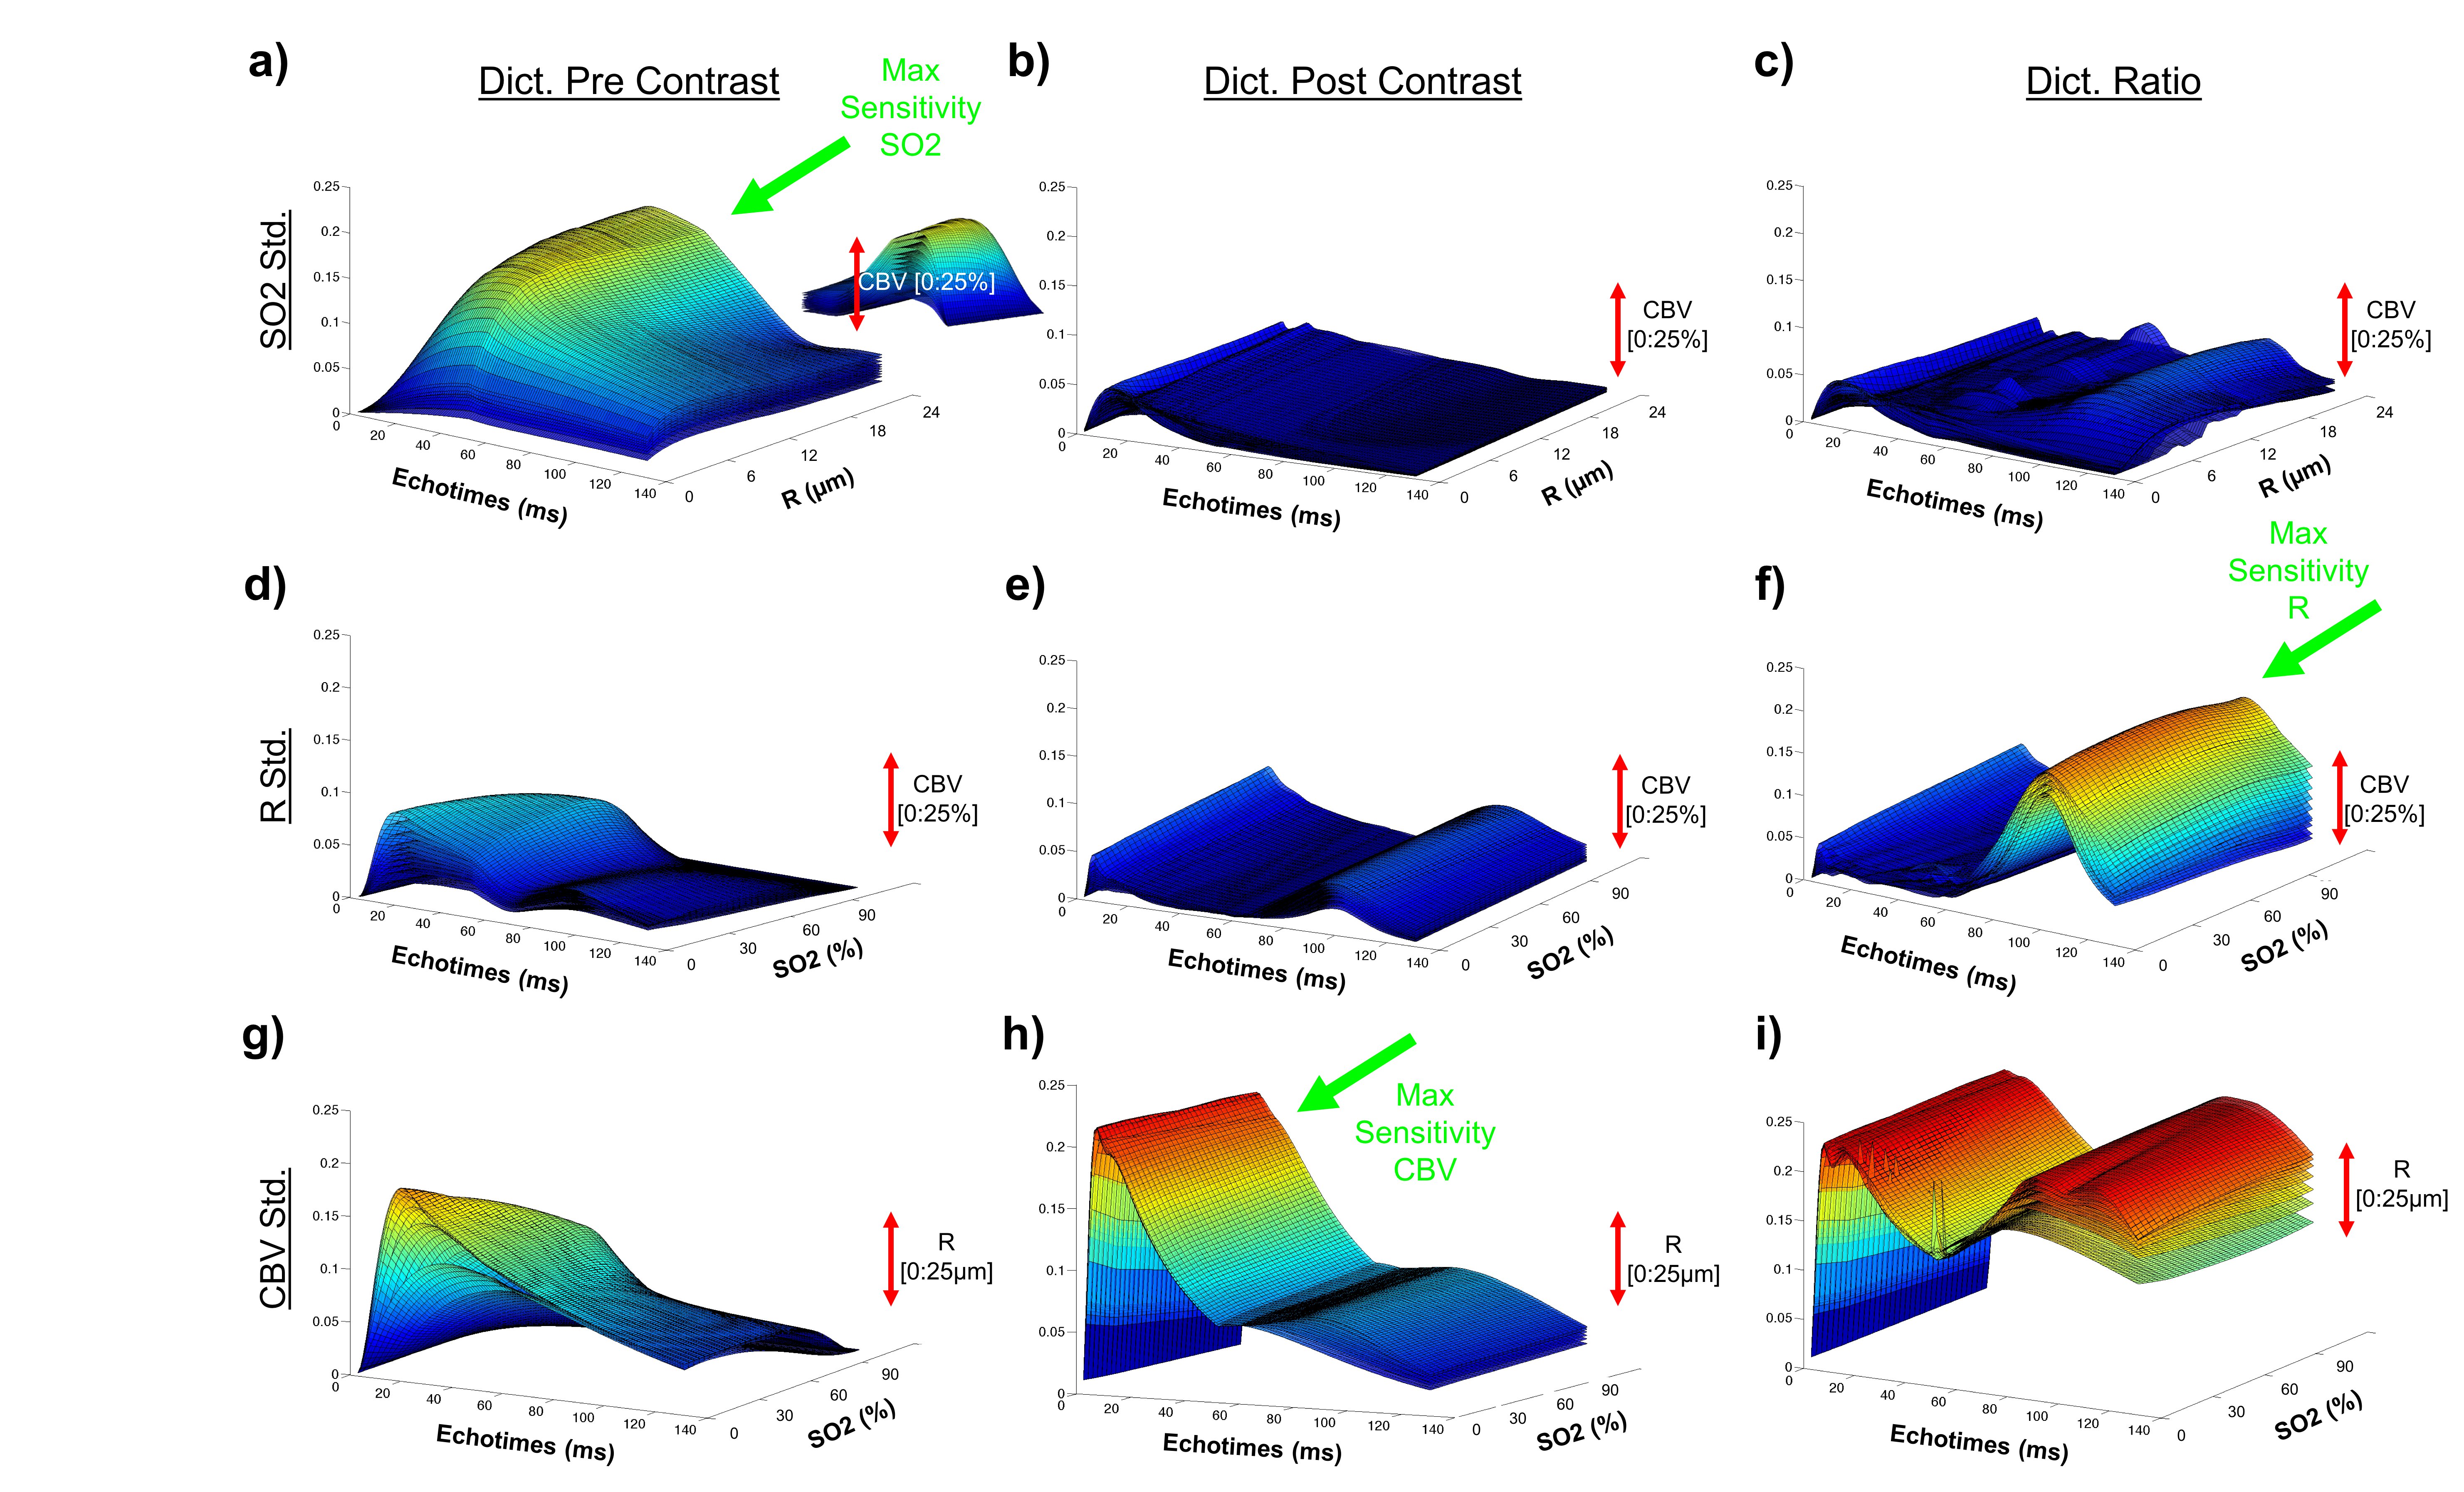
Figure 4: Standard deviation plots (see Figure3 G-I) are
extended in 3 dimensions to observe the effect of all parameters.
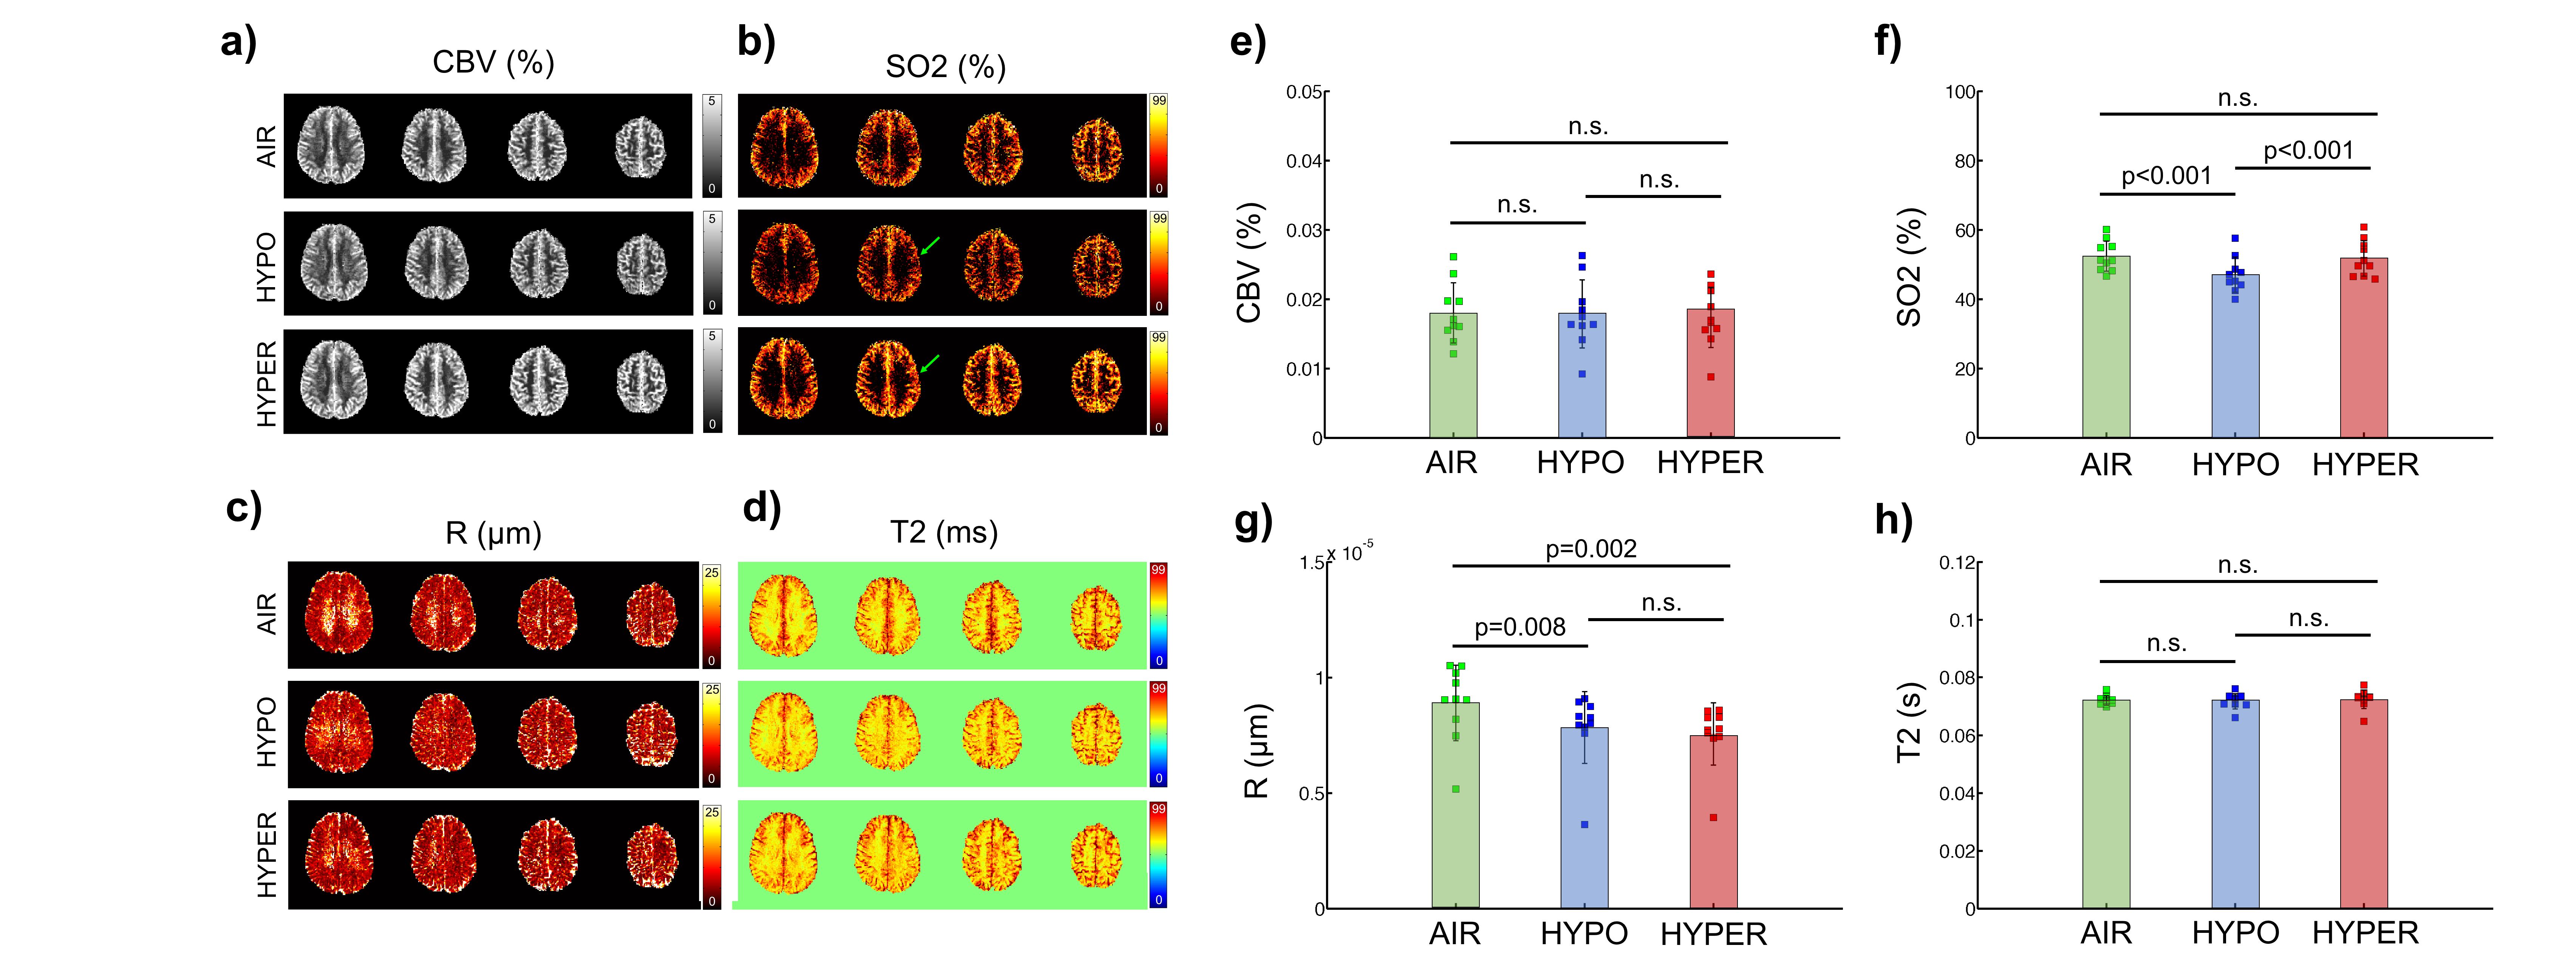
Figure 5: MRvF results obtained with the new concatenated
pre-post-ratio fingerprint. A-D) Maps obtained in one volunteers. E-H) Averaged
results obtained in 10 volunteers.