0672
1H-[13C]-NMR Investigations of Neuronal and Astroglial Metabolic Activity in Spinal Cord and Brain in Amyotrophic Lateral Sclerosis1NMR Microimaging and Spectroscopy, Centre for Cellular and Molecular Biology, Hyderabad, India
Synopsis
Amyotrophic lateral sclerosis (ALS) is neurodegenerative disorder resulting from selective loss of both upper and lower motor neurons leading to progressive muscle weakness and paralysis. In the present study, we have used 1H-[13C]-NMR spectroscopy in conjunction with infusion of [1,6-13C2]glucose to evaluate neurometabolic activity in SOD1G37R mouse model of ALS. Our finding suggest reduced levels of glutamate, NAA, NAAG, and increased concentration of myo-inositol in spinal cord. More interestingly, the metabolic activity of glutamatergic and GABAergic neurons is decreased in the spinal cord, while it was increased in the cerebral cortex indicating strikingly different pathology in spinal cord and brain.
Introduction
Amyotrophic lateral sclerosis (ALS) is a fatal and rapidly progressing neurodegenerative disorder resulting from selective degeneration of upper and lower motor neurons1. This leads to progressive muscle weakness, wasting and paralysis, culminating in death due to respiratory failure. Glutamate mediated excitotoxicity due to dysfunction in excitatory amino acid transporter 2 is considered to be a major mechanism leading to motor neuron degeneration in ALS2. Lack of efficient methods to diagnose ALS at early stages is a major problem in the development of successful treatment(s) for the disease. Previous studies have suggested alterations in metabolites homeostasis in motor and non-motor regions in ALS condition3,4. However, there is lack of understanding of how these alterations influence neuronal activity and neurotransmitter cycling in the nervous system. The objective of the current study is to evaluate neuronal metabolic activity in the spinal cord and regions of the brain in SOD1G37R mouse model of ALS using 1H-[13C]-NMR spectroscopy in conjunction with infusion of [1,6-13C2] glucose.Methods
All animal experiments were approved by institutional animal ethics committee of CCMB. Female SOD1G37R mutant mice (12 month age) were used as a model of ALS5. Mice were genotyped for the presence of transgene using taqman qPCR, and subsequently assigned into ALS and control groups. Limb strength was assessed by paw grip strength meter. For neurometabolic study, mice fasted for 8 hrs were anesthetized using urethane (1.5 g/kg, i.p), and infused with [1,6-13C2]glucose6. Blood was obtained from the retro-orbital sinus for analysis of substrate enrichment in the plasma, and head was frozen at 10 min for further analysis of amino acids labeling in brain. Metabolites were extracted from dissected brain regions such as cerebral cortex, striatum, brain stem and spinal cord using ethanol extraction protocol7. The concentration and 13C labeling of cerebral amino acids in the tissue extracts were measured in 1H-[13C]-NMR spectrum using 600MHz spectrometer8. The rates of neuronal glucose oxidation was measured as described previously9. Student's t test was carried out to obtain the significance of difference between SOD1G37R and control mice.Results
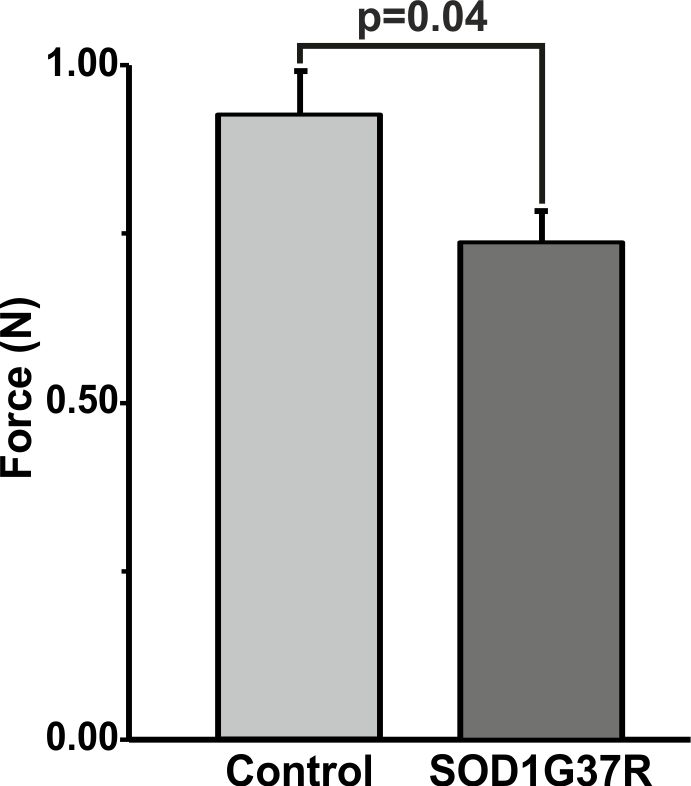
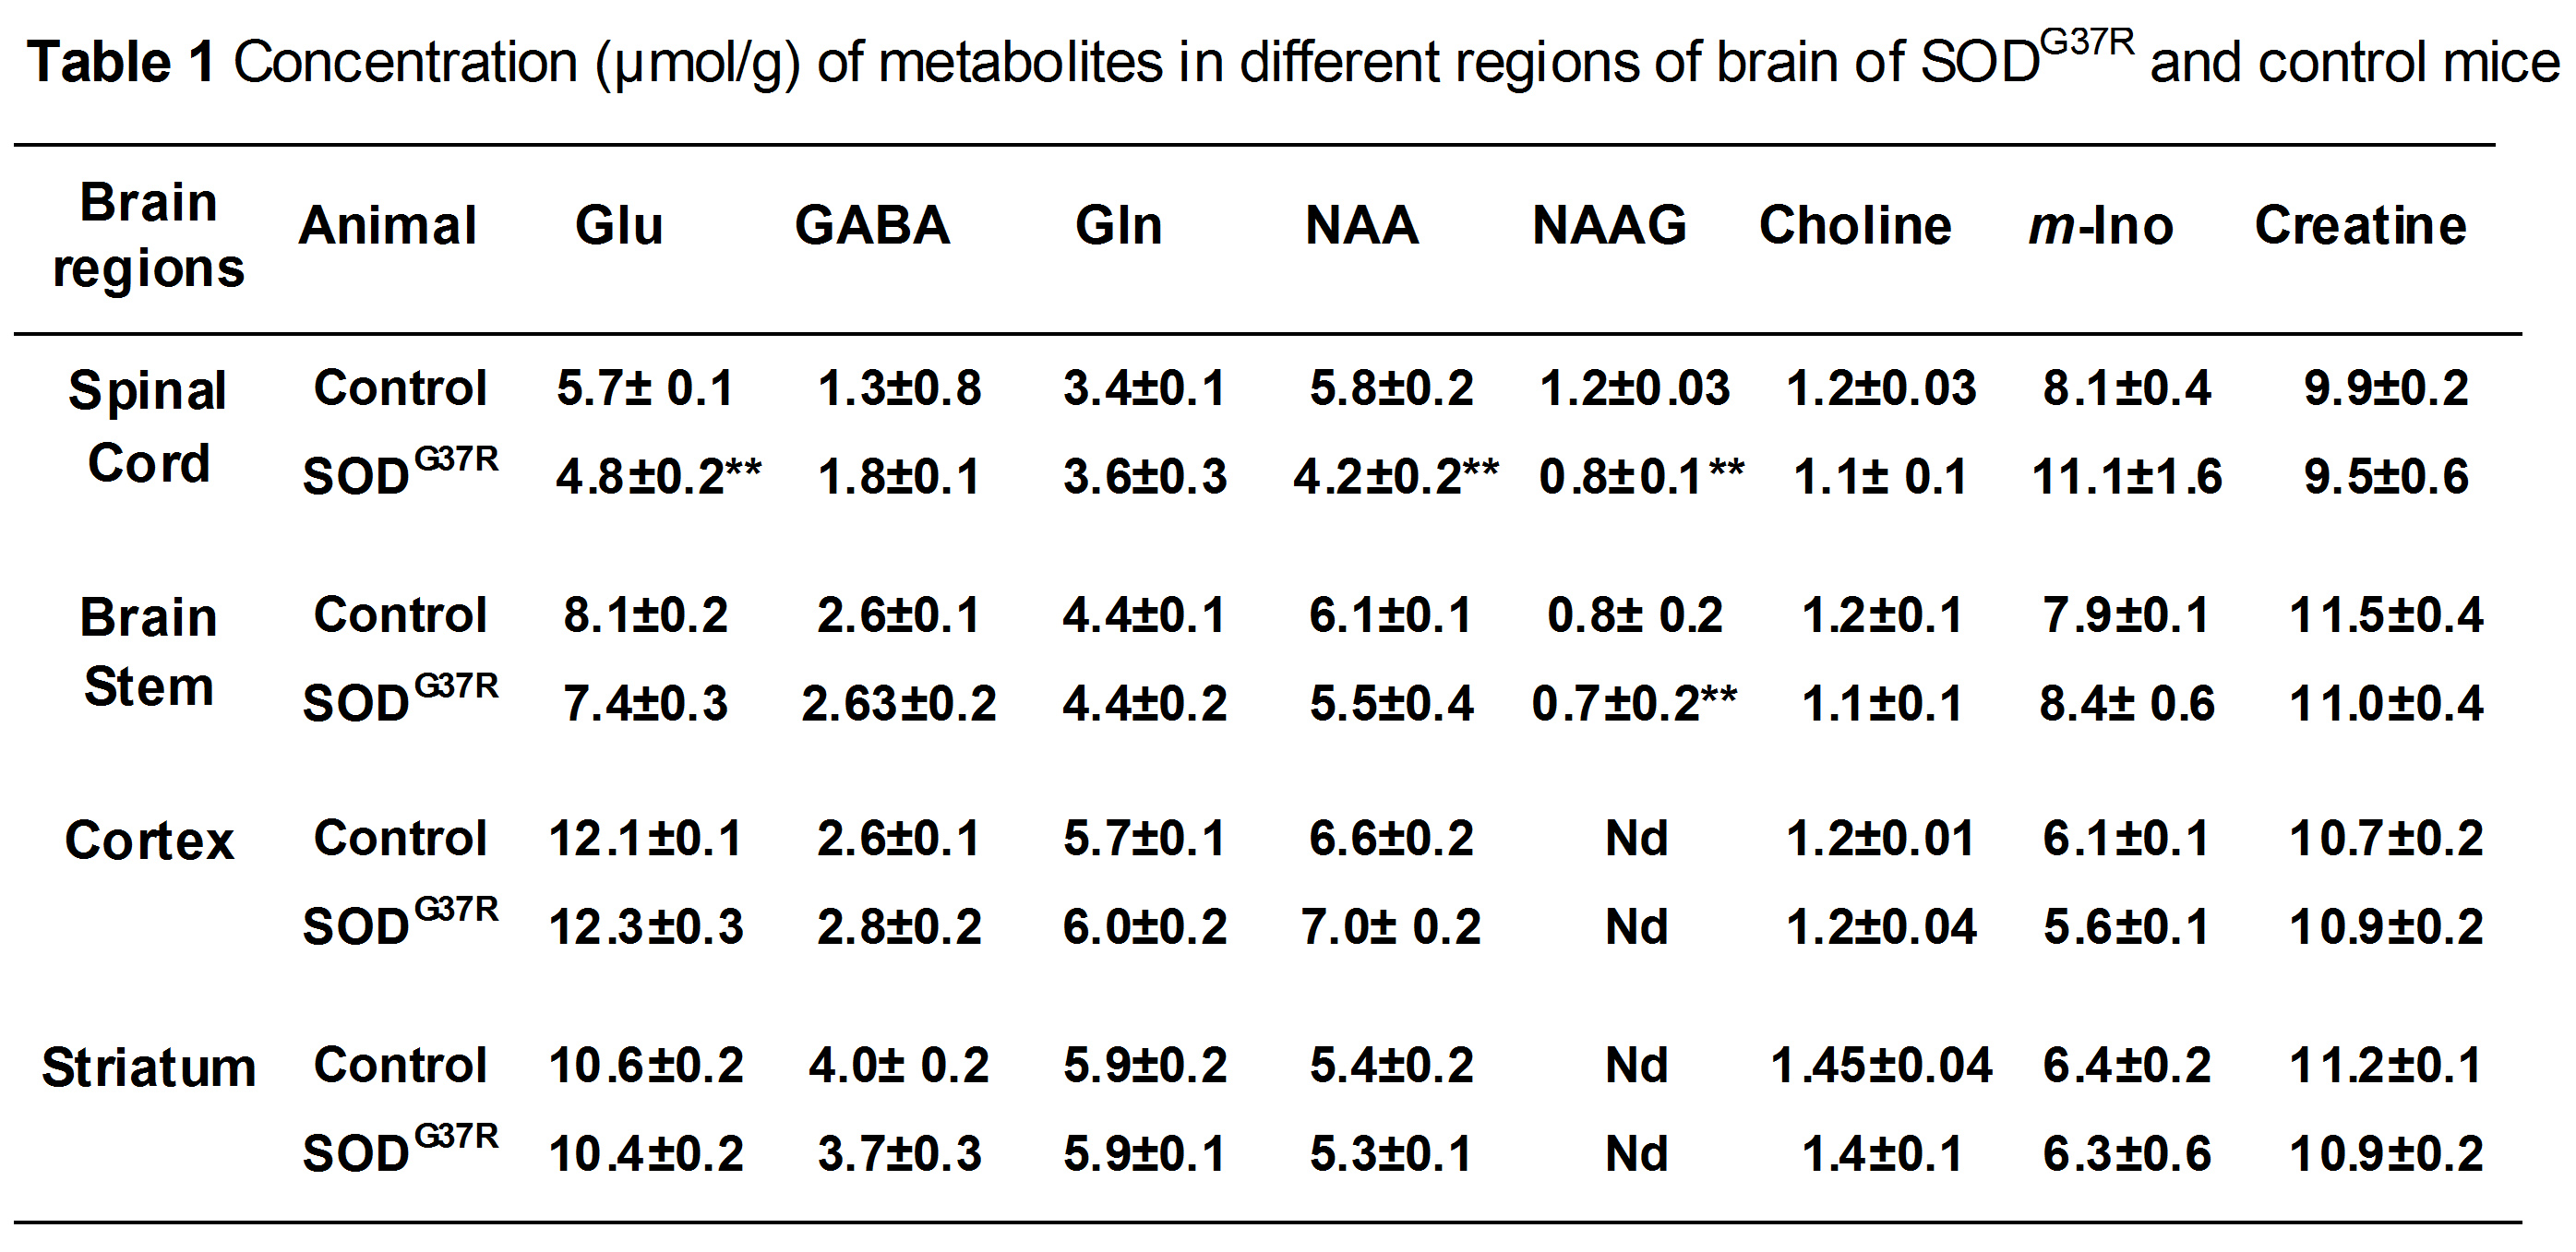
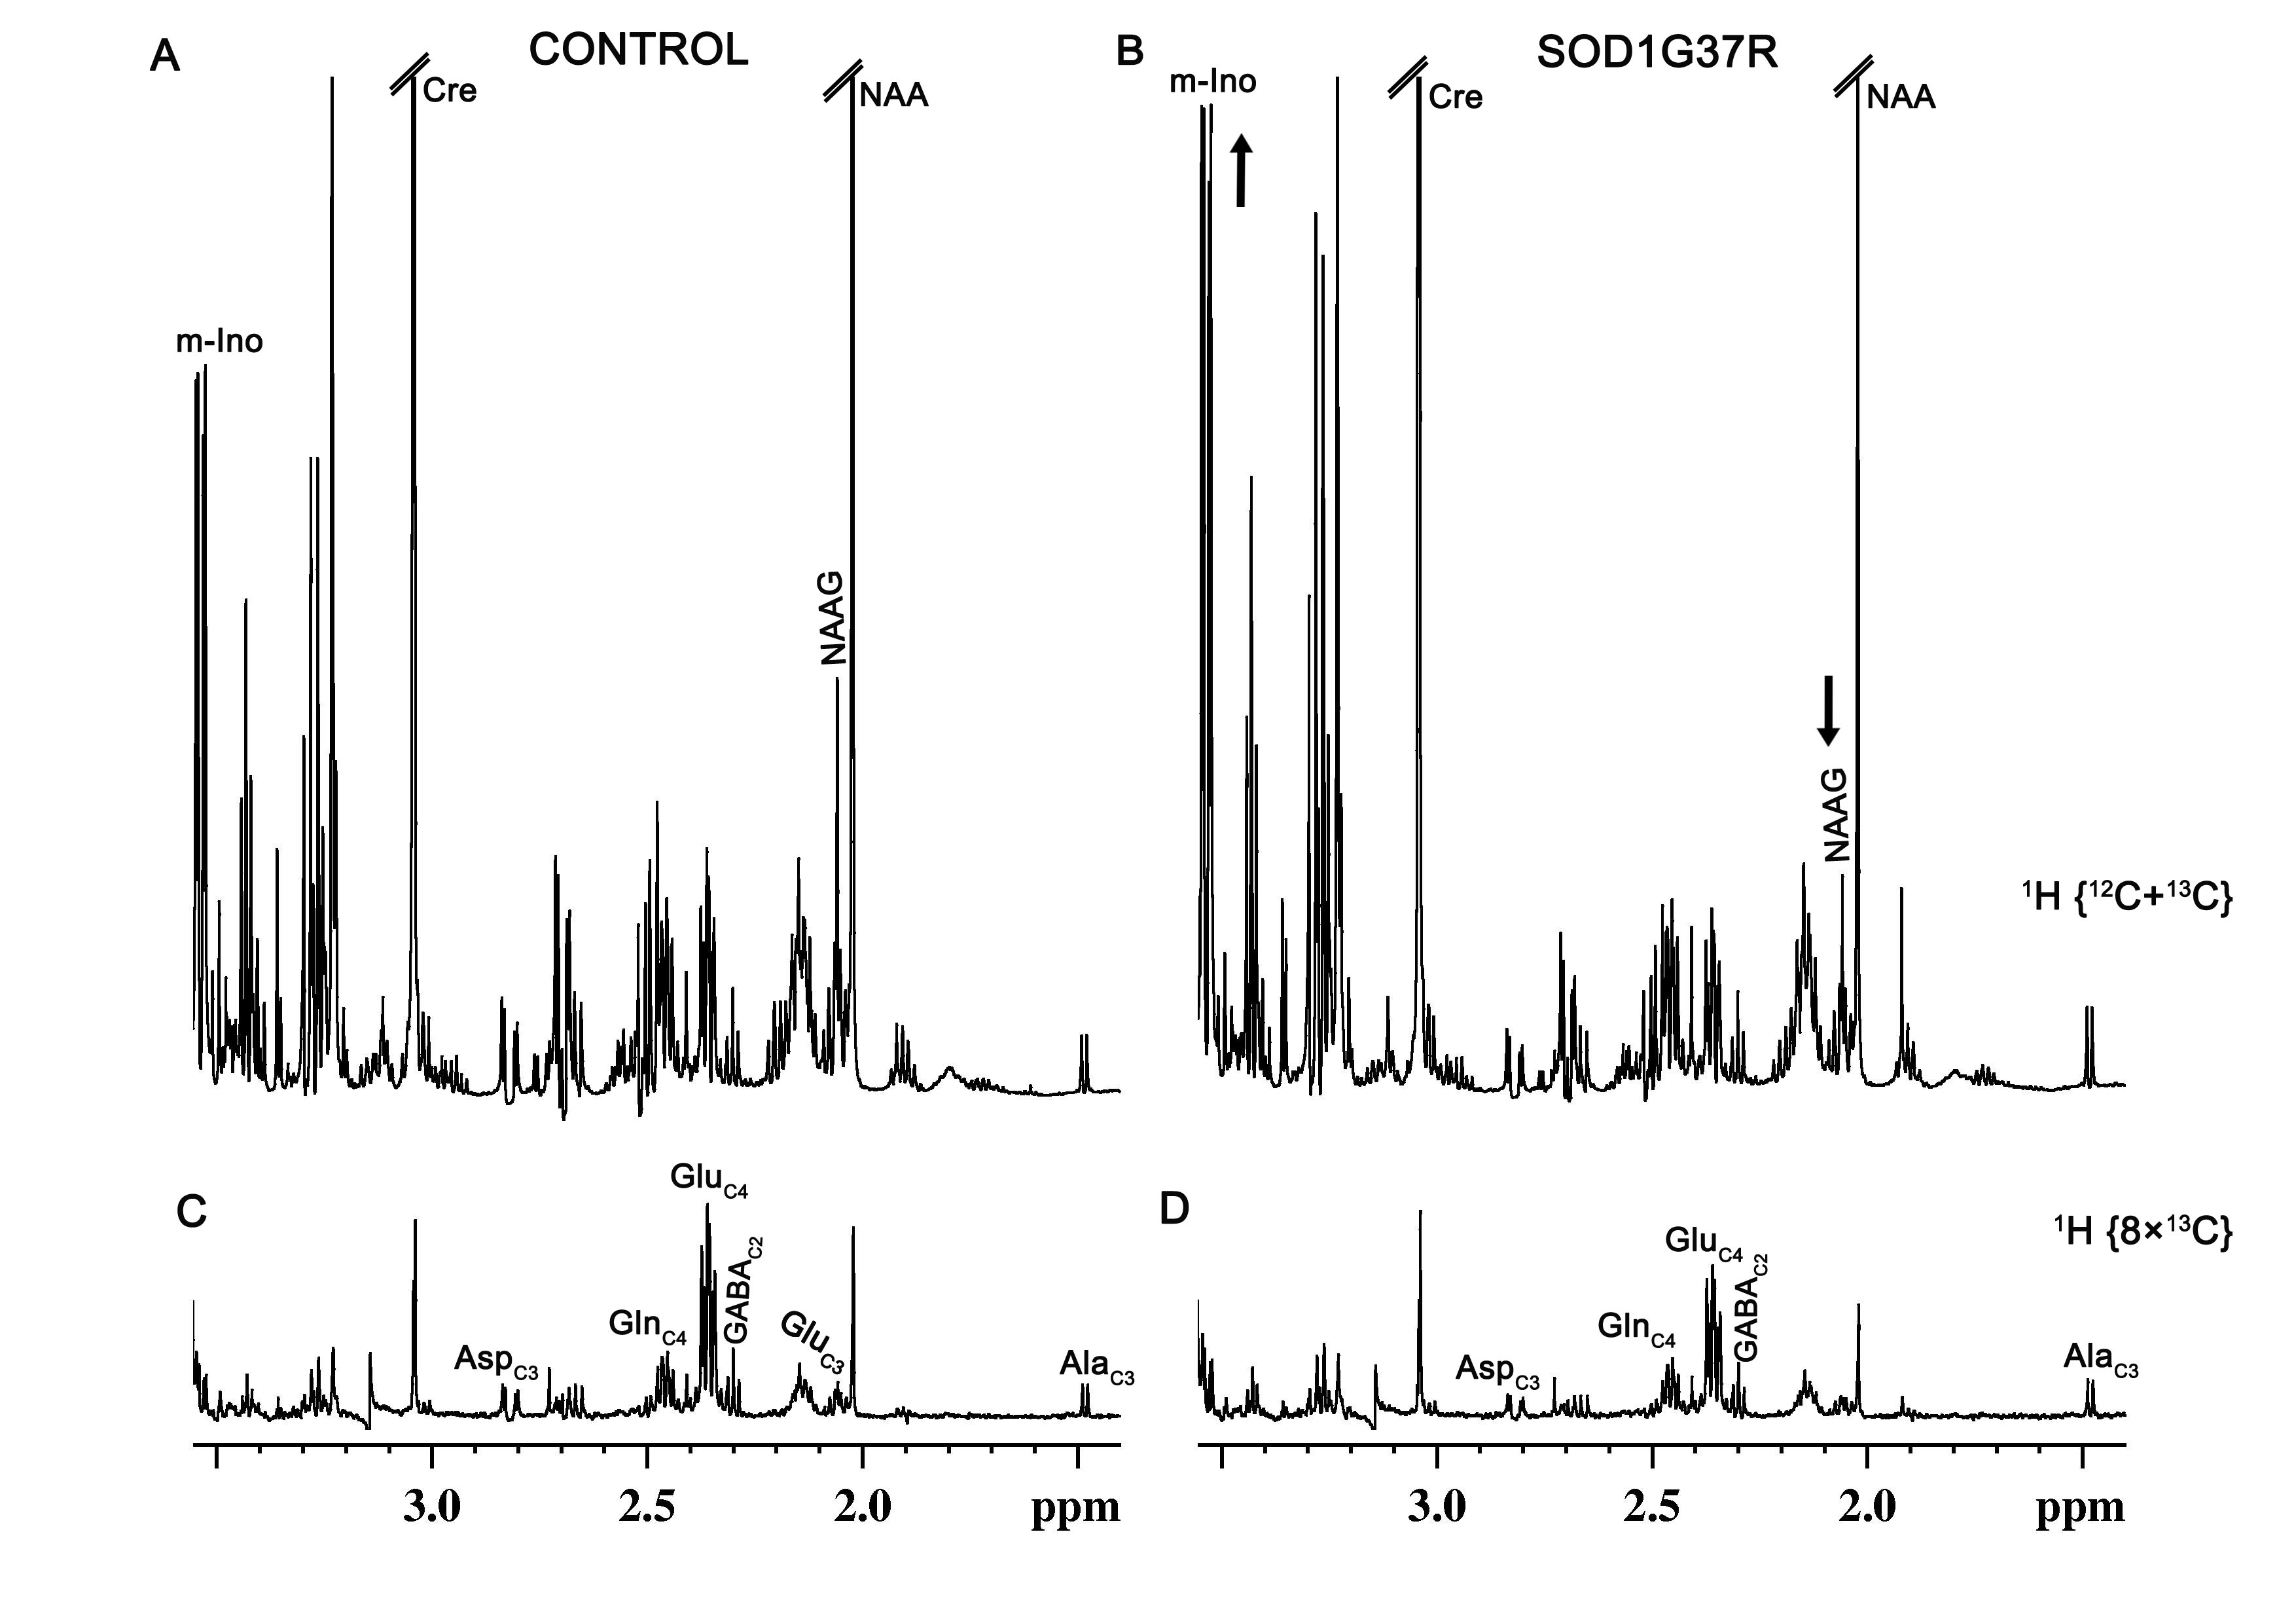
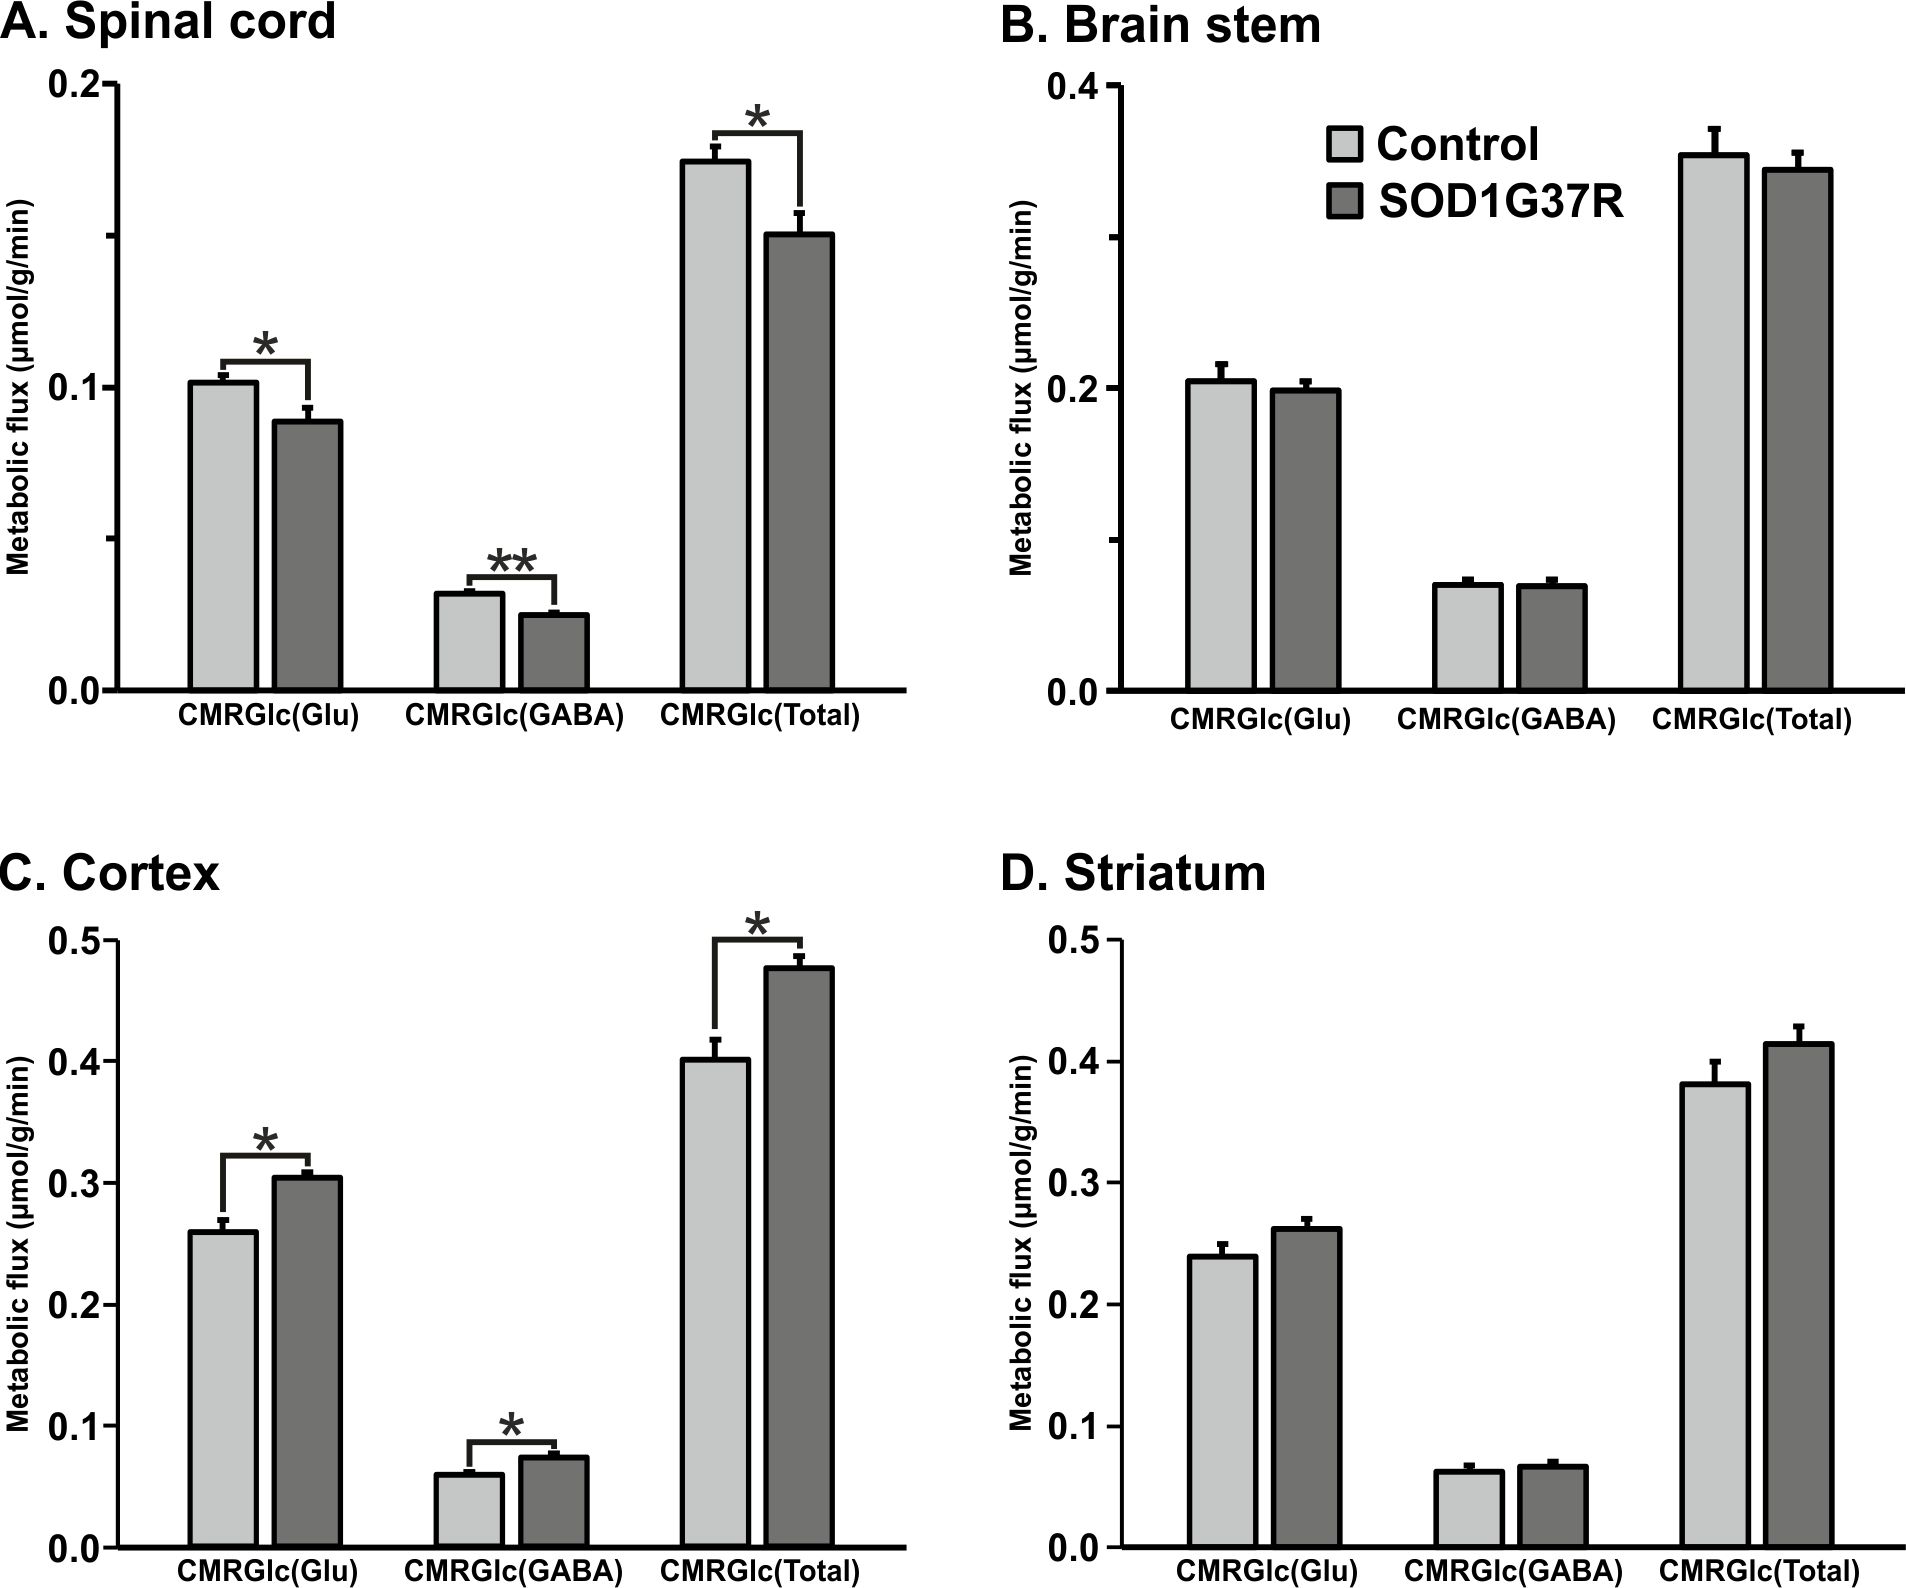
SOD1G37R mice exhibited significant (p=0.04) reduction grip strength (SOD1G37R 0.71±0.10N; Control 0.91±0.08N) (Fig.1), and rigid paralysis when compared with age-matched controls suggesting ALS-like phenotype in SOD1G37R mice. There was significant reduction in the levels of glutamate (SOD1G37R 4.8±0.2 µmol/g; Control 5.7±0.1 µmol/g, p=0.006), N-acetyl aspartate (NAA) (SOD1G37R 4.2±0.2 µmol/g; Control 5.8±0.2 µmol/g, p=0.001) and N-acetyl aspartate glutamate (NAAG) (SOD1G37R 0.8±0.1 µmol/g; control 1.2±0.03 µmol/g, p=0.001) in the spinal cord of SOD1G37R mice when compared with the age-matched controls (Figure 2). No significant changes in the levels of other neurometabolites were observed in the cerebral cortex, striatum and brain stem. The 13C labeling of GluC4 (SOD1G37R 0.73±0.04 µmol/g; Control 0.88±0.02 µmol/g) and GABAC2 (SOD1G37R 0.09±0.01 µmol/g; Control 0.12±0.01 µmol/g) was significantly reduced (Figure 3) in spinal cord when compared with the age matched controls suggesting reduced glucose metabolism in SOD1G37R mice (Figure 4). In contrast, 13C labeling of GluC4 (SOD1G37R 2.54±0.04 µmol/g; Control 2.26±0.06 µmol/g), GABAC2 (SOD1G37R 0.28±0.01 µmol/g; Control 0.25±0.01 µmol/g) and GlnC4 (SOD1G37R 0.36±0.01 µmol/g; Control 0.30±0.01 µmol/g) was significantly increased in the cerebral cortex of SOD1G37R mice (Figure 3) suggesting increased glutamatergic and GABAergic neuronal metabolic activity in the cerebral cortex (Figure 4). Mutation in SOD1 contributes in progressive impairment of metabolic activity in non-motor regions of the brain (striatum), at later time points 18 months (data not depicted).Discussion
The preclinical diagnosis of ALS with the use of specific biomarkers will aid in early treatment before it reaches to a state of irreversible stage. As neuronal glucose oxidation is stoichiometrically coupled with neurotransmitter cycling10, the hypo- and hyper-glucose metabolism suggest decreased and increased neurotransmitter cycling in the spinal cord and cerebral cortex in ALS. The data provide an evidence for an early metabolic dysfunction in the spinal cord, and hyper activity in the cerebral cortex that occurs prior to the death of motor neurons. Moreover, the findings support the view that metabolic heterogeneity among different brain regions involving upper or lower motor neurons is an early feature of symptoms in the SOD1G37R mouse model of ALS.Acknowledgements
Authors would like to thank Mr. Sreemantula Arun Kumar and Mr. Bhargidhar Babu for their help in conducting animal studies. The study was supported by funding from CSIR-CCMB.References
1. Taylor JP, Brown RH and Cleveland D (2016) Decoding ALS: from genes to mechanism. Nature 539(7628):197-206.
2. Corona JC, Tovar-y-Romo LB and Tapia R (2007) Glutamate excitotoxicity and therapeutic targets for amyotrophic lateral sclerosis. Expert Opinion Therapeutic targets, 11(11):1415-1428.
3. Ludolph AC, Langen KJ, Regard M, et al (1992) Frontal lobe function in amyotrophic lateral sclerosis: a neuropsychologic and positron emission tomography study. Acta Neurol Scand 85(2):81-89.
4. Niessen HG, Debska‐Vielhaber G, Sander K, et al (2007) Metabolic progression markers of neurodegeneration in the transgenic G93A-SOD1 mouse model of amyotrophic lateral sclerosis. Eur J Neurosci 25(6):1669-1677.
5. Wong PC, Pardo CA, Borchelt DR, et al. (1995) An adverse property of a familial ALS-linked SOD1 mutation causes motor neuron disease characterized by vacuolar degeneration of mitochondria. Neuron 14(6):1105-1116.
6. Fitzpatrick SM, Hetherington HP, Behar KL and Shulman RG (1990) The Flux from Glucose to Glutamate in the Rat Brain in vivo as Determined by 1H Observed 13C-Edited NMR Spectroscopy. J Cereb Blood Flow Metab 10(2):170-179.
7. Patel AB, Rothman DL, Cline GW and Behar KL (2001) Glutamine is the major precursor for GABA synthesis in rat neocortex in vivo following acute GABA-transaminase inhibition. Brain Res 919(2):207-220.
8. de Graaf RA, Brown PB, Mason GF, et al. (2003) Detection of [1,6-13C2]glucose metabolism in rat brain by in vivo 1H-[13C]-NMR spectroscopy. Magn Reson Med 49(1):37-46.
9. Patel AB, de Graaf RA, Mason GF, Rothman DL, Shulman RG, Behar KL (2005) The contribution of GABA to glutamate/glutamine cycling and energy metabolism in the rat cortex in vivo. Proc Natl Acad Sci USA 102:5588-93.
10. Sibson NR, Dhankhar A, Mason GF, Rothman DL, Behar KL, Shulman RG. (1998) Stoichiometric coupling of brain glucose metabolism and glutamatergic neuronal activity. Proc Natl Acad Sci USA 95: 316–321.
Figures