0670
Spinal Cord MRS Biomarkers of Clinical Impairment in Chronic Spinal Cord Injury1Institute for Biomedical Engineering, University and ETH Zurich, Zurich, Switzerland, 2Department of Radiology, Swiss Paraplegic Centre, Nottwil, Switzerland, 3Max-Planck-Institute for Biological Cybernetics, Tuebingen, Germany, 4Spinal Cord Injury Center, University Hospital Balgrist, University of Zurich, Zurich, Switzerland, 5Department of Brain Repair and Rehabilitation, UCL Institute of Neurology, University College London, London, United Kingdom, 6Wellcome Trust Centre for Neuroimaging, UCL Institute of Neurology, University College London, London, United Kingdom, 7Department of Neurophysics, Max-Planck-Institute for Human Cognitive and Brain Sciences, Leipzig, Germany, 8Institute of Physics, Ernst-Moritz-Arndt University Greifswald, Greifswald, Germany
Synopsis
Remote neurodegenerative changes above the level of injury are present following traumatic spinal cord injury (SCI), resulting in atrophy of the cervical cord of up to 30%. This study investigates the underlying biochemical changes at the cellular and molecular level which may subtend the development of atrophy using latest magnetic resonance spectroscopy in the spinal cord in healthy controls and SCI patients. Furthermore, we screen for potential MRS biomarkers investigating the association of biochemical changes and clinical outcome.
Introduction
Methods
MR Protocol & Post-processing
We recruited 18 chronic SCI patients (nine male paraplegic, age=47.6±5.4 [y], years since injury=15.9±10.0; nine male tetraplegic, age=52.6±14.0 [y], years since injury=11.9±10.0) and 11 healthy controls (HC, male, age=44±11.7 [y]) for this study. The measurements were performed on a 3T scanner (Achieva, Philips Healthcare, Best, The Netherlands) using a 16 channel SENSE neurovascular coil. We used a T2 weighted image (0.5x0.5x3.2mm3) to place the spectroscopic volume of interest (6x9x35mm3) at the spinal level C2. We applied the metabolite cycling (MC) technique2 in combination with inner volume saturation3 (IVS) and outer volume suppression4 (OVS), and used a second-order projection-based shimming routine5. Each spectra contained 512 signal averages. LCModel (Provencher, 1993) was applied to fit the data using a simulated metabolite basis with 18 metabolites.
Clinical Assessment
The clinical assessment included a) the International Standards for Neurological Classification of Spinal Cord Injury (ISNCSCI) protocol for motor, light-touch and pin-prick scores6 and b) the Spinal Cord Independence Measure (SCIM) to measure daily life independence7.
Statistics
The statistical analyses were performed with R (R Core Team, 2016, Version 3.3.1). Group differences were assessed using the Kruskal-Wallis test. Correlations between the metabolic ratios and the clinical scores were tested using Spearman’s rank correlation.
Results
Total N-Acetyl-Aspartate (tNAA), choline containing compound (tCho), total creatine (Cr), glutamate and glutamine (Glx), and myo-Inositol (mI) have been reliably detected (CRLB<25%)[Fig. 1]. Para- and tetraplegic patients were compared to healthy controls on the tNAA/Cr, tCho/Cr, Glx/Cr, mI/Cr, tNAA/mI, tCho/mI and tNAA/tCho ratios. As shown in Fig. 2, we found significantly lower tNAA/mI and tCho/mI ratios in chronic SCI patients compared to HC (tNAA/mI: HC=0.93±0.16, SCI=0.68±0.22, P=0.003; tCho/mI: HC=0.24±0.04, SCI=0.20±0.05, P=0.043). Specifically, tetraplegic patients significantly differed from the healthy controls (tNAA/mI: HC=0.93±0.16, tSCI=0.59±0.23, P=0.002; tCho/mI: HC=0.24±0.04, tSCI=0.19±0.06, P=0.033), whereas paraplegic patients only showed a trend towards lower ratios. As shown in Fig. 3, both the tNAA/mI and Cho/mI ratios were positively associated to SCIM (tNAA/mI: P<0.001, R2=0.560; tCho/mI: P=0.002, R2=0.458) and pin-prick score (tNAA/mI: P=0.009, R2=0.353; tCho/mI: P=0.004, R2=0.415). In addition, lower levels of tCho/mI ratio was associated with lower light-touch (P=0.001, R2=0.529) and motor score (P=0.001, R2=0.531).Discussion
We acquired spectroscopic data for the first time in the cervical spinal cord of chronic spinal cord injury patients. We showed that tNAA/mI and tCho/mI are decreased in the cervical cord in chronic SCI patients, with more pronounced changes in tetraplegic patients compared to paraplegic patients reflecting the lesion proximity. Reductions of tNAA/mI and tCho/mI ratios can be either attributed to a decrease in tNAA and tCho, or an increase in mI, or both. tNAA is synthesized in the mitochondria of neurons from aspartic acid and acetyl-coenzyme A, and therefore presumably serves as a neuronal marker indicating the viability of the nervous tissue. tCho on the other hand is a marker for cell membrane turnover, and mI is a glial marker as it is primarily located within astrocytes and presumed to act as an osmolyte, upregulated in cases of neuro-inflammation. As decreases in tCho are in contrast to pre-clinical studies, we conclude that the observed lower ratios of tNAA/mI and tCho/mI in patients are mainly driven by reduction in tNAA and increases of myo-Inositol, indicating neurodegeneration and chronic inflammation. The tNAA/mI ratio as well as tCho/mI ratios were positively associated with sensory and motor scores, possibly indicating the presence of reactive astrocytes, which produce inhibitors of axonal regeneration8, thus leading to worse outcomes in SCI patients.Conclusion
This study shows lesion level dependent biochemical alterations related to chronic neuro-inflammation, neurodegeneration and demyelination in areas of cervical cord atrophy. Greater signs of neurodegeneration, demyelination and neuro-inflammation were associated with greater clinical impairment. These neuroimaging biomarkers offer new insights into biochemical alterations associated with neuro-inflammation in the atrophied cord after SCI. The clinical eloquence speaks to their amenability as surrogate markers in future clinical trials.Acknowledgements
The authors thank all the patients and healthy controls participating in this study. Funding by the Swiss National Science Foundation (Grant Number: 143715), the University of Zurich (Clinical Research Priority Program Multiple Sclerosis), the European Union (ERC Starting Grant, SYNAPLAST MR, Grant Number: 679927) and by Wings for Life (Austria, WFL-Ch-007/14) are gratefully acknowledged.References
[1] Freund P et al. Brain 2011;134(6):1610-22. [2] Hock A et al. MRM 2013;69(5):1253-60. [3] Edden RAE et al. MRM 2006;56(4):912-7. [4] Wilm B et al. MRM 2007;57(3):625-30. [5] Grutter R. MRM 1993;29(6):804-11. [6] Kirshblum SC et al. Journal of Spinal Cord Medicine. 2011;34(6):535-546. [7] Itzkovich M et al. Disabil Rehabil 2007;29(24):239-41. [8] Silver J et al. Neuroimage 2010;53(2):544-52.Figures
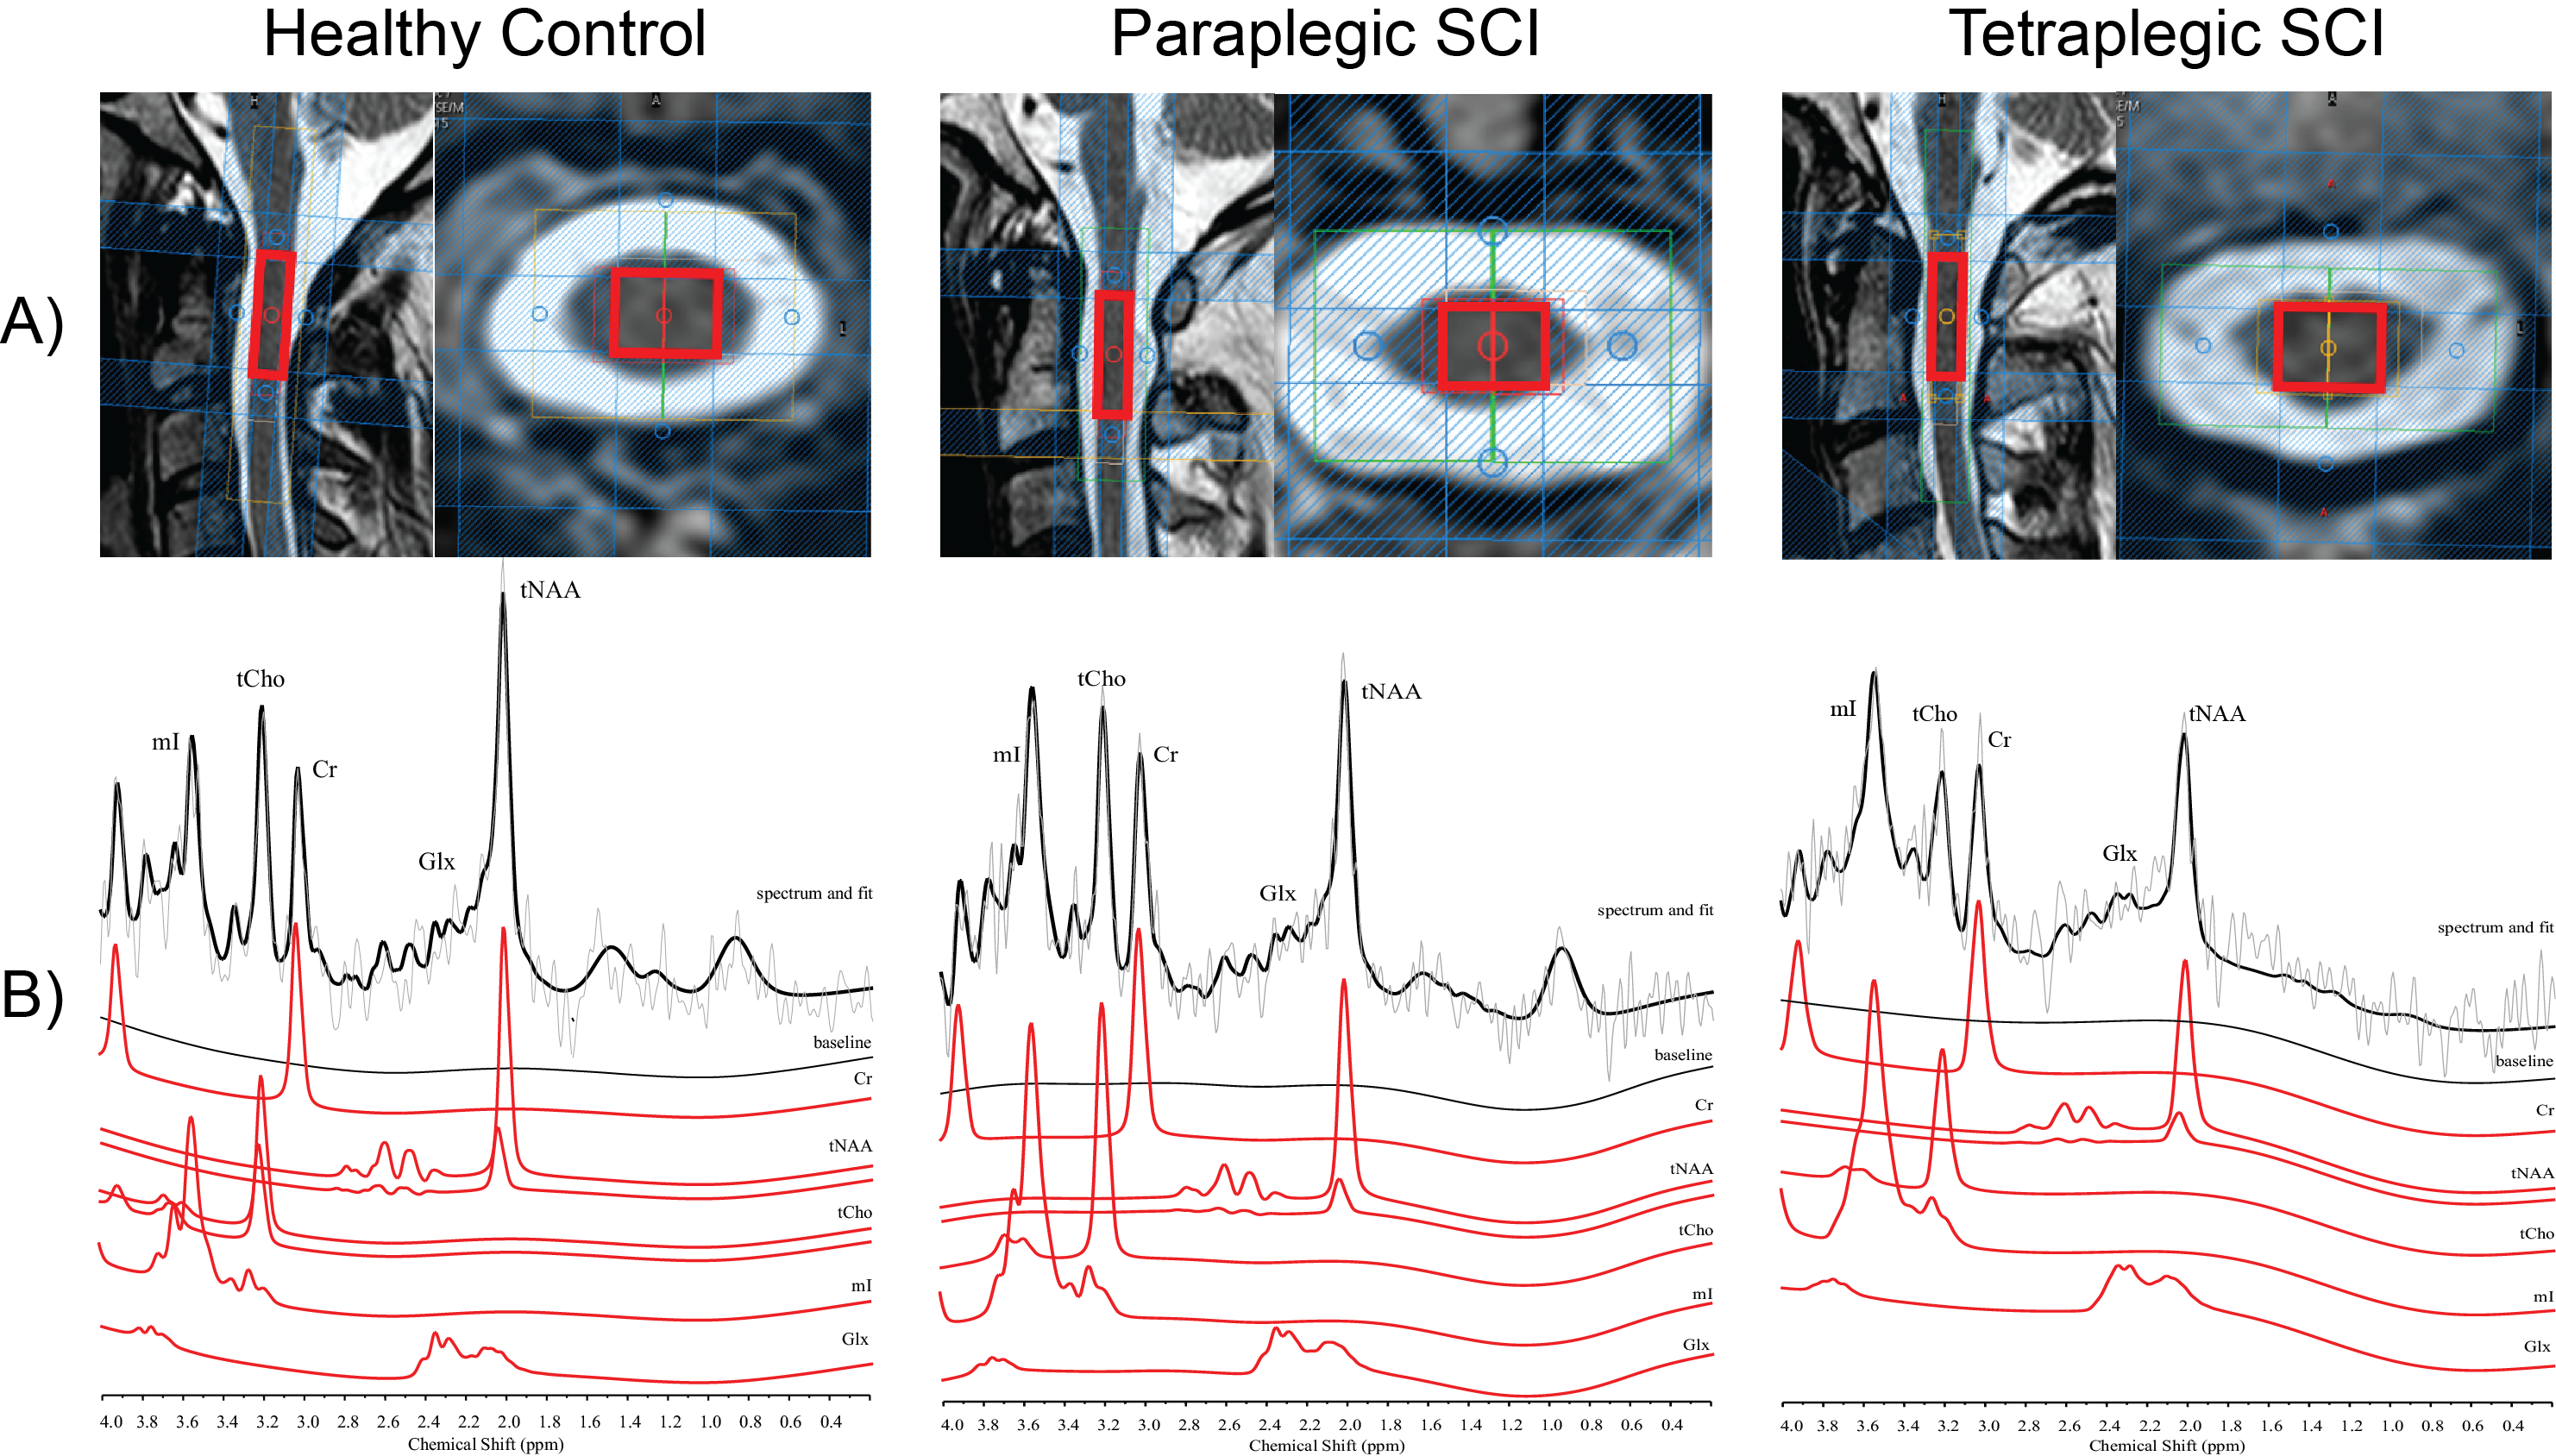
Fig.1: Voxel Localization and Representative Spectra
A) Magnetic resonance spectroscopy voxel localization in the spinal cord is shown. B) A representative spectrum acquired at level C2 is shown in the lower part. The acquired spectrum is overlaid by the fitted spectrum (black). Below the signal contributions of tNAA, Glx, Cr, tCho and mI as well as the baseline is depicted.
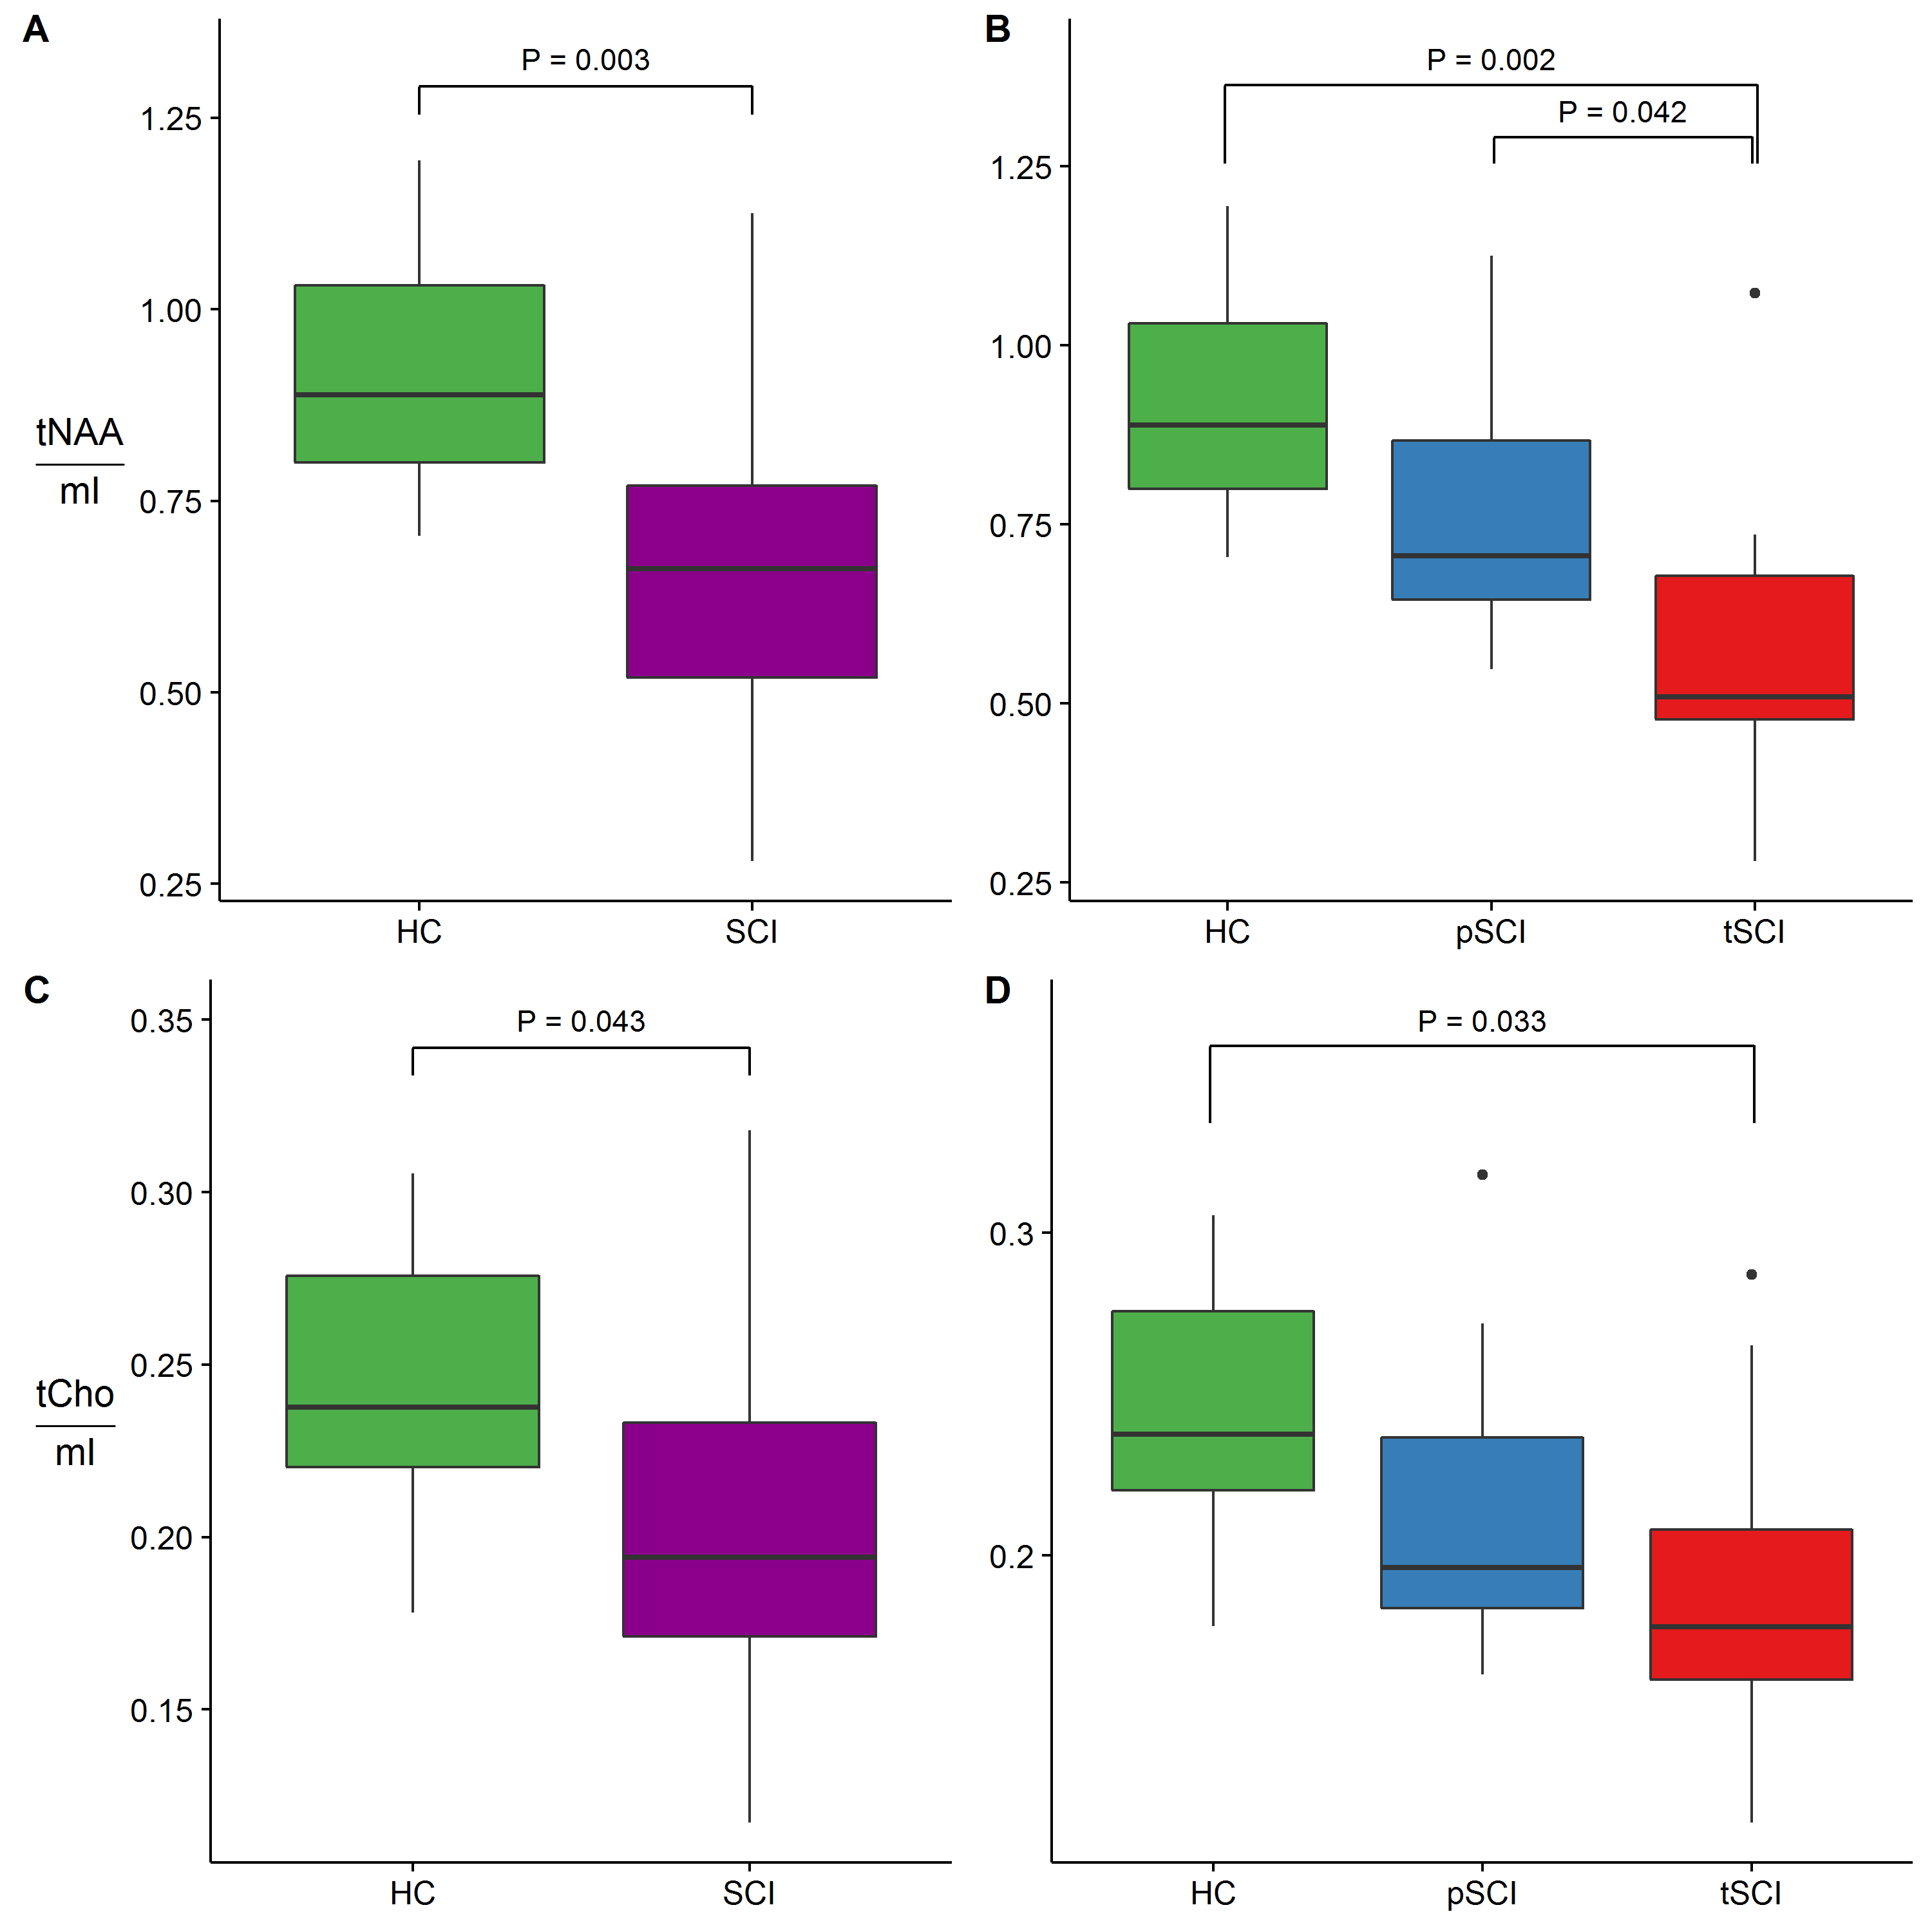
Fig.2: Lesion Proximity and Metabolic Ratios
The group differences of tNAA/mI (A,B) and tCho/mI (E,F) are shown for healthy control and spinal cord injury patients (SCI) (A,E) and for healthy controls, paraplegic SCI (pSCI) and tetraplegic SCI (tSCI) (B,F). Significant differences are labelled and uncorrected P values are denoted.
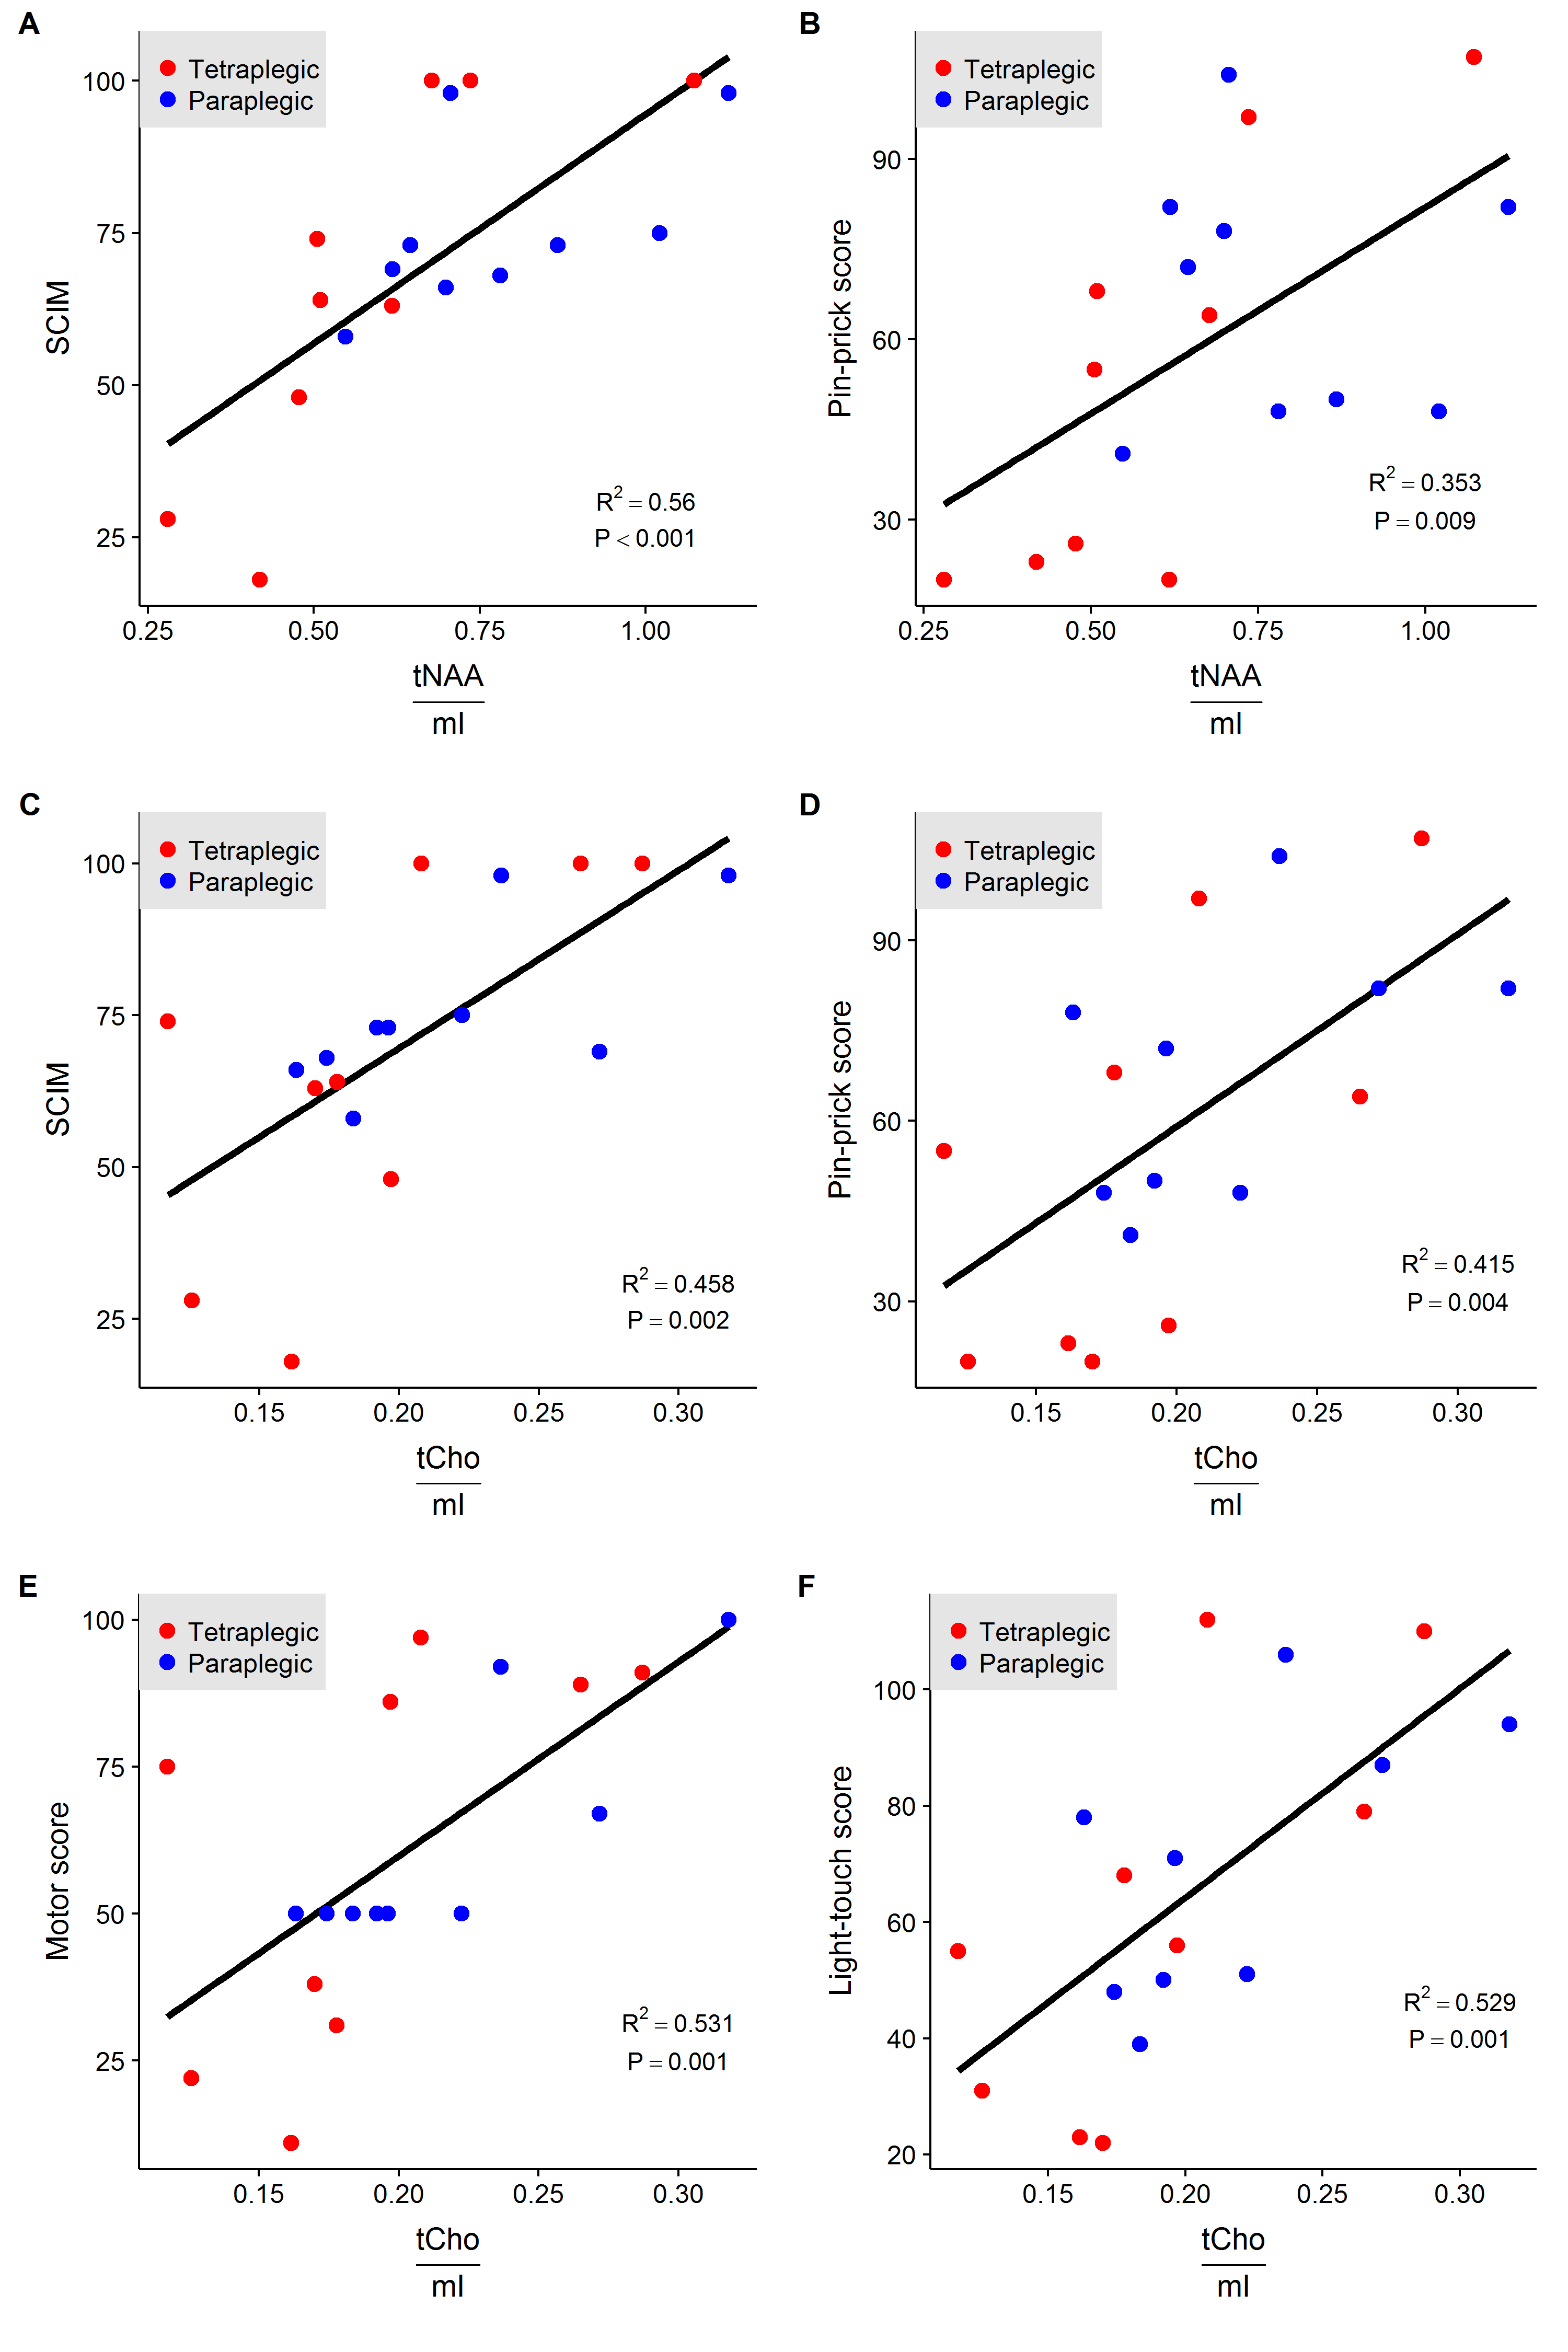
Fig.3: Metabolic Ratios and Clinical Outcome
Correlation plots of metabolite ratios and clinical score improvements. Figures A)-B) include tNAA/mI and the Spinal Cord Independence Measure (SCIM) and Pin-Prick-Score. Figures B –E show the correlations for tCho/mI and the SCIM, the Pin-Prick Score, the Motor Score and the Light-Touch Score