0669
Spinal cord MRI and fMRI at 16.4 T during spinal cord stimulation in rats: initial experience1Center for Magnetic Resonance in Research, University of Minnesota, Minneapolis, MN, United States, 2A.I. Virtanen Institute for Molecular Sciences, University of Eastern Finland, Kuopio, Finland, 3Neural Engineering Laboratory, Mayo Clinic, Rochester, MN, United States, 4Department of Integrative Biology and Physiology, University of Minnesota, Minneapolis, MN, United States
Synopsis
This study aims at paving the way for spinal cord MRI and fMRI during spinal cord stimulation (SCS) in rats, with the goal of providing an experimental framework for assessing the impact of SCS on neuroplasticity and functional circuitry. MRI and fMRI of the spinal cord during SCS are extremely challenging due to motion and electrode-induced susceptibility artefacts. Here we demonstrated that high quality MRI and fMRI images of the spinal cord could be obtained at 16.4T during SCS with recently developed MB-SWIFT. This is the first study that attempts spinal cord fMRI during SCS in rats.
Introduction
Spinal cord stimulation (SCS) is increasingly used to treat a variety of conditions, including chronic pain1 and hypertension.2 Recent breakthroughs have also shown promise of SCS in improving motor function and recovery after spinal cord injury3,4 and in neurological and movement disorders5. MRI and functional MRI (fMRI) of the spinal cord can play a vital role in assessing the impact of SCS on neuroplasticity and on the functional circuitry of the central nervous system. However, spinal cord MRI and fMRI during SCS are extremely challenging tasks, especially because of the small diameter of the spinal cord, the electrode-induced field distortions, and motion. In order to partially overcome these limitations, here we used ultra-high magnetic field 16.4T in combination with a 3D radial MRI pulse sequence entitled Multi-Band SWeep Imaging with Fourier Transformation (MB-SWIFT)6, which allows imaging with virtually no echo time and high acquisition bandwidth, and therefore is minimally sensitive to magnetic susceptibility artifacts originating from electrode-tissue interfaces.7 Overall, the aim of this study was to establish an experimental framework for spinal cord MRI and fMRI during SCS using MB-SWIFT at 16.4T. To the best of our knowledge, this is the first study that attempts spinal cord fMRI during SCS in rats.Methods
Animals (n=4) underwent a spinal laminectomy with implantation of a monopolar platinum wire electrode with Teflon coating (1 mm contact). The electrode was sutured on top of the dura or placed straight on top of the spinal cord by removing the dura at spinous processes L2 or T8-T9. Ag/AgCl grounding electrode was placed subcutaneously in the back. High resolution magnetization transfer (MT) weighted MB-SWIFT images were collected at 16.4T with TR = 2.96 ms, flip angle = 2°, 128 000 spokes, FOV = 5.0x5.0x12.8 cm3, and matrix size = 2563. MT-preparation included two 2-ms dual-band gauss pulses (ω1max = 625 Hz) with the bands located at ±1100 Hz off-resonance, applied every 80 acquisitions. MB-SWIFT fMRI was acquired with TR = 0.97ms, 3094 spokes per volume resulting in time resolution of 3s, flip angle = 2°, BW = 192kHz, FOV = 5.0x5.0x12.8 cm3, and matrix size = 643. The stimulation paradigm consisted of a block of 60s of rest followed by 18s of stimulation repeated three times ending with 60s of rest. Stimulation was achieved using 500 µs symmetric biphasic square pulses with amplitude between 0.2–0.7 mA. Different stimulation frequencies between 5-640 Hz were applied.Results
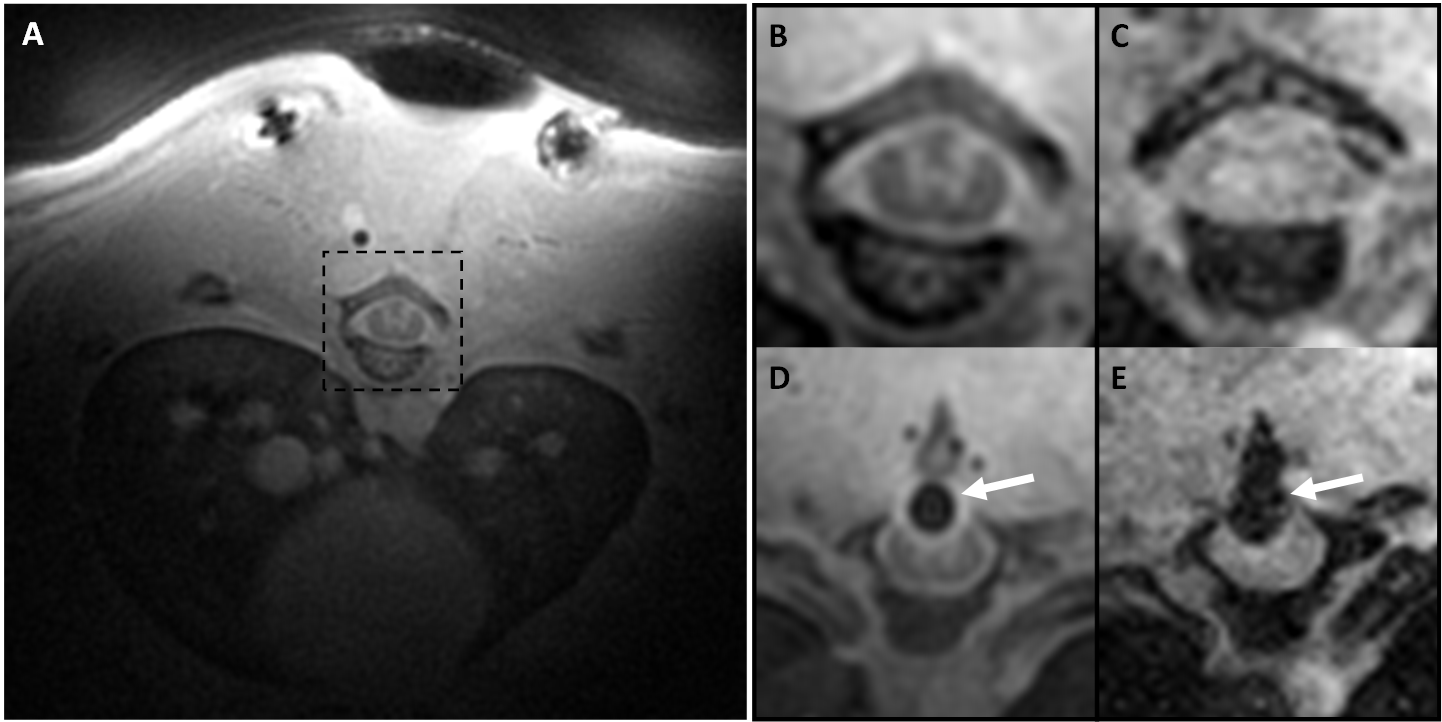
The MT-prepared MB-SWIFT image showed a superior contrast as compared to gradient echo (GRE) images in the rat spinal cord (Figure 1A-C). With MB-SWIFT, the spinal cord structures are visible even in the presence of the electrode (Figure 1D). The signal loss caused by the electrode is also reduced in the MB-SWIFT image (Figure 1D) as compared to the GRE image (Figure 1E).
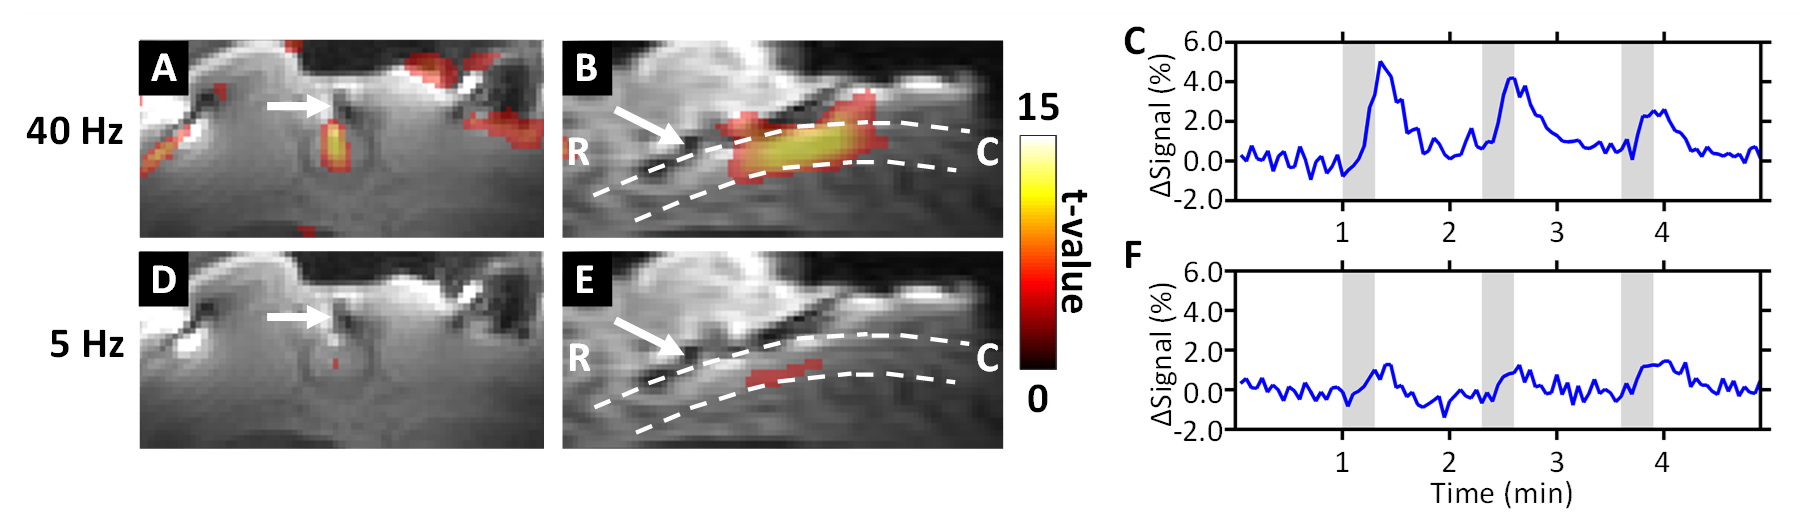
fMRI responses in the spinal cord were variable and strongly affected by the parameters of stimulation, including the frequency (Figure 2). Slow return to baseline of the fMRI signal, with no evidence of undershoot, was also evident post-stimulation. Stimulation at L2 induced more motion to the fMRI time-series and functional maps than stimulation at segments T8-T9. In addition, removal of dura impacted the required amplitude to induce stimulation of the spinal cord.
Examples of the MB-SWIFT fMRI activation maps of the spinal cord are shown in Figure 2 in the case of stimulation without dura at T9, during which motion did not impact the fMRI time-series.
Discussion
We demonstrated that high quality MRI and fMRI images of the spinal cord could be obtained at 16.4T for SCS applications. Enhanced contrast of the spinal cord was observed with MT-weighted MB-SWIFT sequence, which will be beneficial in assessment of injury and spinal cord regeneration. We also showed feasibility of rat spinal cord fMRI during SCS, although the activation maps often showed some level of motion which could not be avoided with the current set up. However, the time courses exhibited a slow return to the baseline, which is consistent with a true hemodynamical response to the stimulation. The motion induced by the stimulation may be overcome in future studies by paralyzing the animal.Conclusion
This initial experience with MRI and fMRI of the spinal cord during SCS paves the way for a plethora of studies involving SCS in applications such as spinal cord injury, plasticity assessment, pain, epilepsy or stroke, or involving spinal cord stimulation of different organs such as the brain, kidneys or heart. Different stimulation methods may also be studied, such as orientation selective stimulation8 of the spinal cord.Acknowledgements
We gratefully acknowledge our funders: NIH P41 EB015894, S10 RR025031, 1U01NS103569-01, Instrumentarium Science Foundation (HL, Finland), and The Emil Aaltonen Foundation (LJL, Finland).References
1. Song JJ, Popescu A, Bell RL. Present and potential use of spinal cord stimulation to control chronic pain. Pain Physician. 2014;17(3):235-246.
2. Victor RG. Carotid baroreflex activation therapy for resistant hypertension. Nat Rev Cardiol. 2015;12(8):451-463.
3. Harkema S, Gerasimenko Y, Hodes J, et al. Effect of epidural stimulation of the lumbosacral spinal cord on voluntary movement, standing, and assisted stepping after motor complete paraplegia: a case study. Lancet (London, England). 2011;377(9781):1938-1947.
4. Grahn PJ, Lavrov IA, Sayenko DG, et al. Enabling Task-Specific Volitional Motor Functions via Spinal Cord Neuromodulation in a Human With Paraplegia. Mayo Clin Proc. 2017;92(4):544-554.
5. Thiriez C, Gurruchaga J-M, Goujon C, Fénelon G, Palfi S. Spinal stimulation for movement disorders. Neurotherapeutics. 2014;11(3):543—552.
6. Idiyatullin D, Corum CA, Garwood M. Multi-Band-SWIFT. J Magn Reson. 2015;251:19-25.
7. Lehto LJ, Idiyatullin D, Zhang J, et al. MB-SWIFT functional MRI during deep brain stimulation in rats. Neuroimage. 2017;159:443-448.
8. Lehto LJ, Slopsema JP, Johnson MD, et al. Orientation selective deep brain stimulation. J Neural Eng. 2017;14(1):16016.
Figures