0668
In vivo visualization of white and gray matter sub-structures using fast quantitative T1 mapping of the human spinal cord at 7T with 300-µm in-plane resolution1Aix-Marseille Univ, CNRS, CRMBM, Marseille, France, 2iLab-Spine - Laboratoire international - Imagerie et Biomécanique du rachis, Marseille, France, 3APHM, Hôpital Universitaire Timone, CEMEREM, Marseille, France, 4Division of MRI Research, Department of Radiology, Beth Israel Deaconess Medical Center & Harvard Medical School, Boston, MA, United States
Synopsis
T1 mapping of the cervical spinal cord at 7T with a 300-µm in-plane resolution using the MP2RAGE sequence is presented. A semi-automated post-processing pipeline enabled group studies (n=10 healthy subjects) with quantitative evaluation within small spinal cord sub-structures from C1 to C7, explored for the first time using T1 mapping. This work lays the groundwork for improved characterization of spinal cord degeneration using 7T MRI, by allowing investigation within particular relevant regions such as the anterior/posterior gray matter horns and ventromedial white matter tracts. It also offers new perspectives to build dedicated spinal cord substructures templates.
Introduction
Magnetization-prepared rapid acquisition gradient echoes (MP2RAGE1,2) is a fast and robust T1 mapping sequence recently used3,4 to quantitatively investigate the spinal cord (SC) both at 3T and 7T. The maximal isotropic spatial resolution reported so far4 at 7T for SC imaging was (0.7 mm)3. Although sufficient to globally describe tissue alteration, this resolution is insufficient to properly investigate SC sub-structures within the gray matter (GM) horns or the ventral white matter (WM) funiculi for instance.
In this work, we therefore propose to run MP2RAGE acquisitions at 7T with a non-isotropic resolution of 0.3x0.3x5 mm3 that minimizes in-plane partial volume effect (PVE) contamination hence enabling T1 mapping of SC substructures along C1-to-C7 levels, including WM funiculi, GM motor columns and central canal, hence opening new perspectives for disease investigation and template building.
Methods
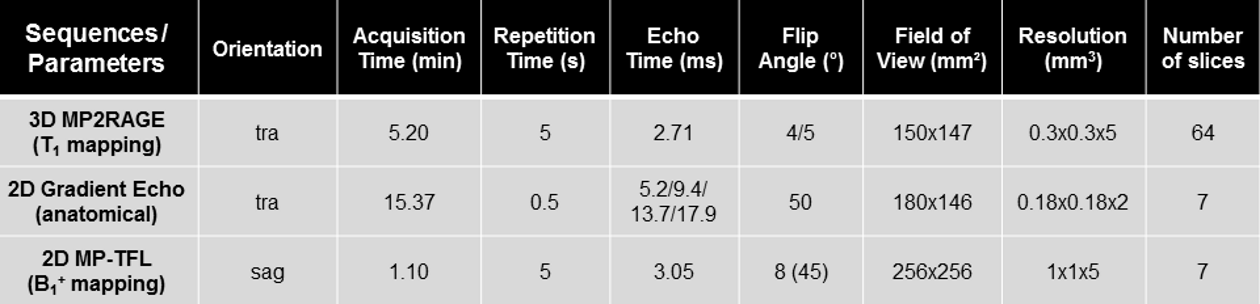
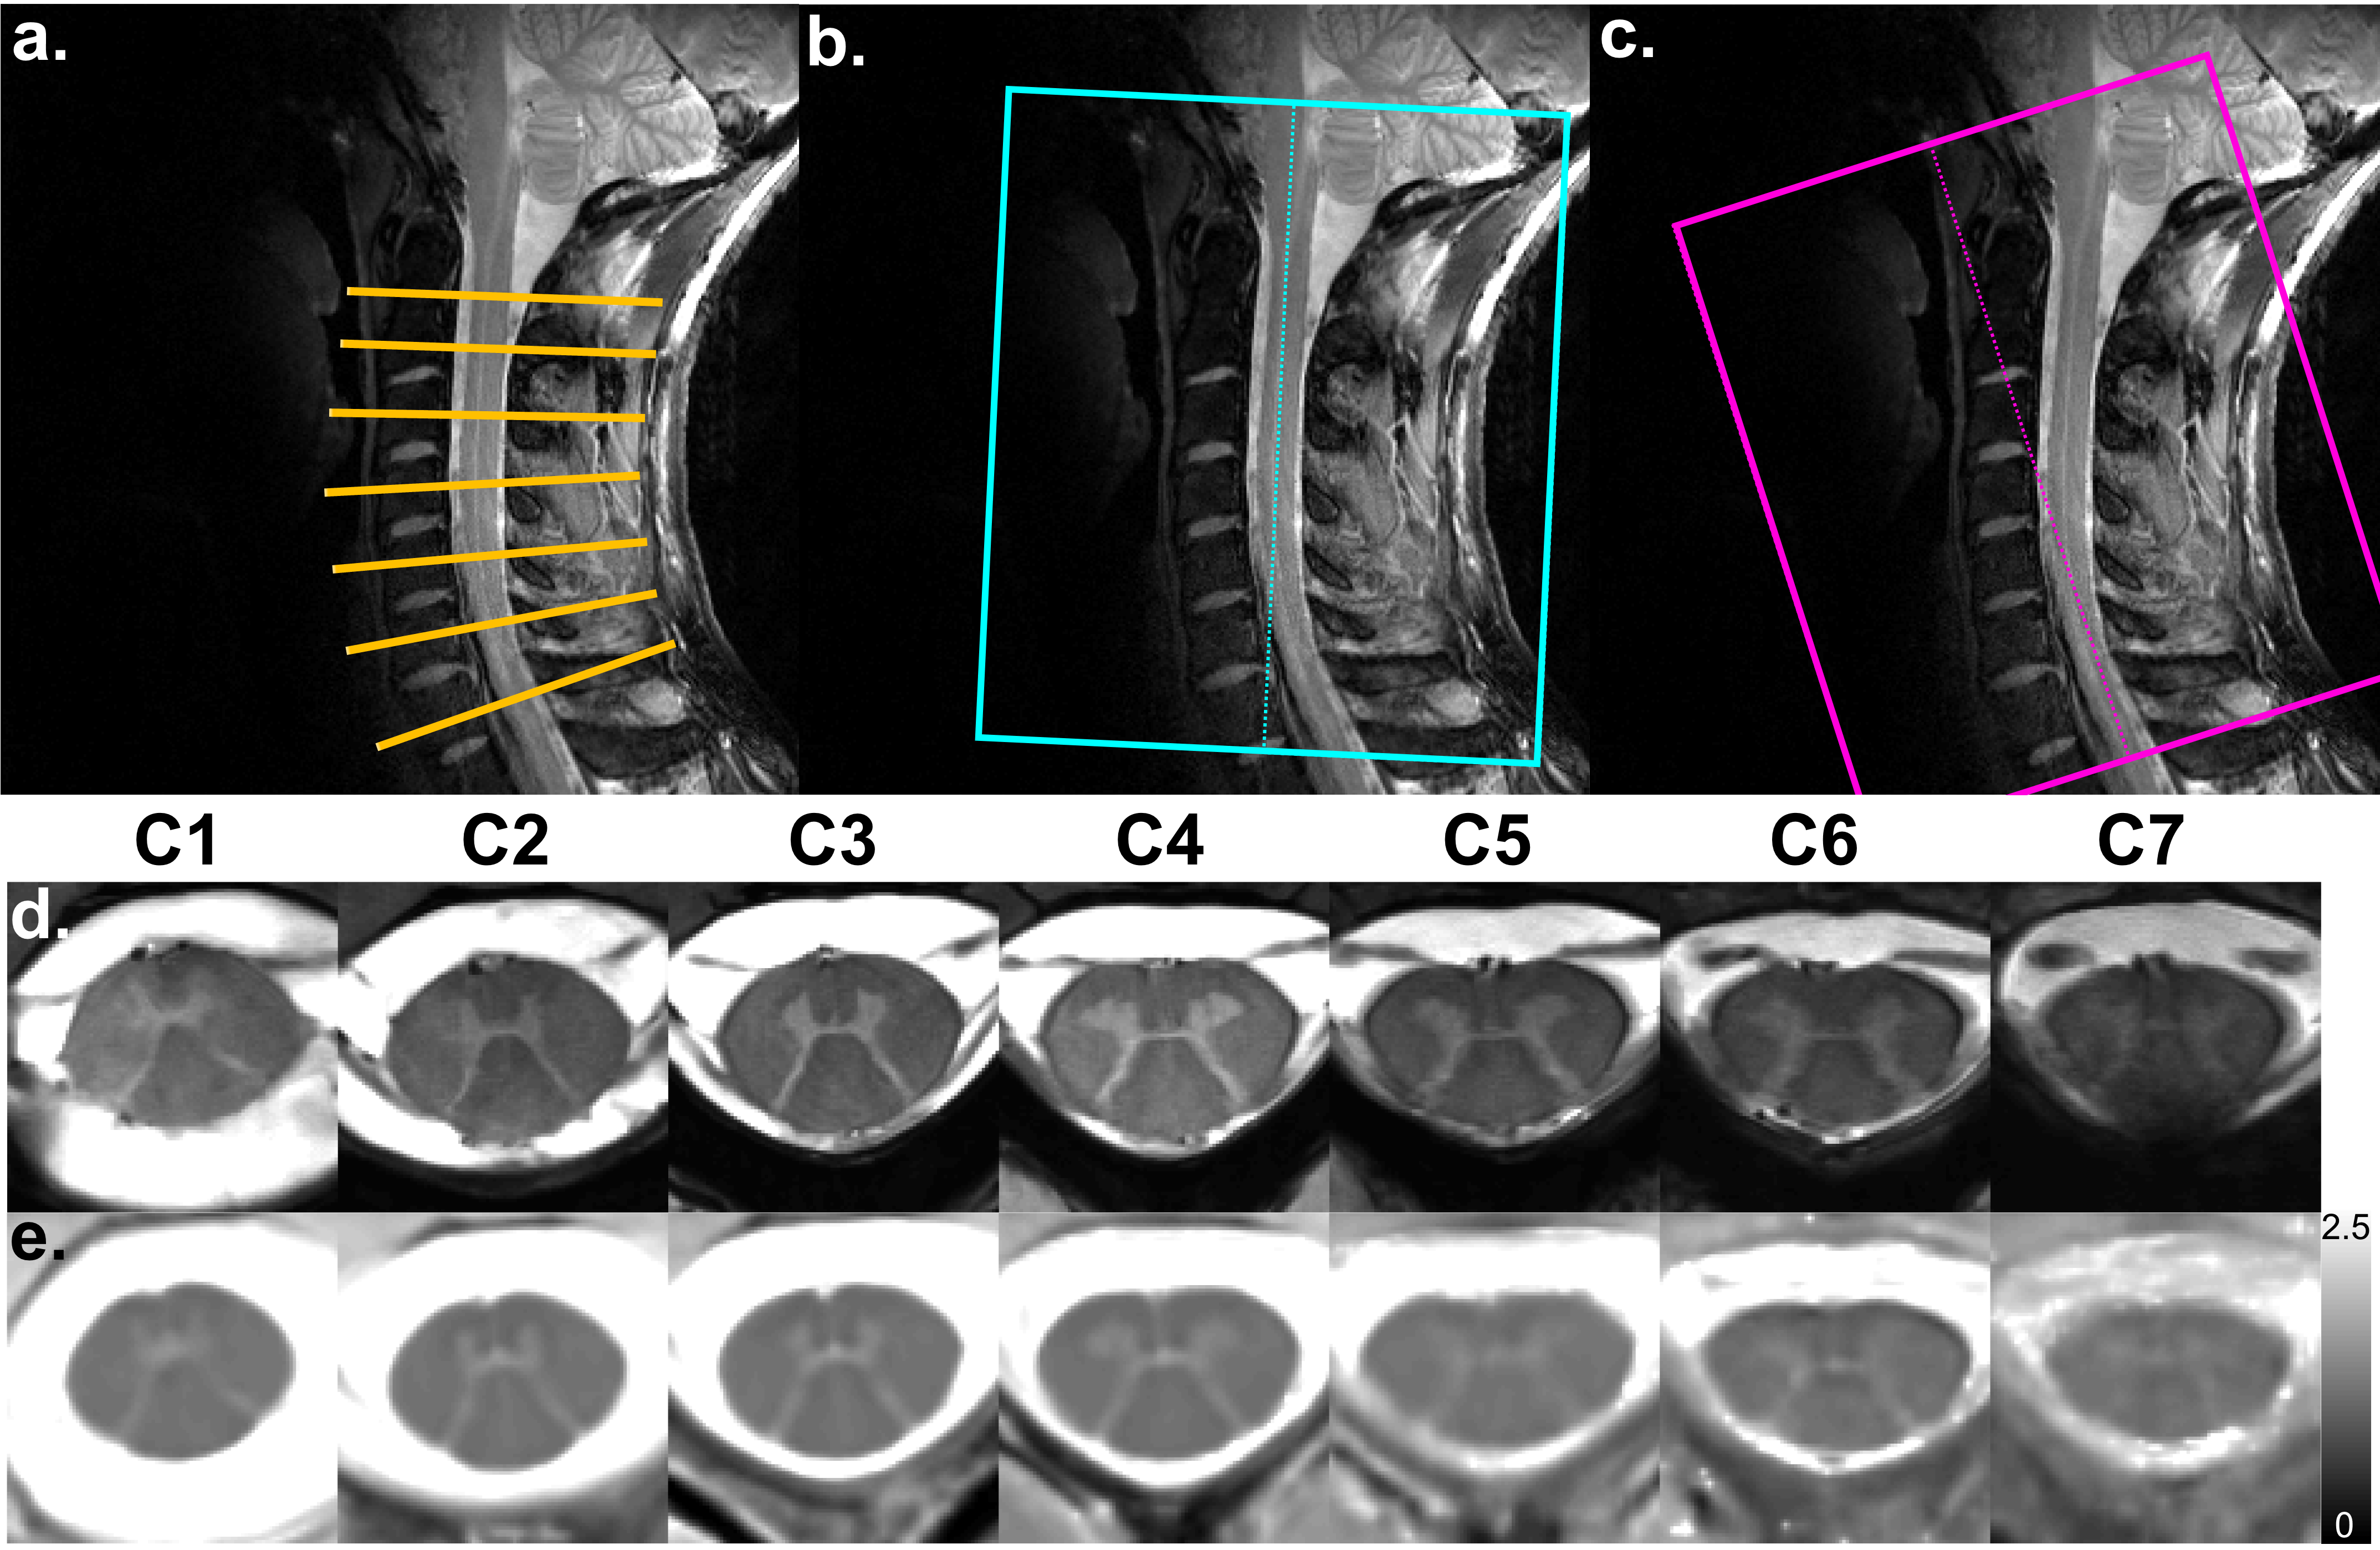
Experiments were performed on a whole-body 7T system (Siemens Healthcare) with an eight-channel transceiver cervical SC coil array (Rapid Biomedical), on ten healthy volunteers (29±13 years old [range 18-58]). T1 mapping was performed with one or two 3D-MP2RAGE acquisitions, depending on the subject’s SC curvature. Ultra-high-resolution 2D anatomical imaging using a multi-echo GRE was used to reslice 3D T1 volumes at each vertebral level (mid-vertebra slices) using c3D (ITK-Snap). To compensate for imperfect radiofrequency excitation biasing the T1 estimation, an offline correction for B1+-inhomogeneity4 was added using a B1+ map acquired with a magnetization-prepared turbo-FLASH sequence5. Acquisition parameters of all sequences are provided in Figure_1.
Image post-processing was done using MATLAB (Mathworks) and FSL (FMRIB). T1 maps were denoised using BM4D6. For each subject, the SC was semi-automatically segmented using PropSeg7. Images were then registered (affine (FLIRT) and non-linear (ANTs SyN8) registrations) to the oversampled AMU40 T2*-weighted template9 as an initial target. The mean T1 map derived from the n=10 subjects averaging was then used as a target for subsequent iterative registrations (n=3) of all the individual T1 data, in order to generate a sharper quantitative T1 template.
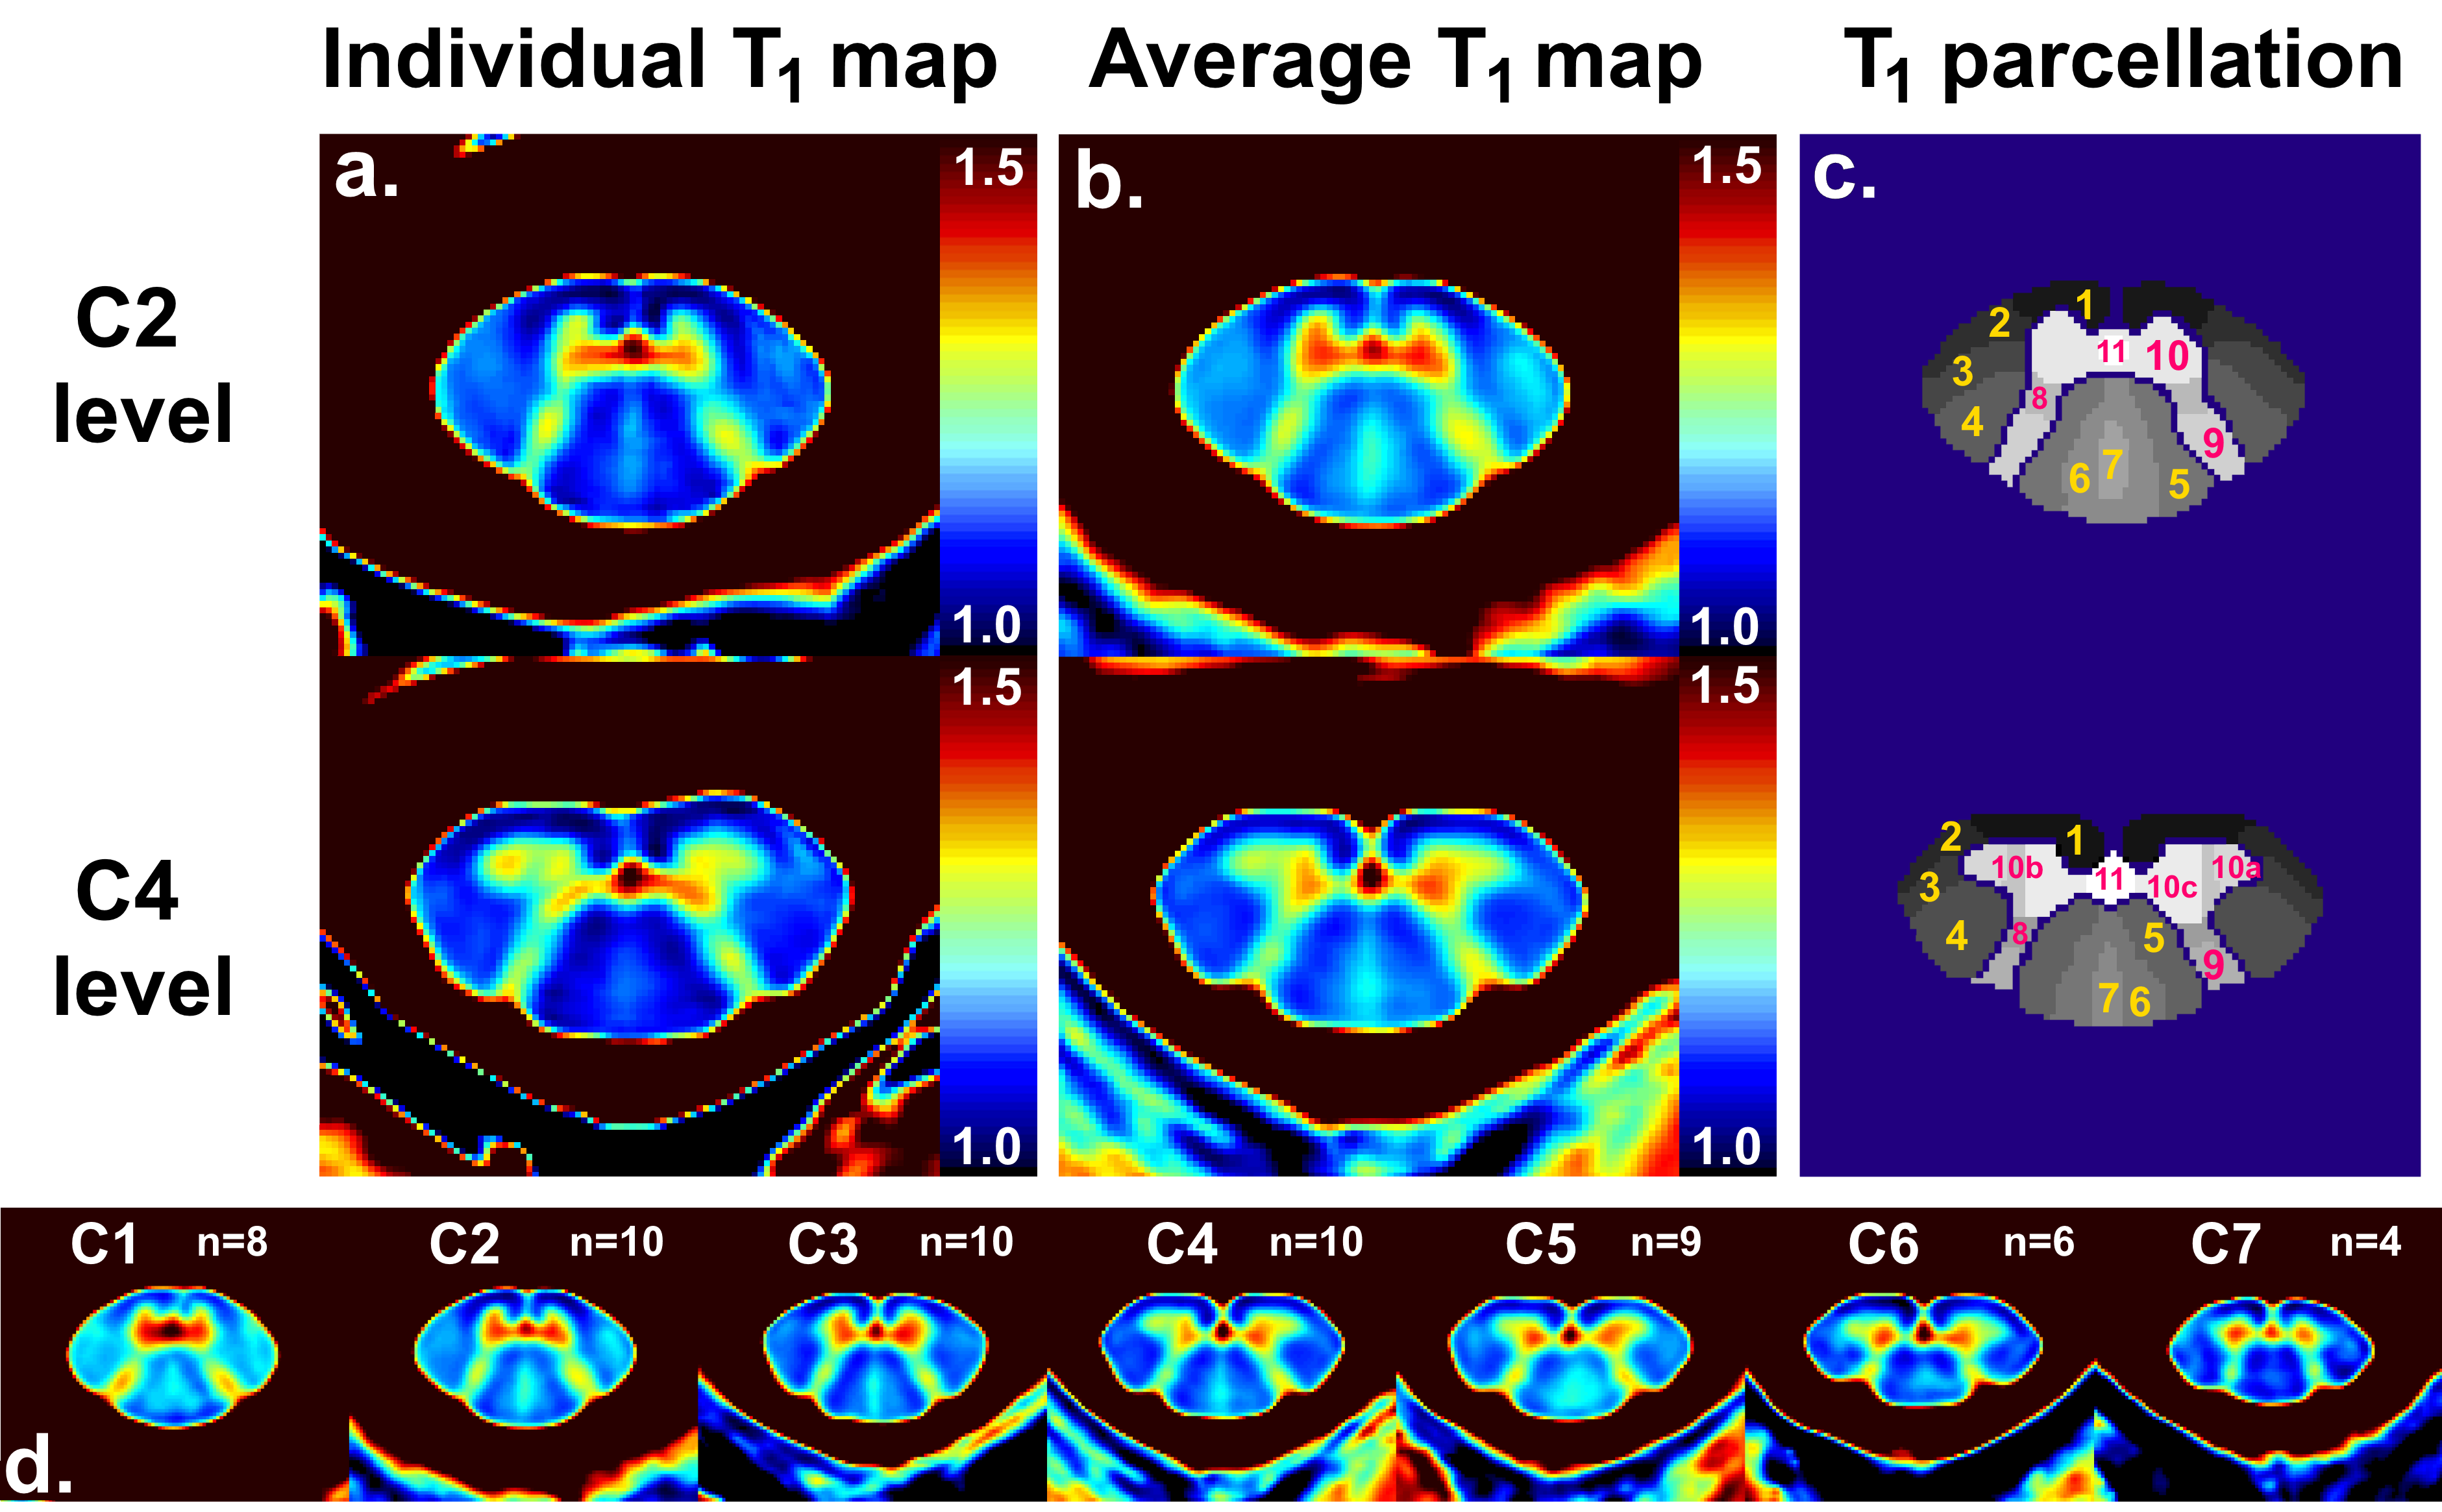
As a preliminary step to define WM/GM substructures based on in vivo data, parcellation within ventral/lateral/dorsal WM fasciculi, anterior/posterior GM horns and central canal was performed manually based on prior histological knowledge10 and adjusted using T1 thresholding. T1 values within each defined region of interest (ROI) were then evaluated and statistical analyses were performed using multiple comparison Wilcoxon non-parametric tests on JMP9 (SAS).
Results
Examples of individual axial T1 maps extracted from two MP2RAGE volumes aligned to the upper/lower cervical segments respectively are shown in subject space (Figure_2). Small structures such as the GM posterior horns, posterior septum and central canal could easily be delineated.
Figure_3 exhibits individual T1 maps within the AMU40 template space, mean resulting T1 template and SC parcellation. Anatomical details and specific T1 areas visualized on individual map could still be identified on the averaged maps.
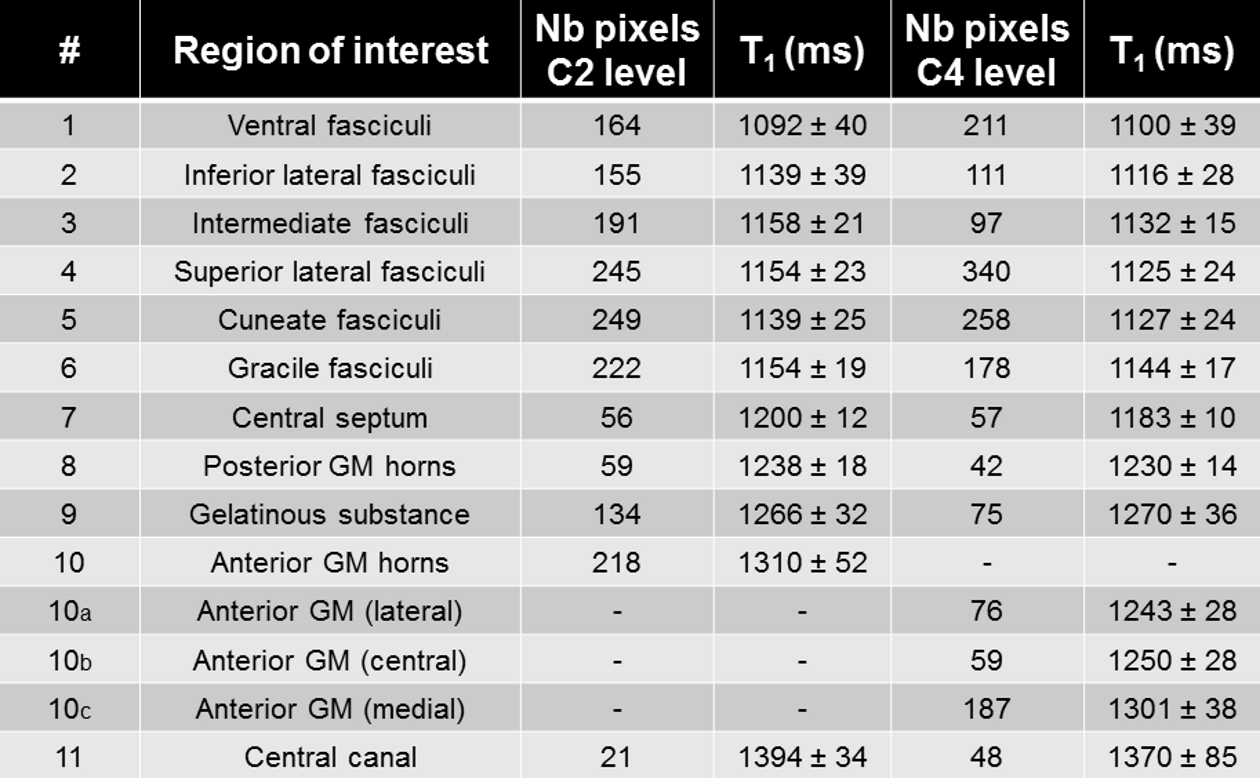
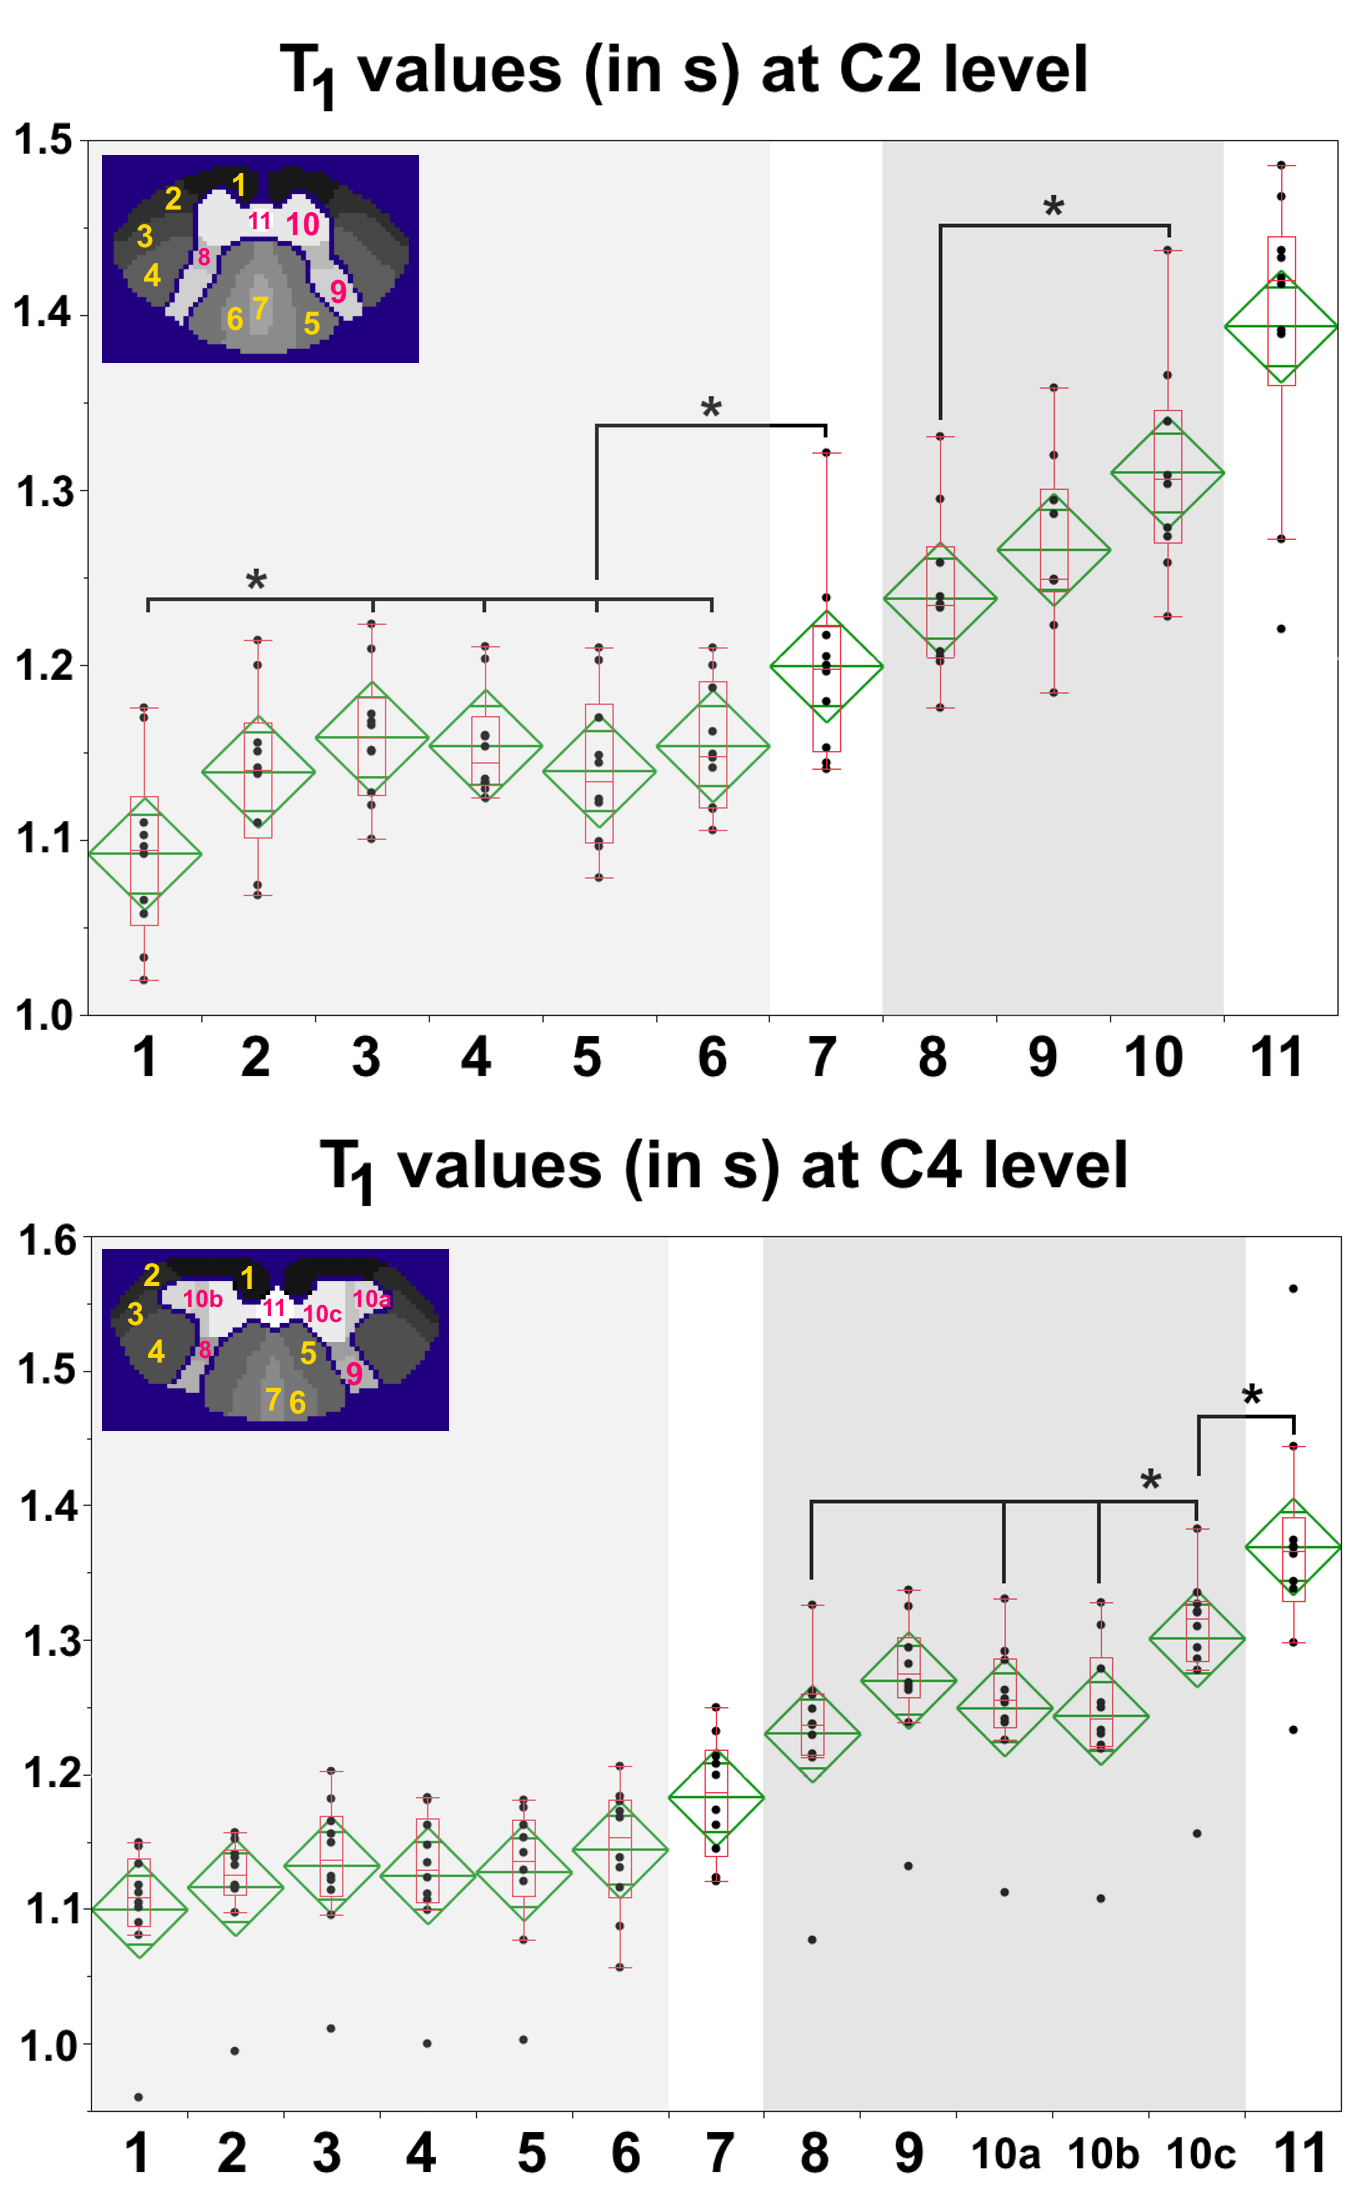
For clarity sakes, only C2 and C4 quantitative results are reported. Mean and in-ROI standard deviation of T1 values measured within the averaged T1 map are reported for all considered ROIs in Figure_4. In addition, individual T1 values and statistical results are shown in Figure_5. T1 values were found significantly different for several ROIs (e.g. C2 ventral fasciculi and C4 medial GM horns different from their surroundings).
Discussion
The T1 maps obtained in this work had unprecedented very high in-plane resolution, enabling exquisite anatomical details visualization and confident estimation of some so-far invisible SC-substructure mean T1 values. T1 quantification exhibited significant differences between several ROIs, which will likely be of great interest for further studies on SC pathologies. In-ROI and inter-subjects standard deviations were around 5% of the mean value.
Current limitations of this study include: 1/ vertebral levels instead of cervical levels11, which should be taken into account to strengthen the SC structural subdivision, 2/ ROI delineation, which should be improved using objective methods such as clustering algorithms12 and 3/ SC curvature, which should be positioned upright as much as possible since two non-isotropic MP2RAGE acquisitions were not always sufficient to adequately sample all vertebral levels with minimal PVE in the axial plane (9 slices over 70 discarded due to through-slice PVE contamination only).
Conclusion
Overall, this study opens new frontiers for an unprecedented in vivo characterization of the healthy and pathological SC substructures. These T1 results, combined to additional contrasts (T2* mapping and diffusion tensor imaging) will very likely provide accurate SC cyto/myelo-architecture atlases from C1 to C7 when used with clustering methods13. Additional work will be endeavored to exploit the whole 3D T1 volumes to study the evolution along the cord of each individual substructure shape and mean T1.Acknowledgements
The authors would like to thank Véronique Gimenez and Lauriane Pini for the study logistics. This work was supported by the following funding sources: Investissements d’Avenir 7T-AMI-ANR-11-EQPX-0001, A*MIDEX-EI-13-07-130115-08.38-7T-AMISTART, A*MIDEXANR-11-IDEX-0001-02, Aix-Marseille Université, AP-HM, ARSEP and CNRS (Centre National de la Recherche Scientifique).References
[1] Marques et al., NeuroImage 49, 2010. [2] Marques and Gruetter, PLoS One 8, 2013. [3] Rasoanandrianina et al., ISMRM 2017, p 912. [4] Massire et al., NeuroImage 143, 2016. [5] Fautz et al., ISMRM 2008, p 1247. [6] Maggioni et al., IEEE Trans Image Process 22, 2013. [7] De Leener et al., NeuroImage 98, 2014. [8] Avants et al., Medical Image Analysis 12, 2008. [9] Taso et al., NeuroImage 117, 2015. [10] Development of the human spinal cord, J Altman & SA Bayer, Oxford university press, 2001, p9, 46, 72. [11] Cadotte et al., AJNR 36, 2015. [12] Jain et al., Data Clustering: A Review. ACM Comput Surv 31, 1999. [13] Taso et al., ISMRM 2017, p 18. [14] Held et al., Journal of Neuroradiology 30, 2003.Figures