0667
The Role of Partial Volume Modelling in Longitudinal Automated Multiple Sclerosis Lesion Segmentation1Advanced Clinical Imaging Technology, Siemens Healthcare AG, Lausanne, Switzerland, 2Department of Radiology, Centre Hospitalier Universitaire Vaudois (CHUV) and University of Lausanne (UNIL), Lausanne, Switzerland, 3Signal Processing Laboratory (LTS 5), École Polytechnique Fédérale de Lausanne (EPFL), Lausanne, Switzerland, 4Martinos Center for Biomedical Imaging, Massachusetts General Hospital and Harvard Medical School, Boston, MA, United States, 5Neuroimmunology Unit, Neurology, Department of Clinical Neurosciences, Centre Hospitalier Universitaire Vaudois (CHUV) and University of Lausanne (UNIL), Lausanne, Switzerland, 6Neurology Department and Neuroimaging Laboratory, Basel University Hospital, Basel, Switzerland, 7Medical Image Analysis Laboratory (MIAL), Centre d'Imagerie BioMédicale (CIBM), Lausanne, Switzerland
Synopsis
Longitudinal analyses in Multiple Sclerosis are often performed to assess disease progression and evaluate treatment response. The number of new and enlarged lesions as well as total lesion volume variations over time are imaging biomarkers used in MS follow-up assessment. Here, we evaluate the performance of an in-house prototype algorithm for lesion detection and volume estimation in a longitudinal scenario. Our algorithm can be run with or without partial volume modelling. Both detection and volume estimation improved using the partial volume model with respect to manual delineations, especially in small lesions and at lesion borders.
Introduction
Estimating the number or volume of new and enlarged lesions and evaluating the total lesion volume (TLV) difference between MRI scans are of key importance for follow-up of multiple sclerosis (MS) patients1. Several segmentation methods are proposed in the literature to perform longitudinal analyses of MS lesions automatically2. However, none of the methods exploit the contribution of partial volume (PV), which previously showed to improve lesion segmentation in a cross-sectional scenario3. Here, we test the hypothesis that PV also helps to improve longitudinal analyses, following the rationale that new lesions are typically small and hence prone to PV. Moreover, precise delineation of lesion boundaries – which are by definition susceptible to PV – is essential for evaluating the activity of a lesion, i.e. whether it enlarged, shrunk or stayed stable. In this work, we compare the performance of a prototype for longitudinal automated evaluation in two different scenarios: S(1) without considering the PV effects (LeMan)4, and S(2) when lesion voxels affected by PV are taken into account (LeMan-PV)3.Material and Methods
3T MR images were acquired on a MAGNETOM Trio a Tim system (Siemens Healthcare, Erlangen, Germany) using a 32-channel head coil. Thirty-two patients with relapsing-remitting MS and disease duration < 5 years from diagnosis were enrolled in the study, and two MRI scenarios were performed at enrolment (TP1) and at two years (21.4 ± 2.5 months, range 16-27 months) follow-up (TP2). The patient cohort consisted of 13 males and 19 females, age range 20-60 years at TP1, with a median Expand Disability Status Scale (EDSS) of 1.5 at both time points (i.e. early disease stage). The MRI protocol included: Magnetization-Prepared Rapid Acquisition Gradient Echo (MPRAGE, TR/TI=2300/900ms, voxel size=1.0x1.0x1.2mm3) and 3D FLuid-Attenuated Inversion Recovery (FLAIR-SPACE, TR/TE/TI=5000/394/1800, voxel size=1.0x1.0x1.2mm3). At both time points, the algorithm was performed S(1) with and S(2) without modelling the PV [3]. Manual segmentations of MS lesions (from a neurologist and a radiologist) were conducted at both time points and used as a ground truth (GT) reference. MS lesions were classified according to the criteria defined in Moraal et al.5 as
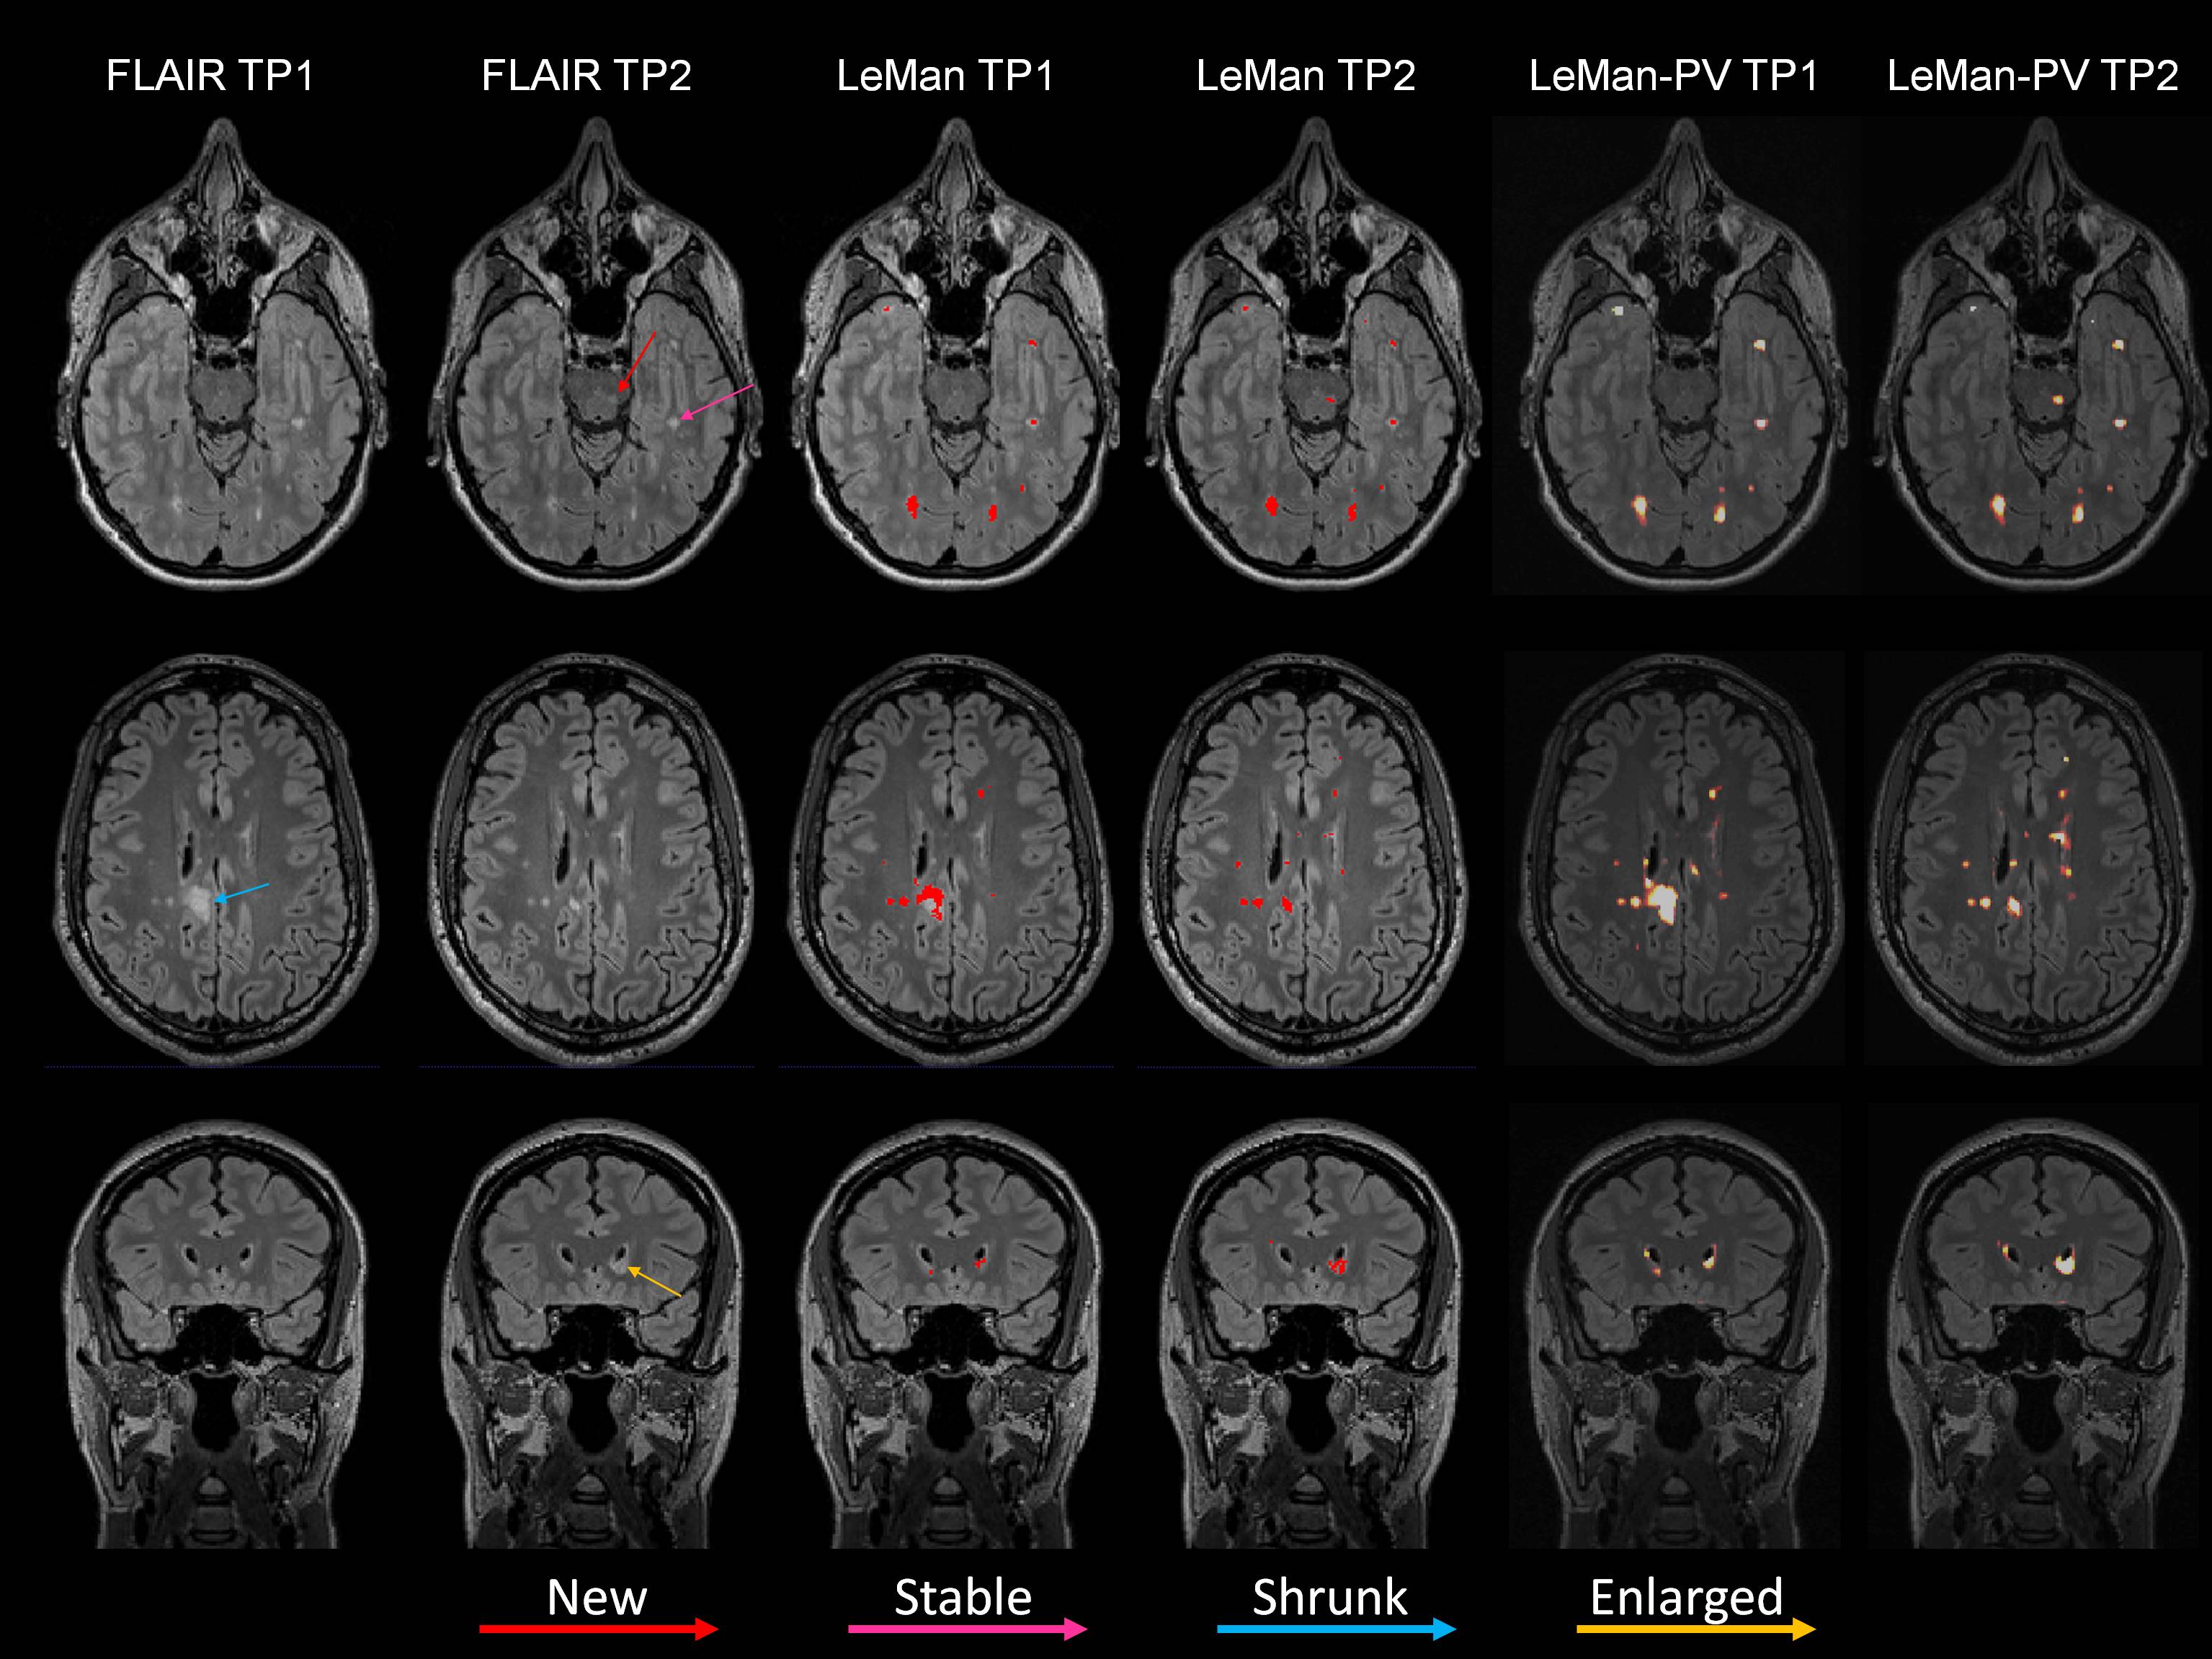
- i) new (identifiable on TP2 but not on the TP1),
- ii) enlarged (increase in diameter by at least 50% in TP2 with respect to TP1),
- iii) shrunken (decrease in diameter by at least 50% in TP2 with respect to TP1),
- iv) stable (lesion diameter difference between TP1 are TP2 where within the range of -50% to 50%).
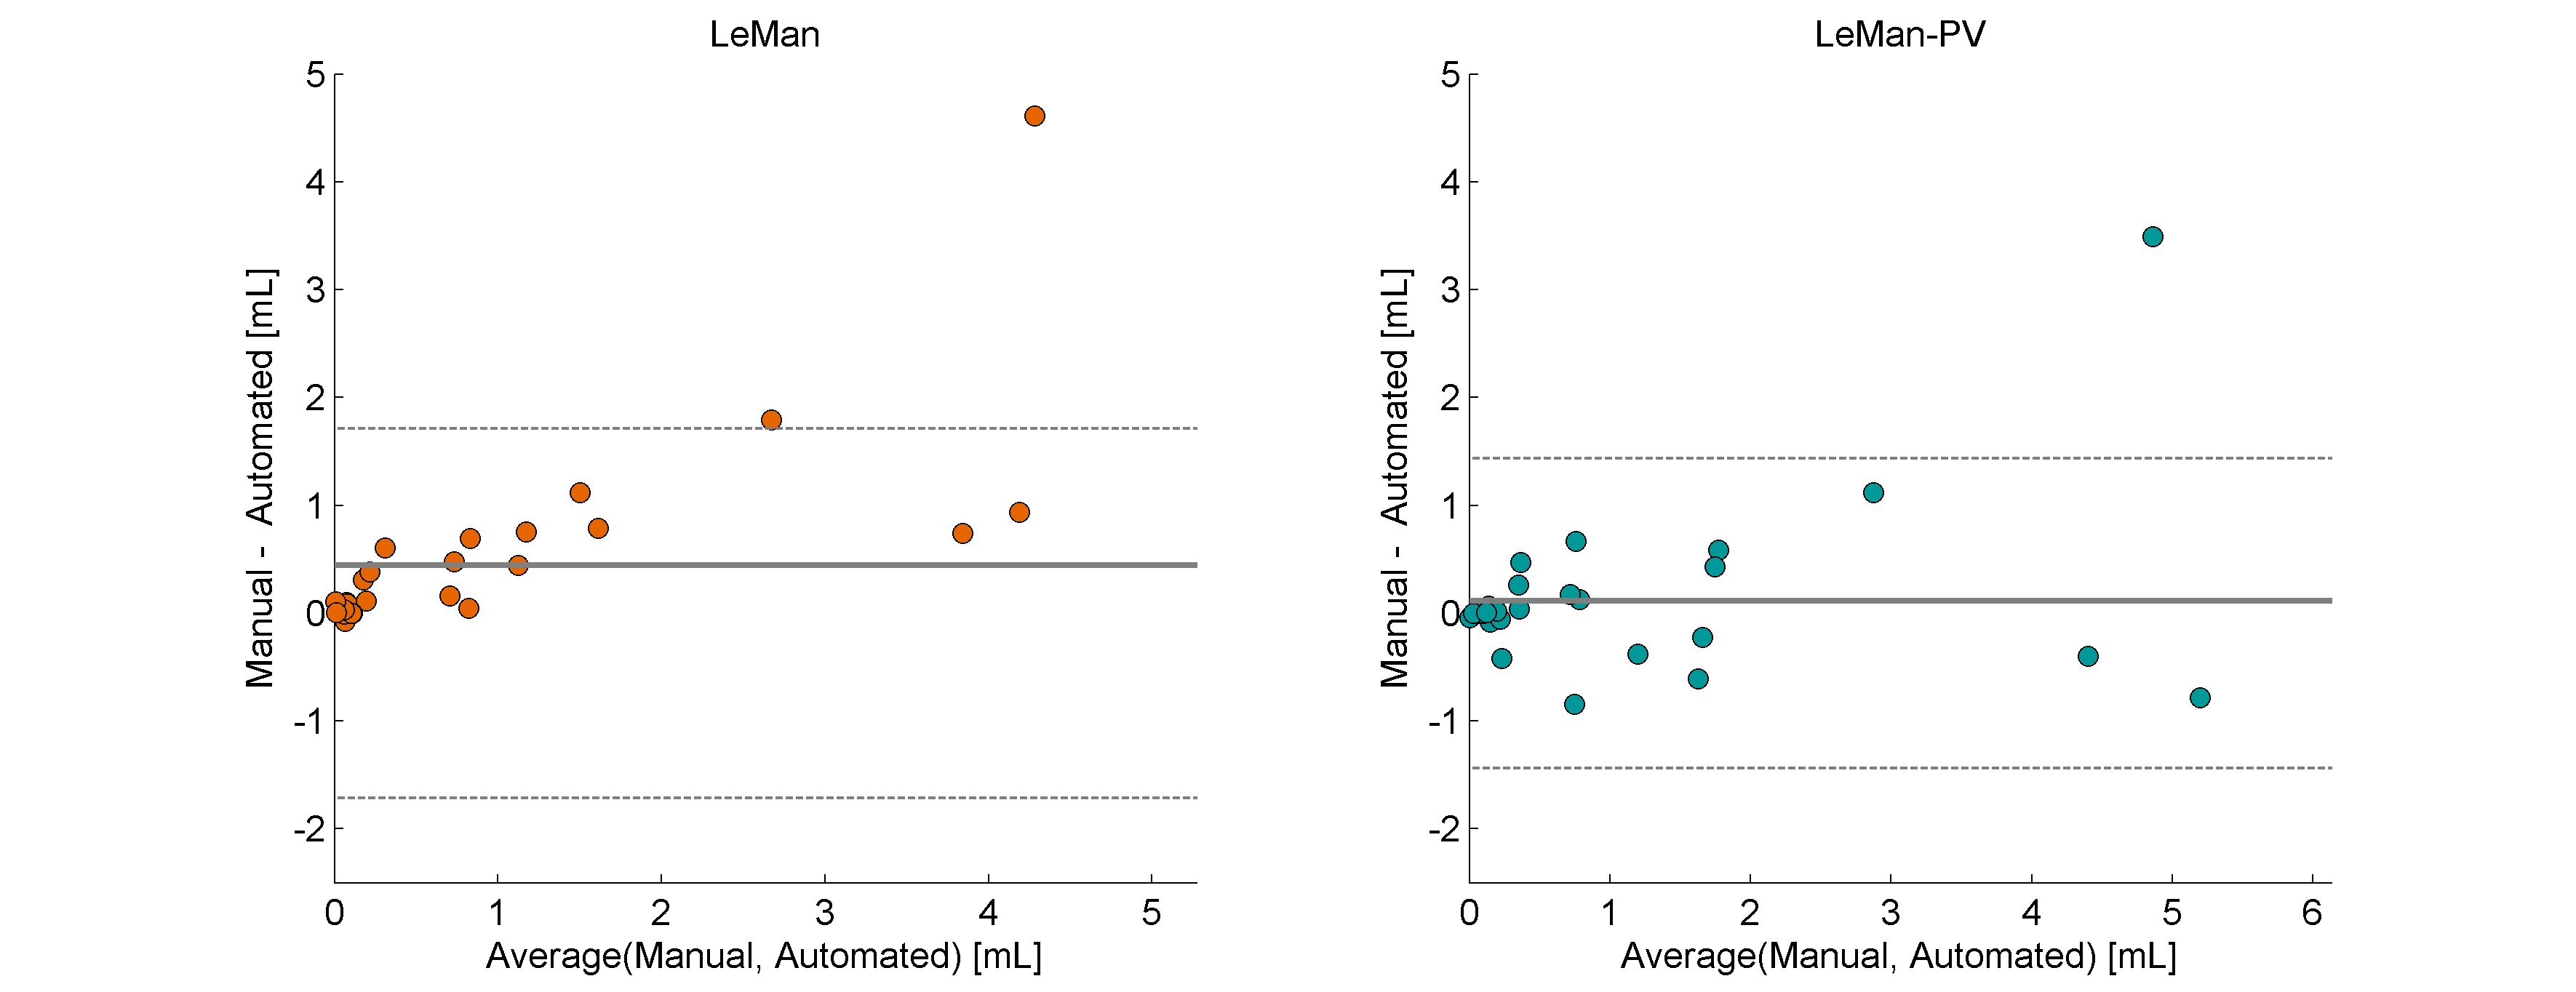
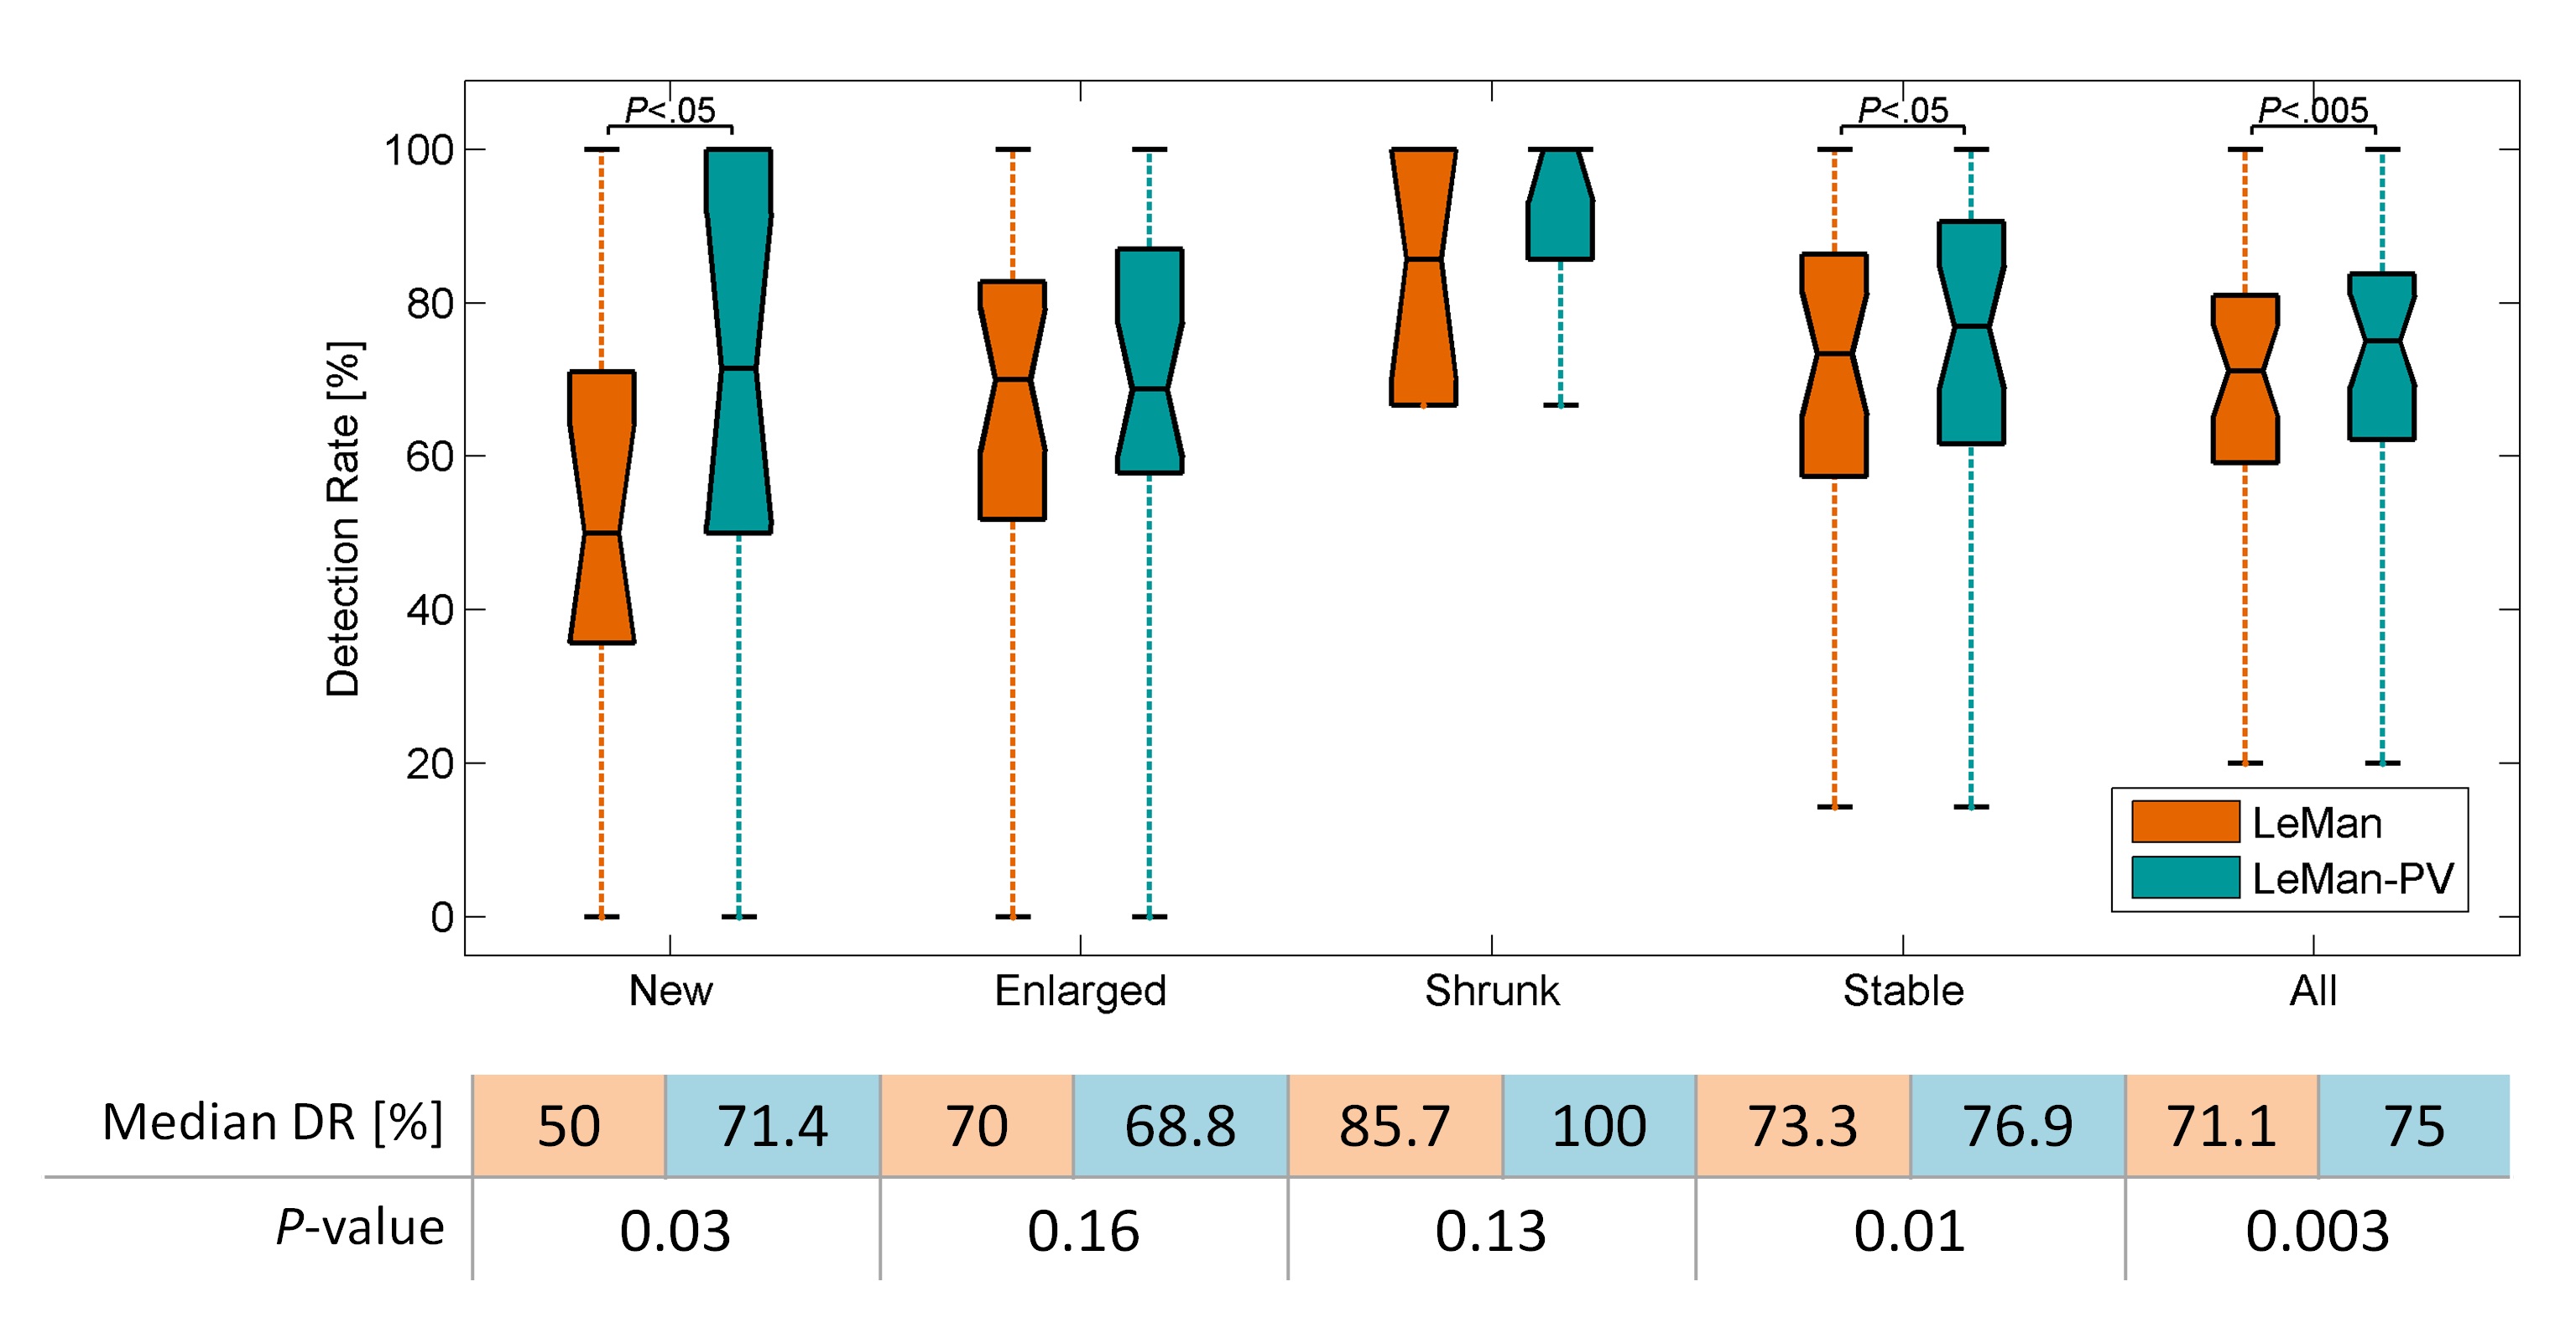
Both scenarios S(1) and S(2) were evaluated against the GT using the following metrics: Spearman correlations, mean absolute error (MAE) of TLV difference (ΔTLV) between TP1 and TP2; volume of new lesional tissue from new and enlarged lesions through a Bland-Altman plot; detection rate (DR, number of detected lesions/total ground truth lesions) per brain for the different types of lesions (i-iv). The performance was statistically compared between scenarios S(1) and S(2) using the Wilcoxon signed-rank test.
Results
Figure 1 illustrates the different outputs from the algorithms LeMan and LeMan-PV in three exemplary slices at both time points. Improvements in delineation of new, enlarged, shrunken and stable can be observed (arrows). ΔTLV appeared to be not significantly different with respect to the GT only when LeMan-PV is used. Also, Spearman correlation (ρS(2)=0.63, ρS(1)=0.61) and MAE (MAES(2)=0.94, MAES(1)=0.98) were improved with LeMan-PV. The Bland-Altman plot indicates a higher agreement between manual and automated segmentations of new lesional tissue for LeMan-PV (Figure 2). Lastly, median DR improved significantly (P<0.005) when PV was modelled, mainly due to the higher detection rate for new (P<0.05) and stable (P<0.05) lesions (Figure 3).Discussion and Conclusion
Our results show that the inclusion of PV has an impact on automated longitudinal lesion assessment. Voxels affected by PV not only have a significant contribution to the detection of small new lesions but also to lesion volume estimation due to the improvements in lesion delineation (mainly lesion boundaries affected by PV). One limitation of this study is the small number of new lesions: in our cohort of 32 MS patients, 15 exhibited new lesions, resulting in a total of 45 new lesions. A cohort of patients showing a higher number of small new lesions and enlarged lesions would be desirable to reinforce our conclusions on modelling PV in a longitudinal scenario.Acknowledgements
No acknowledgement found.References
1. Filippi M, Rocca MA, Ciccarelli O, De Stefano N, Evangelou N, Kappos L, et al. MRI criteria for the diagnosis of multiple sclerosis: MAGNIMS consensus guidelines. The Lancet Neurology. 2016;15(3):292-303.
2. Lladó X, Ganiler O, Oliver A, Martí R, Freixenet J, Valls L, et al. Automated detection of multiple sclerosis lesions in serial brain MRI. Neuroradiology. 2012;54(8):787-807.
3. Fartaria MJ, Roche A, Meuli R, Granziera C, Kober T, Bach Cuadra M. Segmentation of Cortical and Subcortical Multiple Sclerosis Lesions Based on Constrained Partial Volume Modeling. In: Descoteaux M, Maier-Hein L, Franz A, Jannin P, Collins DL, Duchesne S, editors. Medical Image Computing and Computer-Assisted Intervention − MICCAI 2017: 20th International Conference, Quebec City, QC, Canada, September 11-13, 2017, Proceedings, Part III. Cham: Springer International Publishing; 2017. p. 142-9.
4. Fartaria MJ, Bonnier G, Roche A, Kober T, Meuli R, Rotzinger D, et al. Automated detection of white matter and cortical lesions in early stages of multiple sclerosis. Journal of Magnetic Resonance Imaging. 2016;43(6):1445-54.
5. Moraal B, Wattjes MP, Geurts JJ, Knol DL, van Schijndel RA, Pouwels PJ, et al. Improved Detection of Active Multiple Sclerosis Lesions: 3D Subtraction Imaging 1. Radiology. 2010.
Figures