0663
Automatic Segmentation of 3D Perivascular Spaces in 7T MR Images Using Multi-Channel Fully Convolutional Network1Department of Radiology and BRIC, University of North Carolina at Chapel Hill, Chapel Hill, NC, United States
Synopsis
Advanced 7T MR imaging improves the visualization of perivascular spaces (PVSs) in human brains. However, accurate PVS segmentation for quantitative morphological studies is still challenging, since PVSs are very thin tubular structures with low contrast in noisy MR images. We proposed a new multi-channel fully convolutional network (mFCN) to automatically segment 3D PVSs. Our mFCN method adopts multi-channel inputs to complementarily provide enhanced tubular structural information and detailed image information. Multi-scale image features are automatically learned to delineate PVSs, without requirement of any pre-defined regions of interest (ROIs). The proposed method outperforms existing automatic/semi-automatic methods with a large margin.
Introduction
Accurate segmentation of PVSs is critical for quantitative study of their morphological characteristics and analysis of their functional status. While 7T MR scanners facilitate PVS visualization, manual PVS delineation is still challenging and time-consuming. The main reason is that PVSs are very thin tubular structures with various directions and also with weak signals in noisy MR images. Several automatic/semi-automatic methods have been proposed for PVS segmentation, among which traditional-learning-based methods (e.g., random-forests-based methods) are competitive alternatives due to their consideration of contextual knowledge on spatial locations of PVSs. However, one major limitation of these methods is that their performance is largely determined by the quality of hand-crafted image features and pre-defined ROIs. In this study, for the first time, we propose a deep learning method for 3D PVS segmentation. Specifically, we develop a multi-channel FCN method (called mFCN) that adopts not only the original but also the filtered T2-weighted MR images as multi-channel inputs, where both image details and enhanced tubular structural information are used to localize PVSs. Task-oriented multi-scale features are automatically learned to differentiate PVSs from adjacent brain tissues. The automatic PVS segmentation can be performed on the whole image without requirement of any pre-defined ROIs.Methods
Seventeen healthy subjects aged from 25 to 37 were studied. The MR images were acquired using a 7T Siemens scanner equipped with a 32-channel receive head coil and a single-channel volume transmit coil. The T2-weighted MR images (3D variable flip angle turbo-spin echo sequence; resolution, 0.4 × 0.4 × 0.4 /0.5 × 0.5 × 0.5 mm3) were used for PVS segmentation, since PVSs have relatively higher contrast in T2-weighted images than in T1-weighted images.
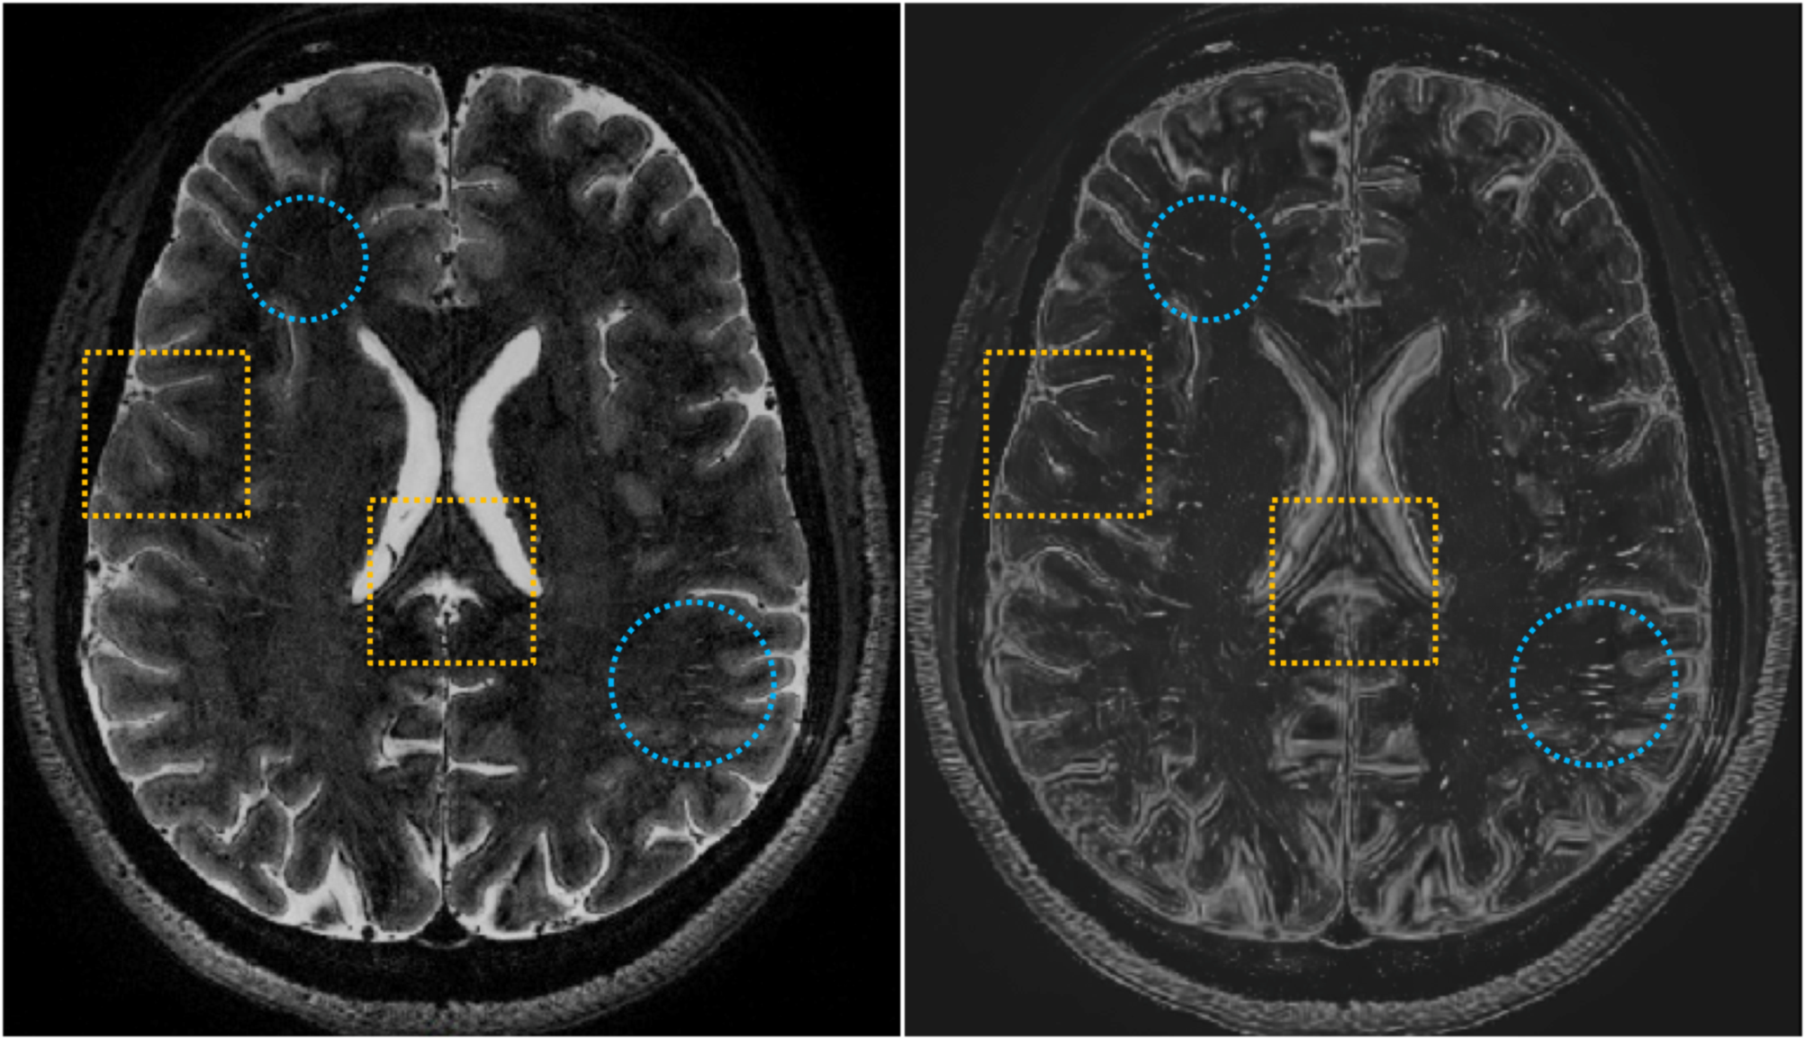
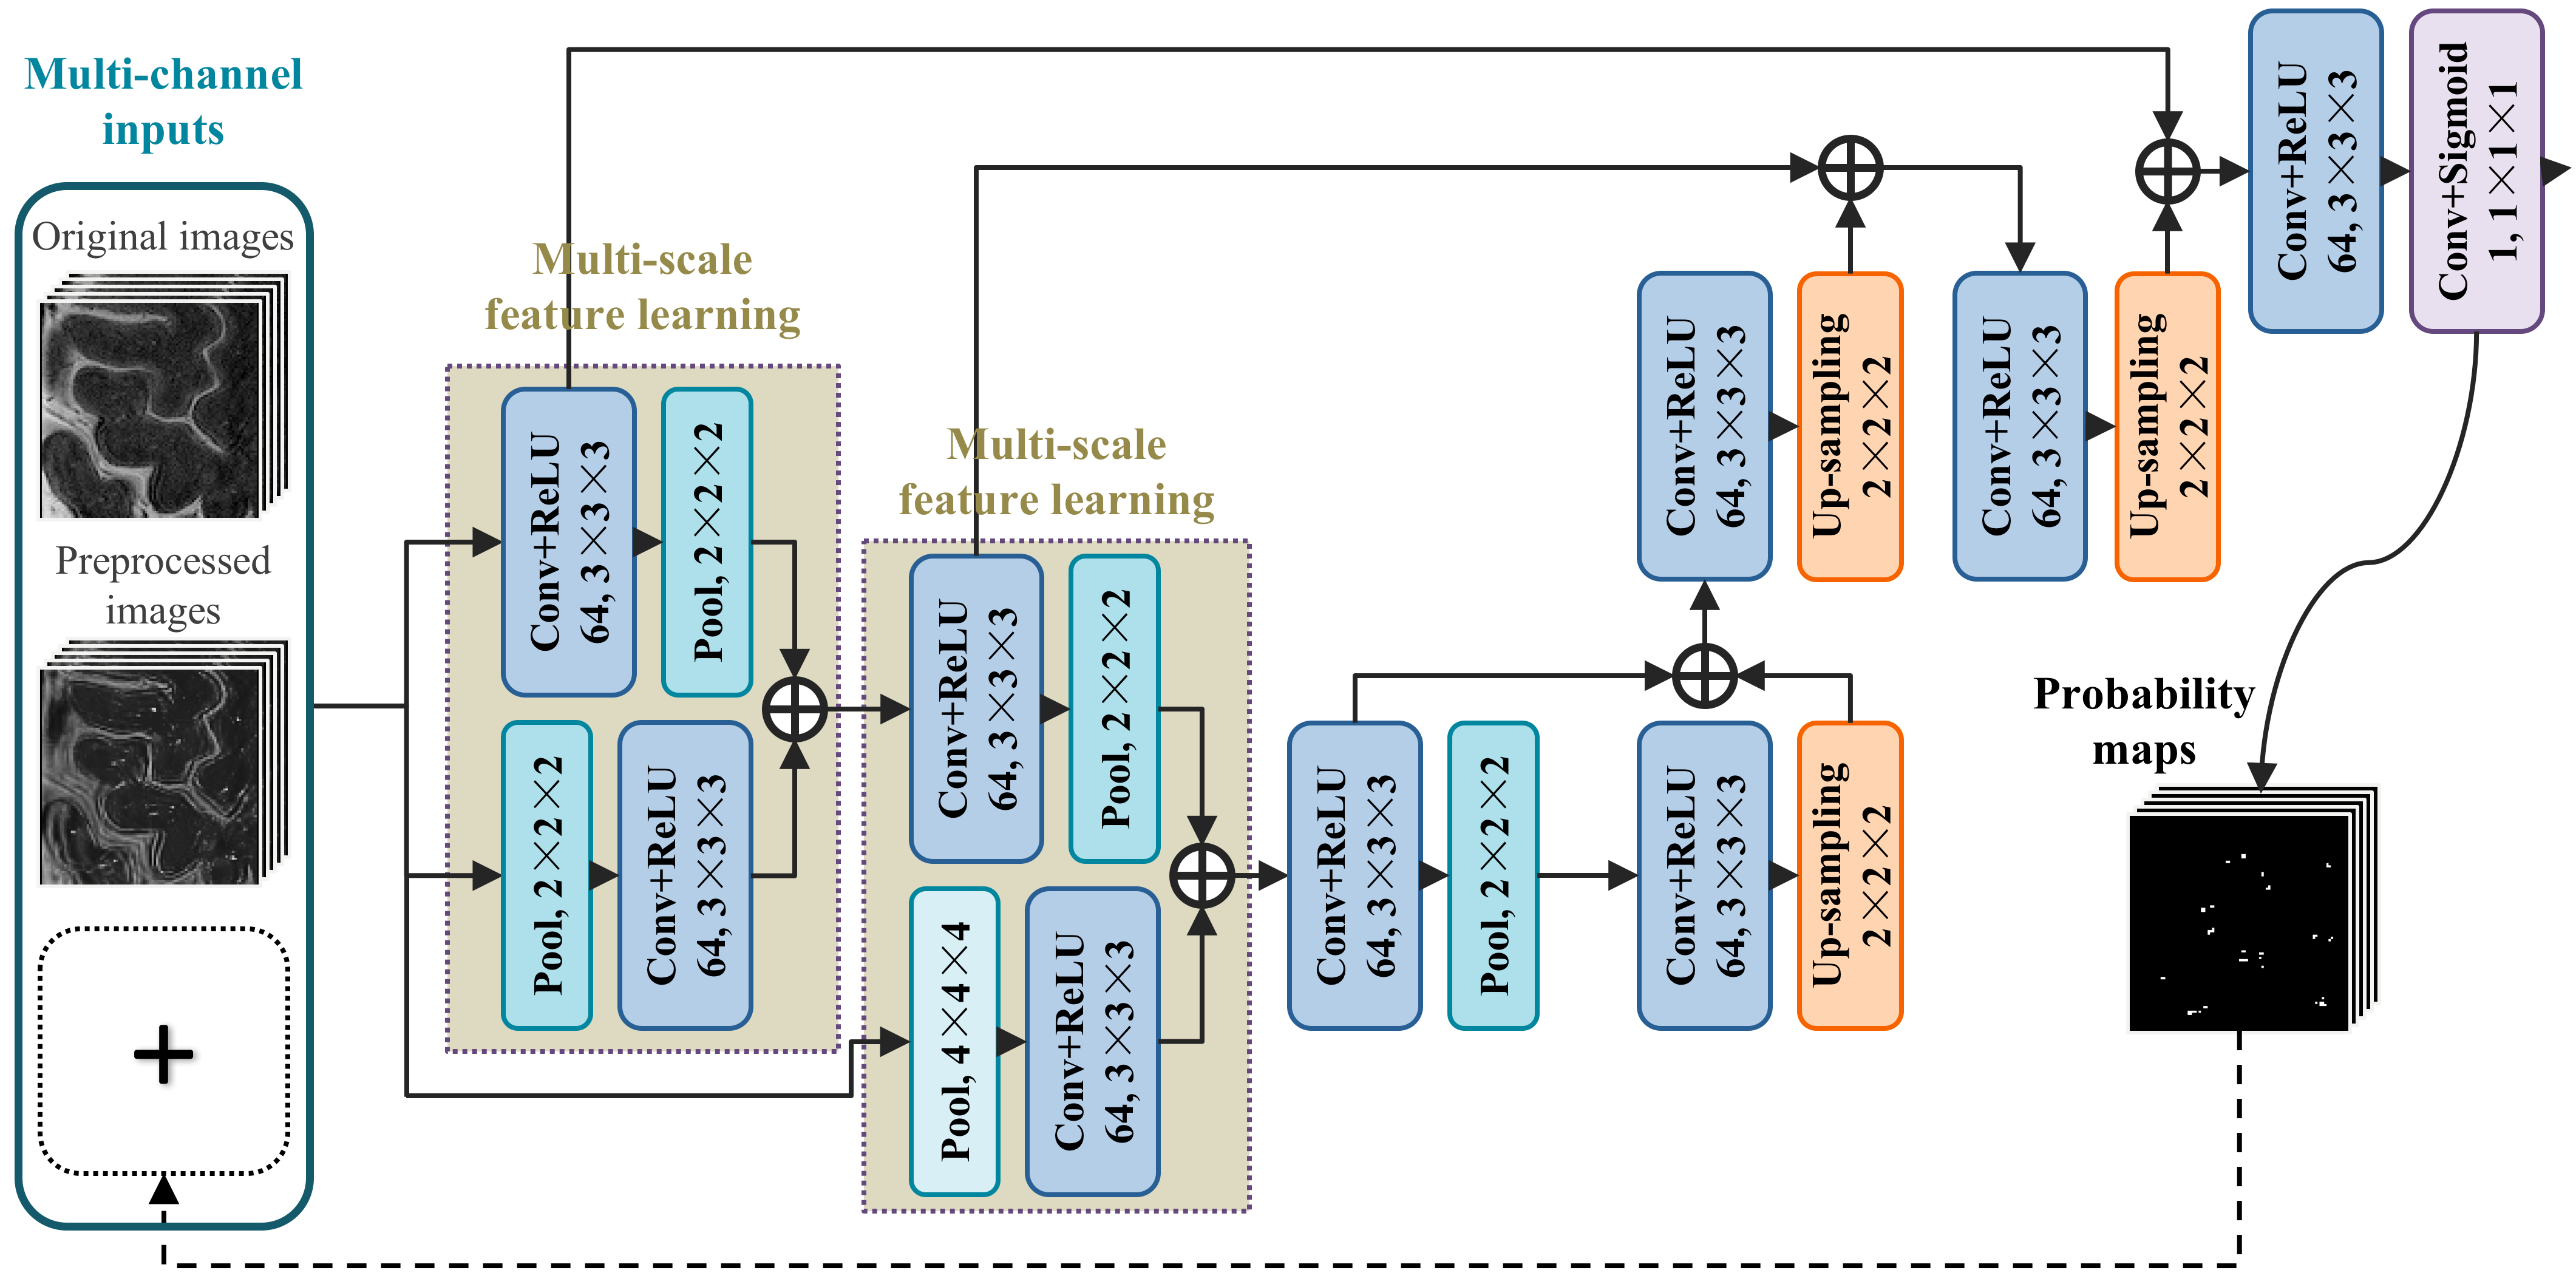
The proposed mFCN method consists of the following important components: First, a non-local filtering method with Haar-transform-based line singularity representation [1] was used to remove noise and enhance the thin tubular structures. An example of the original and filtered T2-weighted images is shown in Fig. 1. Compared with the original image, the filtered image presents enhanced tubular structures, but sacrifices some image details simultaneously. As two complementary information sources, the enhanced and original images were used as multi-channel inputs to train our network. Second, our mFCN improved the state-of-the-art U-Net architecture [2] by learning multi-scale image features at multiple resolution levels, to more comprehensively characterize the associations between PVSs and surrounding tissues. Third, inspired by the auto-context strategy [3], the PVS probability maps produced by our initial network were recursively used as high-level contextual information in an additional input channel to retrain our network for more accurate segmentation. Fourth, a specific data-rebalancing strategy and a cost-sensitive loss function were used to deal with the class-imbalance issue (i.e., background has much more voxels than PVSs). The architecture of the proposed mFCN is summarized in Fig. 2. It was trained on a GPU server using experts’ manual annotations as the ground truth.
Results
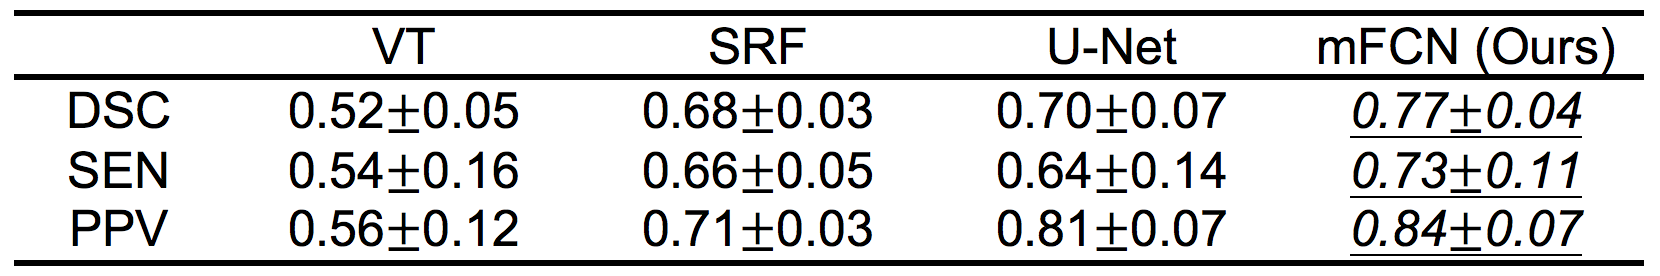
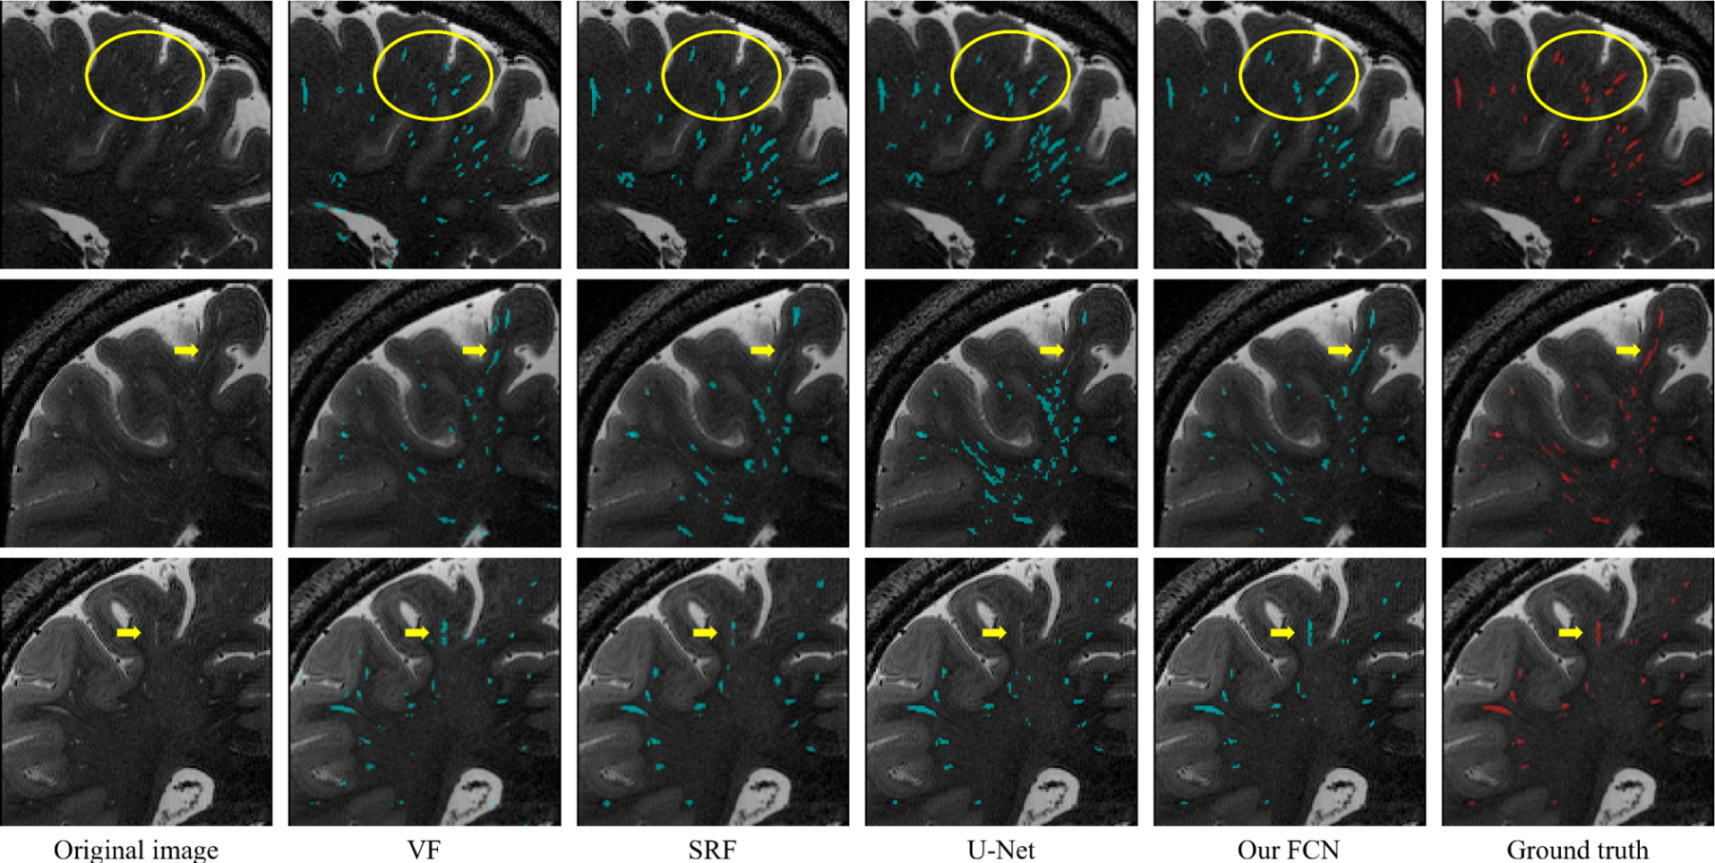
Regarding manual annotations as the reference, the automatic segmentation performance was quantified using three metrics, i.e., Dice similarity coefficient (DSC), sensitivity (SEN), and positive prediction value (PPV). The segmentation accuracy is proportional to the value of these metrics. The proposed method was first compared with a baseline thresholding method based on vesselness filtering (VF) [4], and also compared with two state-of-the-art methods, i.e., a traditional-learning-based method using structured random forest (SRF) [5] and a deep-learning-based method using the U-Net architecture [2].
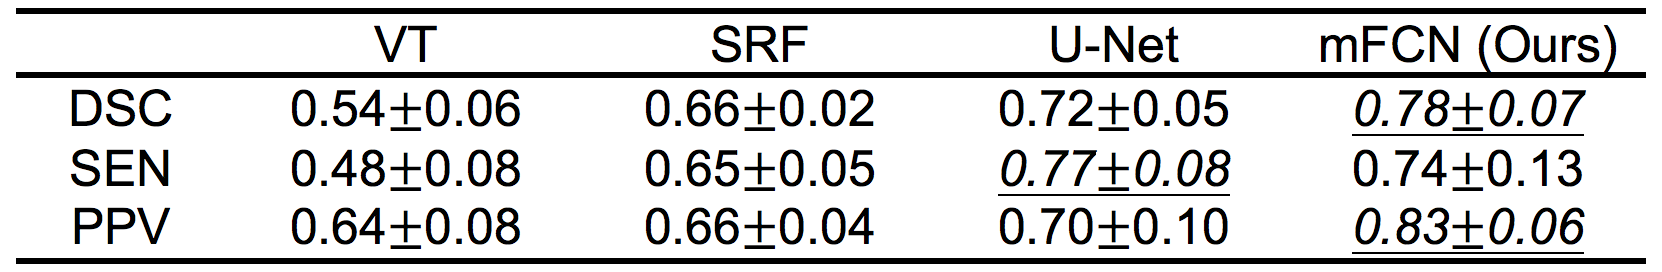
The quantitative segmentation results obtained by the competing methods are reported in Table 1 and Table 2. These two tables present, respectively, the average results (mean±standard deviation) for 6 training subjects and 11 testing subjects. Several features are observed in Tables 1 and 2. First, the two deep-learning-based methods (i.e., U-Net and mFCN) outperform traditional-learning-based method (i.e., SRF), implying that learning task-oriented features is beneficial for PVS segmentation. Second, our mFCN method achieves better performance than U-Net, mainly due to the use of multi-channel inputs and multi-scale feature learning. Third, mFCN generalizes well as it obtains overall comparable performance on training (Table 1) and testing (Table 2) data.
Correspondingly, a qualitative comparison is presented in Fig. 3, from which we can find that our automatic segmentation is more consistent with the manual ground truth, especially for the weak PVSs indicated by yellow circles and arrows.
Conclusion
We have proposed a new multi-scale FCN (mFCN) method to automatically delineate PVSs in 7T MR images. Our method achieves PVS segmentation without the need of any specified ROIs. Thanks to multi-channel inputs and multi-scale feature learning, mFCN has shown superior performance to the state-of-the-art approaches in PVS segmentation.Acknowledgements
This work was partly supported by NIH grants (EB006733, EB008374, EB009634, MH100217, AG041721, AG042599, AG010129, AG030514).References
- Hou Y, Park SH, Wang Q, et al.. Enhancement of perivascular spaces in 7 T MR image using Haar transform of non-local cubes and block-matching filtering. Scientific Reports. 2017;7(1):85-69.
- Ronneberger, O, Fischer, P, Brox, T. U-Net: Convolutional networks for biomedical image segmentation. MICCAI. 2015; 234-241.
- Tu, Z., Bai, X., 2010. Auto-context and its application to high-level vision tasks and 3D brain image segmentation. IEEE Trans. PAMI. 2010; 32: 1744-1757.
- Frangi, AF, Niessen, WJ, Vincken, KL, Viergever, MA. Multiscale vessel enhancement filtering. MICCAI. 1998; 130-137.
- Zhang, J, Gao, Y, Park, SH, et al.. Structured learning for 3D perivascular spaces segmentation using vascular features. IEEE Trans. BME. 2017.
Figures