0653
The spatial distribution of arterial and venous vessels in the human brain1Nuclear medecine and radiobiology, Université de Sherbrooke, Sherbrooke, QC, Canada, 2Medecine, Université de Sherbrooke, Sherbrooke, QC, Canada, 3Diagnostic radiology, Université de Sherbrooke, Sherbrooke, QC, Canada
Synopsis
Although human cerebrovascular system is the basis of most non-invasive measures of neural activity, its structure is poorly understood owing to the difficulty in identifying, segmenting and separating venous and arterial vessels. To resolve this, we used Susceptibility Weighting Imaging (SWI) and Magnetic Resonance Angiography Time-of-Flight (MRA-TOF) to develop a probabilistic template of vascular architecture in the MNI space using an iterative back projection approach. This template is then paired with an anatomical atlas illustrates how some grey-matter areas are more vascularized than others. This could be the first steps toward a region-based vascular regression tool for the analysis hemodynamic-based measures of brain activity, such as fMRI.
Introduction
Despite the many grey/white-matter atlases available to the community, little is known regarding the cerebral vasculature. This is of great importance, given that many neurological disorders are thought to be of vascular origin. Indeed, although probabilistic tissue maps are commonly employed in the whole brain [1], the difficulties of extracting and inter-subject-combining the veins and arteries from MRI acquisitions such as Susceptibility Weighting Imaging (SWI) and Time-of-Flight (ToF) have been attributed to their small size and their numerous and various branching. To palliate to these difficulties, we therefore used multiple image processing scheme issued by machine-learning algorithm to combine veins and arteries from multiple subjects. We then computed arterial and venous densities and mean diameters in anatomically-defined regions to investigate the distribution of the vasculature of these networks.Methods
Image acquisition was performed in healthy young adults (N=40, 18-30 years old) on a Philips 3T scanner. Each session started with an anatomical T1-weighted MPRAGE acquisition (TR/TE 7.8/3.54 msec, voxel size of 1 mm³), followed by a ToF angiography acquisition (200x200x120 FOV, TR/TE 23/3.6 msec, voxel size of 0.625x0.625x1.3 mm) and a high-resolution multi-echo SWI sequence (230x230x160 FOV, TR 28 msec, TE 6.9/12.6/18.3/24.0 msec, voxel size of 0.6x0.6x1.2mm). Both ToF and SWI were preprocessed using an in-house algorithm based on (1) non-local mean denoising [2] to enhance the image quality, followed by a (2) bayesian gaussian mixture with Dirichlet process [3] to obtain a preselection of voxels associated to vasculature, then (3) an in-house algorithm combining multiscale Frangi scores (10 scales, from 0.5 to 3.0 of Gaussian FWHM) and vessels enhancement diffusion filtering [4,5], with is finally (4) intensity-normalized and thresholded (60%) to obtain both whole-brain arterial and venous maps. We computed the diameter using the (5) ridge distance for each voxel in the centerline of a vessel obtained by a thinning algorithm [6]. All maps were then (6) registered non-linearly to MNI standard space using ANTs non-linear registration on their original SWI and ToF acquisitions [7]. To improve the registration process, we developed an (6) iterative back-projection scheme (5 iterations) by repeating the non-linear registration using a combination of the subject vasculature to the previous iteration’s updated mean of all subject vasculature (weight: 90%) and their T1 image to the MNI T1 to prevent hard deformations of the cortex (weight: 10%). We then used Freesurfer to (7) compute the 42 ipsilateral region-by-region mean diameters and vessel composition using the diameter and thresholded vessel maps of each subject.Results
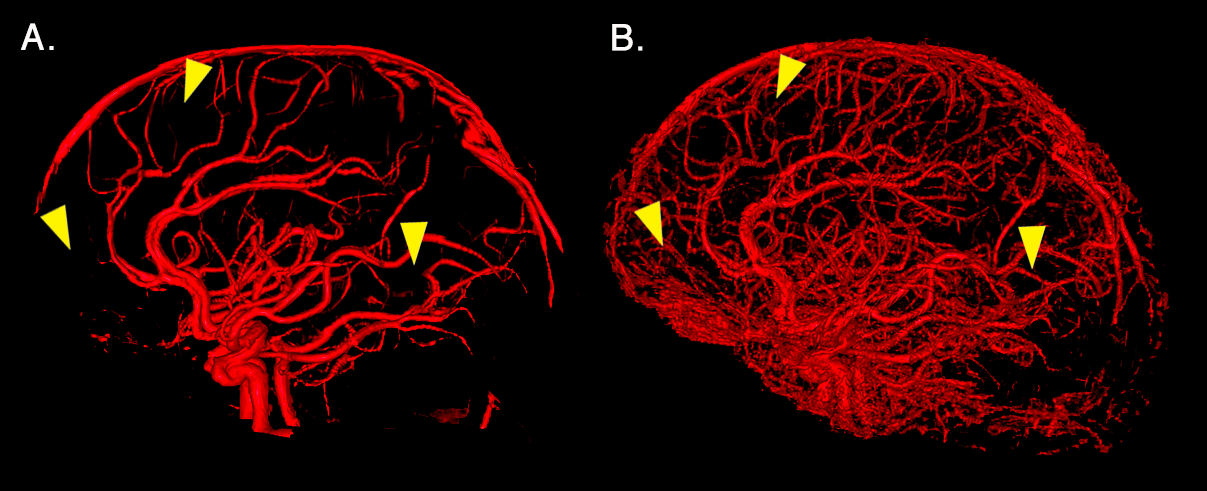
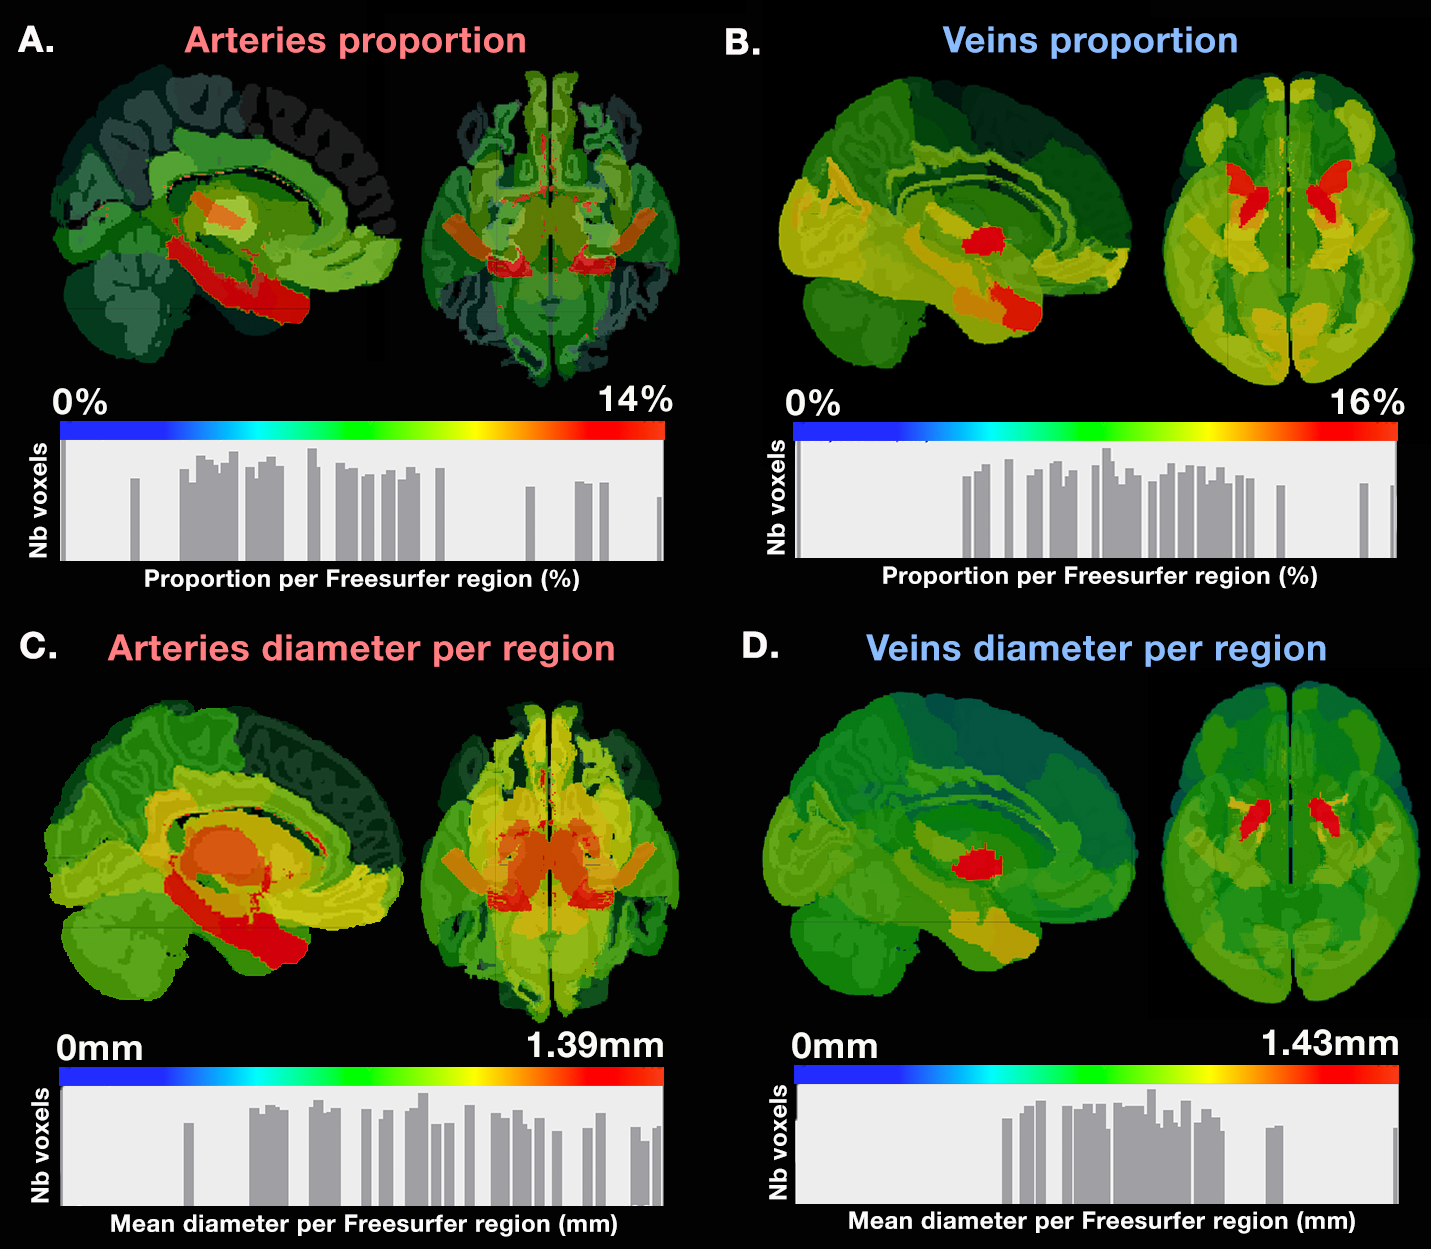
Figure 1 illustrates how our pipeline managed to reconstruct the small vessels compared to using a standard image thresholding on a single subject’s ToF. Figure 2 shows both venous (blue) and arterial (red) vessels computed from a single subject and the probability maps extracted from the mean of all participants’ SWI and ToF, respectively. Figure 3 shows the proportion of venous and arterial voxels of the 42 Freesurfer cortical regions, as well as their mean diameters per region. We found that some areas such as the motor cortex were less vascularized than others such as the middle occipital and insula, as seen on Figure 3. Overall, proportions of veins and arteries per region were strongly correlated (R=0.553, p=0.00015).Discussion and Conclusion
This research illustrates the possibility of rapid in vivo imaging and reconstruction of venous and arteral vessels in the human brain, evading the difficulties associated with averaging highly variable vessel structure in the brain involved in the inter-subject differences in branching and curvatures along their vessel trees [6]. This could potentially impact our knowledge of the vascular mechanism involved in brain function measurements such as functional MRI. Indeed, the statistical analysis of the venous and arterial composition of anatomically-defined regions defined by Freesurfer showed that some regions that were more vascularized than others, and these areas are known to exhibit high functional variability (as measured with fMRI) also were those found to be more susceptible to inter-subject variations in fMRI studies [8]. This also sheds light on the potential of such vascular atlases in the assessment of new cerebrovascular imaging biomarkers relevant to cognitive impairments or cerebrovascular diseases.Acknowledgements
The authors would like to acknowledge the funding agencies which have supported this research; Natural Sciences and Engineering Research Council of Canada (NSERC) Discovery Grants Sciences (1015), the Canada Research Chairs (CRC) in Neurovascular Coupling and QBIN (Quebec Bio-Imaging Network) Research Council.References
[1] Desikan RS, Ségonne F, Fischl B, Quinn BT, Dickerson BC, Blacker D et al. An automated labeling system for subdividing the human cerebral cortex on MRI scans into gyral based regions of interest. Neuroimage 2006; 31: 968–80.
[2] Bernier M, Chamberland M, Houde J-C, Descoteaux M, Whittingstall K. Using fMRI non-local means denoising to uncover activation in sub-cortical structures at 1.5 T for guided HARDI tractography. Front Hum Neurosci 2014; 8: 715.
[3] Pedregosa F, Varoquaux G, Gramfort A, Michel V, Thirion B, Grisel O et al. Scikit-learn: Machine Learning in Python. J Mach Learn Res 2011; 12: 2825–2830.
[4] Frangi AF, Niessen WJ, Vincken KL, Viergever MA. Multiscale vessel enhancement filtering 1 Introduction 2 Method. Computer (Long Beach Calif) 1998; 1496: 130–137.
[5] Manniesing R, Viergever MA, Niessen WJ. Vessel enhancing diffusion: a scale space representation of vessel structures. Med Image Anal 2006; 10: 815–25.
[6] Bizeau A, Gilbert G, Bernier M, Huynh MT, Bocti C, Descoteaux M et al. Stimulus-evoked changes in cerebral vessel diameter: A study in healthy humans. J Cereb Blood Flow Metab 2017; 0271678X1770194.
[7] Avants B, Tustison N, Song G. Advanced Normalization Tools (ANTS). Insight J 2009; : 1–35.
[8] Chamberland M, Girard G, Bernier M, Fortin D, Descoteaux M, Whittingstall K. On the Origin of Individual Functional Connectivity Variability: The Role of White Matter Architecture. Brain Connect 2017; 7: 491–503.
Figures