0649
An Aerosol-Deposited Wireless Resonant Marker for Catheter Tracking in Interventional MRI1Radiology and Biomedical Imaging, University of California, San Francisco, San Francisco, CA, United States, 2Quest Integrated, LLC, Kent, WA, United States, 3UC Berkeley-UCSF Graduate Program in Bioengineering, University of California, Berkeley, Berkeley, CA, United States
Synopsis
Catheter visualization and guidance under MRI guidance can be challenging, and conventional MR tracking coils decrease the flexibility and increase the profile of catheters. We used aerosol jet deposition to print a capacitor and an inductor with a double helix geometry on a polymer catheter. bSSFP sequences with flip angles 5°, 15°, and 90°, and a B1+ map were acquired at 3T, and CNR and amplification were measured. The marker demonstrated good CNR and B1+ signal amplification, suggesting that fabrication of complete 3D printed LC circuits for use as markers on catheters is feasible and can exhibit good tracking characteristics.
Introduction
Catheter visualization and guidance under MRI guidance can be challenging. Markers can be used for tracking, and are typically categorized as passive, active, or semi-active. Semi-active methods are implemented as wireless resonant circuits, which work by inductively coupling to the MR systems transmit coil1, inducing a current in the circuit that is then amplified, increasing the surrounding magnetization and signal. One early implementation used a solenoid geometry surrounding a small solution, used as a fiducial marker for localization2. These wireless resonant circuits3, also known as inductively coupled RF coils4, have previously been built on top of guide catheters using a variety of fabrication methods and inductor geometries. Prior studies have used inductor coil geometries such as a rectangular surface loop coil5, two opposing solenoids oriented6, and flat spiral coils7. Resonant markers are commonly built using manual wire winding and lumped elements; however, such methods increase the thickness and decrease the flexibility of the catheter, making these methods less practical for neurointerventional procedures. A number of microfabrication methods have been explored beyond manual wire winding, including flexible printed circuit boards, hot embossing, and thin-film techniques8. These techniques have a number of limitations: flexible printed circuit boards can add substantial thickness of 1 mm or more, techniques such as hot embossing, and thin-film techniques, are not ideal for 3D structures7, and traditional multi-step fabrication techniques require a rigid, planar framework.
Aerosol jet deposition is a new additive manufacturing process used to create 3D, conformal, micron size (10–100 μm) electronics and is CAD-file driven, making design practical and customizable. A prior study used aerosol deposition to print a solenoid inductor, which was then connected to a 100pF capacitor (dimensions 1×0.5×0.6mm3) inside the catheter lumen9 for use at 1.0T, and recent work proposed an inductor geometry in the shape of a double helix, using wire-winding and a customized flexible capacitor sheet10. We aim to extend upon these works by using aerosol jet deposition to print a complete LC circuit using the geometry of a double helix inductor on a polymer catheter for interventional MRI use at 3T.
Methods
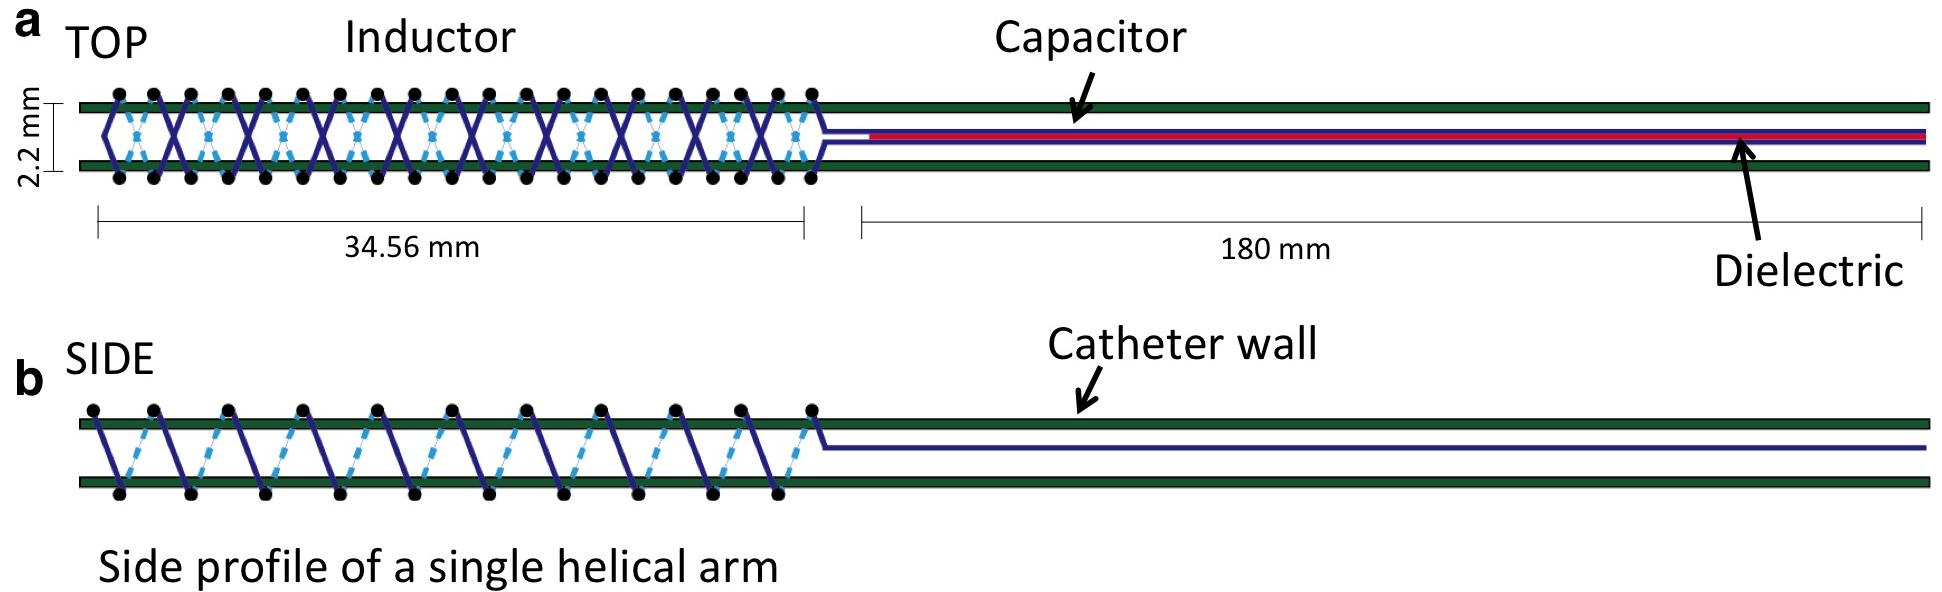
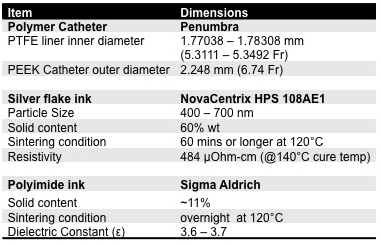
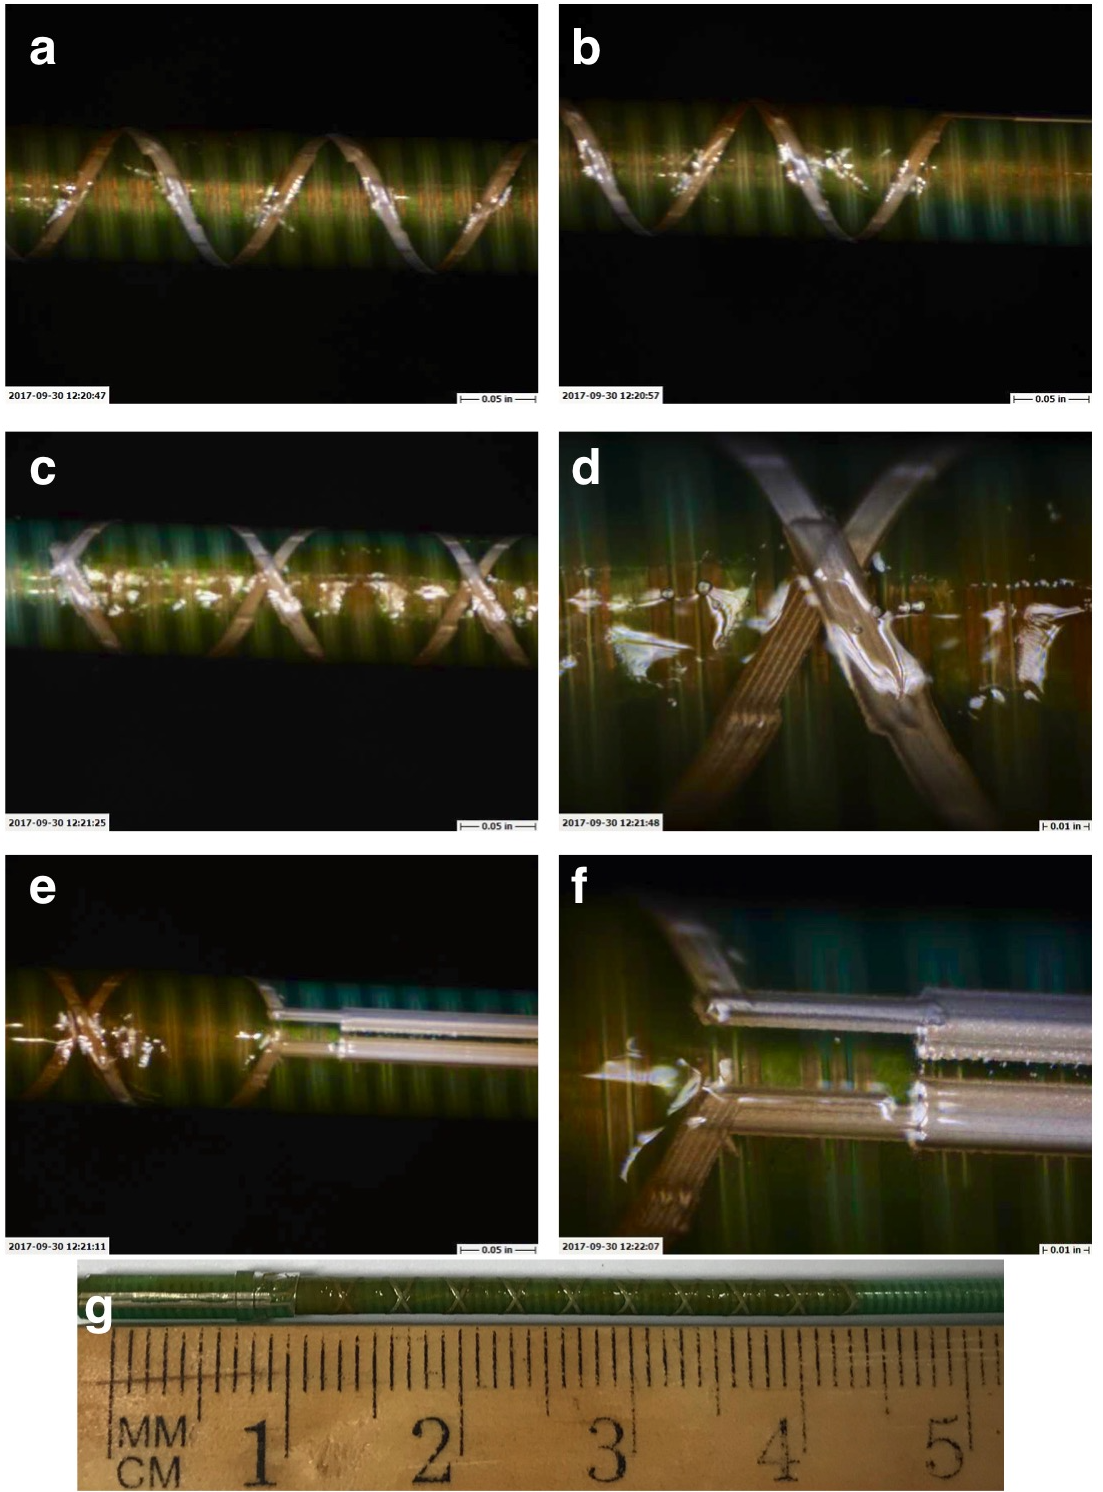
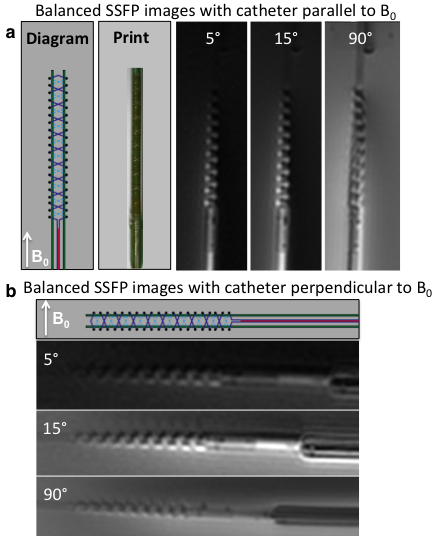
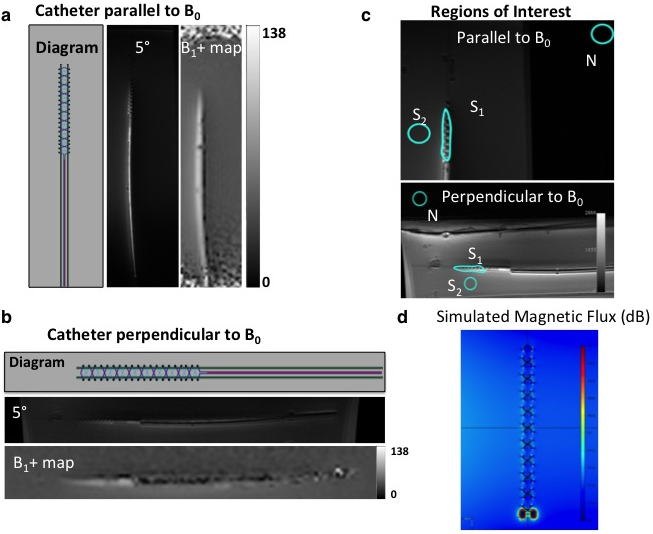
Resonant marker construction: An MR-safe catheter was constructed using a 6Fr catheter PTFE substrate, and polyethylene ether ketone (PEEK) braiding (Penumbra Inc.). The conductive traces were printed with a 250 μm trace width, 10 turns with a 22.5° pitch, for a total length of 34.56 mm, and a 5–7 μm trace thickness (Fig. 1). The capacitor plates were printed measuring 180 mm long, with 280–300 μm trace width, with a similar 5–7 μm trace thickness, and 200 μm separation of the plates (Fig. 1). All conductive prints used a water-based silver flake ink and polyimide dielectric ink (Quest Integrated) (Table 1), and were then sealed with heat shrink (Fig. 2). Image acquisition: The catheter was placed in a water phantom doped with CuSO4 and the phantom was oriented either parallel or perpendicular to B0. Images were acquired in both orientations at 3T (Discovery MR750w, GE Healthcare) using an 8-channel cardiac coil. A balanced steady state free precession (bSSFP) sequence (TE/TR = 1.7/4.63ms, 30 mm2 FOV, slice thickness 10 mm, matrix 384 × 384) was acquired with flip angles 5°, 15°, and 90°. A 5° Bloch-Siegert B1+ map11,12 was also acquired (TE/TR = 13.4/28ms, 30 mm2 FOV, slice thickness 10 mm, matrix 128 × 128). The mean signal of the marker was measured, and compared with the nearby water signal for contrast-to-noise (CNR) and amplification factor measurements (Fig. 4c). Electromagnetic Simulations: Using finite element method software (COMSOL 5.3), we modeled the electromagnetic fields of the marker, using a 8-rung birdcage coil to provide transmit RF excitation for inductive coupling to the marker.Results
The low flip angle bSSFP sequence (5° and 15°) shows the signal amplification of the markers relative to the background signal, in comparison with the high flip angle (90°) sequence (Fig. 3). In the parallel orientation, the CNR measured 31.4 and 67.8 for 5° and 15° flip angles respectively, and the mean amplification factor of the 5° B1+ map was 1.5 (Fig. 4a). In the perpendicular orientation, the CNR measured 12.2 and 34.4 for 5° and 15° flip angles respectively, and the mean amplification factor of the 5° B1+ map was 1.3 (Fig. 4b). The simulated magnetic flux density norm demonstrated a similar signal pattern to that of the experimental signal (Fig. 4d).Discussion
This preliminary data suggests that fabrication of complete 3D printed LC circuits for use as tracking markers on catheters is possible and that these markers can exhibit good tracking characteristics at 3T.Acknowledgements
The authors gratefully acknowledge Andrew Chu and Dave Barry at Penumbra, Inc, for in-kind provision of catheter shafts, materials, and engineering expertise, and Ron Watkins and Dr. Greig Scott for engineering discussions. Funding supported included grants UL1 TR001872-01, R01 EB012031, R21 EB020283, TL1 TR001871.References
1. Burl, M., et al. Magn. Reson. Med. 41, 636–638 (1999). 2. Burl, M., et al. Magn. Reson. Med. 36, 491–3 (1996). 3. Rube, M. A., et al. Magn. Reson. Imaging 32, 693–701 (2014). 4. Celik, H., et al. Magn. Reson. Med. 58, 1224–1231 (2007). 5. Quick, H. H. et al. Magn. Reson. Med. 53, 446–455 (2005). 6. Kuehne, T. et al. Radiology 233, 774–780 (2004). 7. Ellersiek, D. et al. Sensors Actuators B Chem. 144, 432–436 (2010). 8. Kaiser, M. et al. Biomed. Eng. / Biomed. Tech. 60, (2015). 9. Will, K. et al. Society of Photo-Optical Instrumentation Engineers 76251Z (2010). 10. Thorne, B. R. et al. Proc. Intl. Soc. Mag. Reson. Med. 21, 2327 (2014). 11. Khalighi, M. M., et al. Magn. Reson. Med. 68, 857–862 (2012). 12. Sacolick, L. I., et al. Magn. Reson. Med. 63, 1315–1322 (2010).
Figures