0647
MRI Safety Assessment of Orthopedic Implants on the Bone Surface via the Induced Tangential E-Fields1ITIS Foundation, Zurich, Switzerland, 2Department of Physics, Aristotle University of Thessaloniki, Thessaloniki, Greece, 3Center for Devices and Radiological Health (CDRH), US Food and Drug Administration (FDA), Silver Spring, MD, United States, 4Swiss Federal Institute of Technology (ETH), Zurich, Switzerland
Synopsis
Orthopedic implant manufacturers produce a large portfolio of on-bone devices. Current implant RF safety standards, e.g., ASTM F2182-11a and TS/ISO 10974, do not take advantage of very well-defined data on relevant RF exposures of these devices, i.e., E-fields tangential to the bone-surface. In our approach presented here, we explore the use of the bone-surface-averaged tangential E-field as a close approximation of the incident field impacting an on-bone orthopedic device. The relevant surface-averaged tangential E-fields are less than half of the corresponding peak volume-averaged E-fields, which allows for realistic but not overly conservative assessment of RF implant safety in MRI.
Introduction
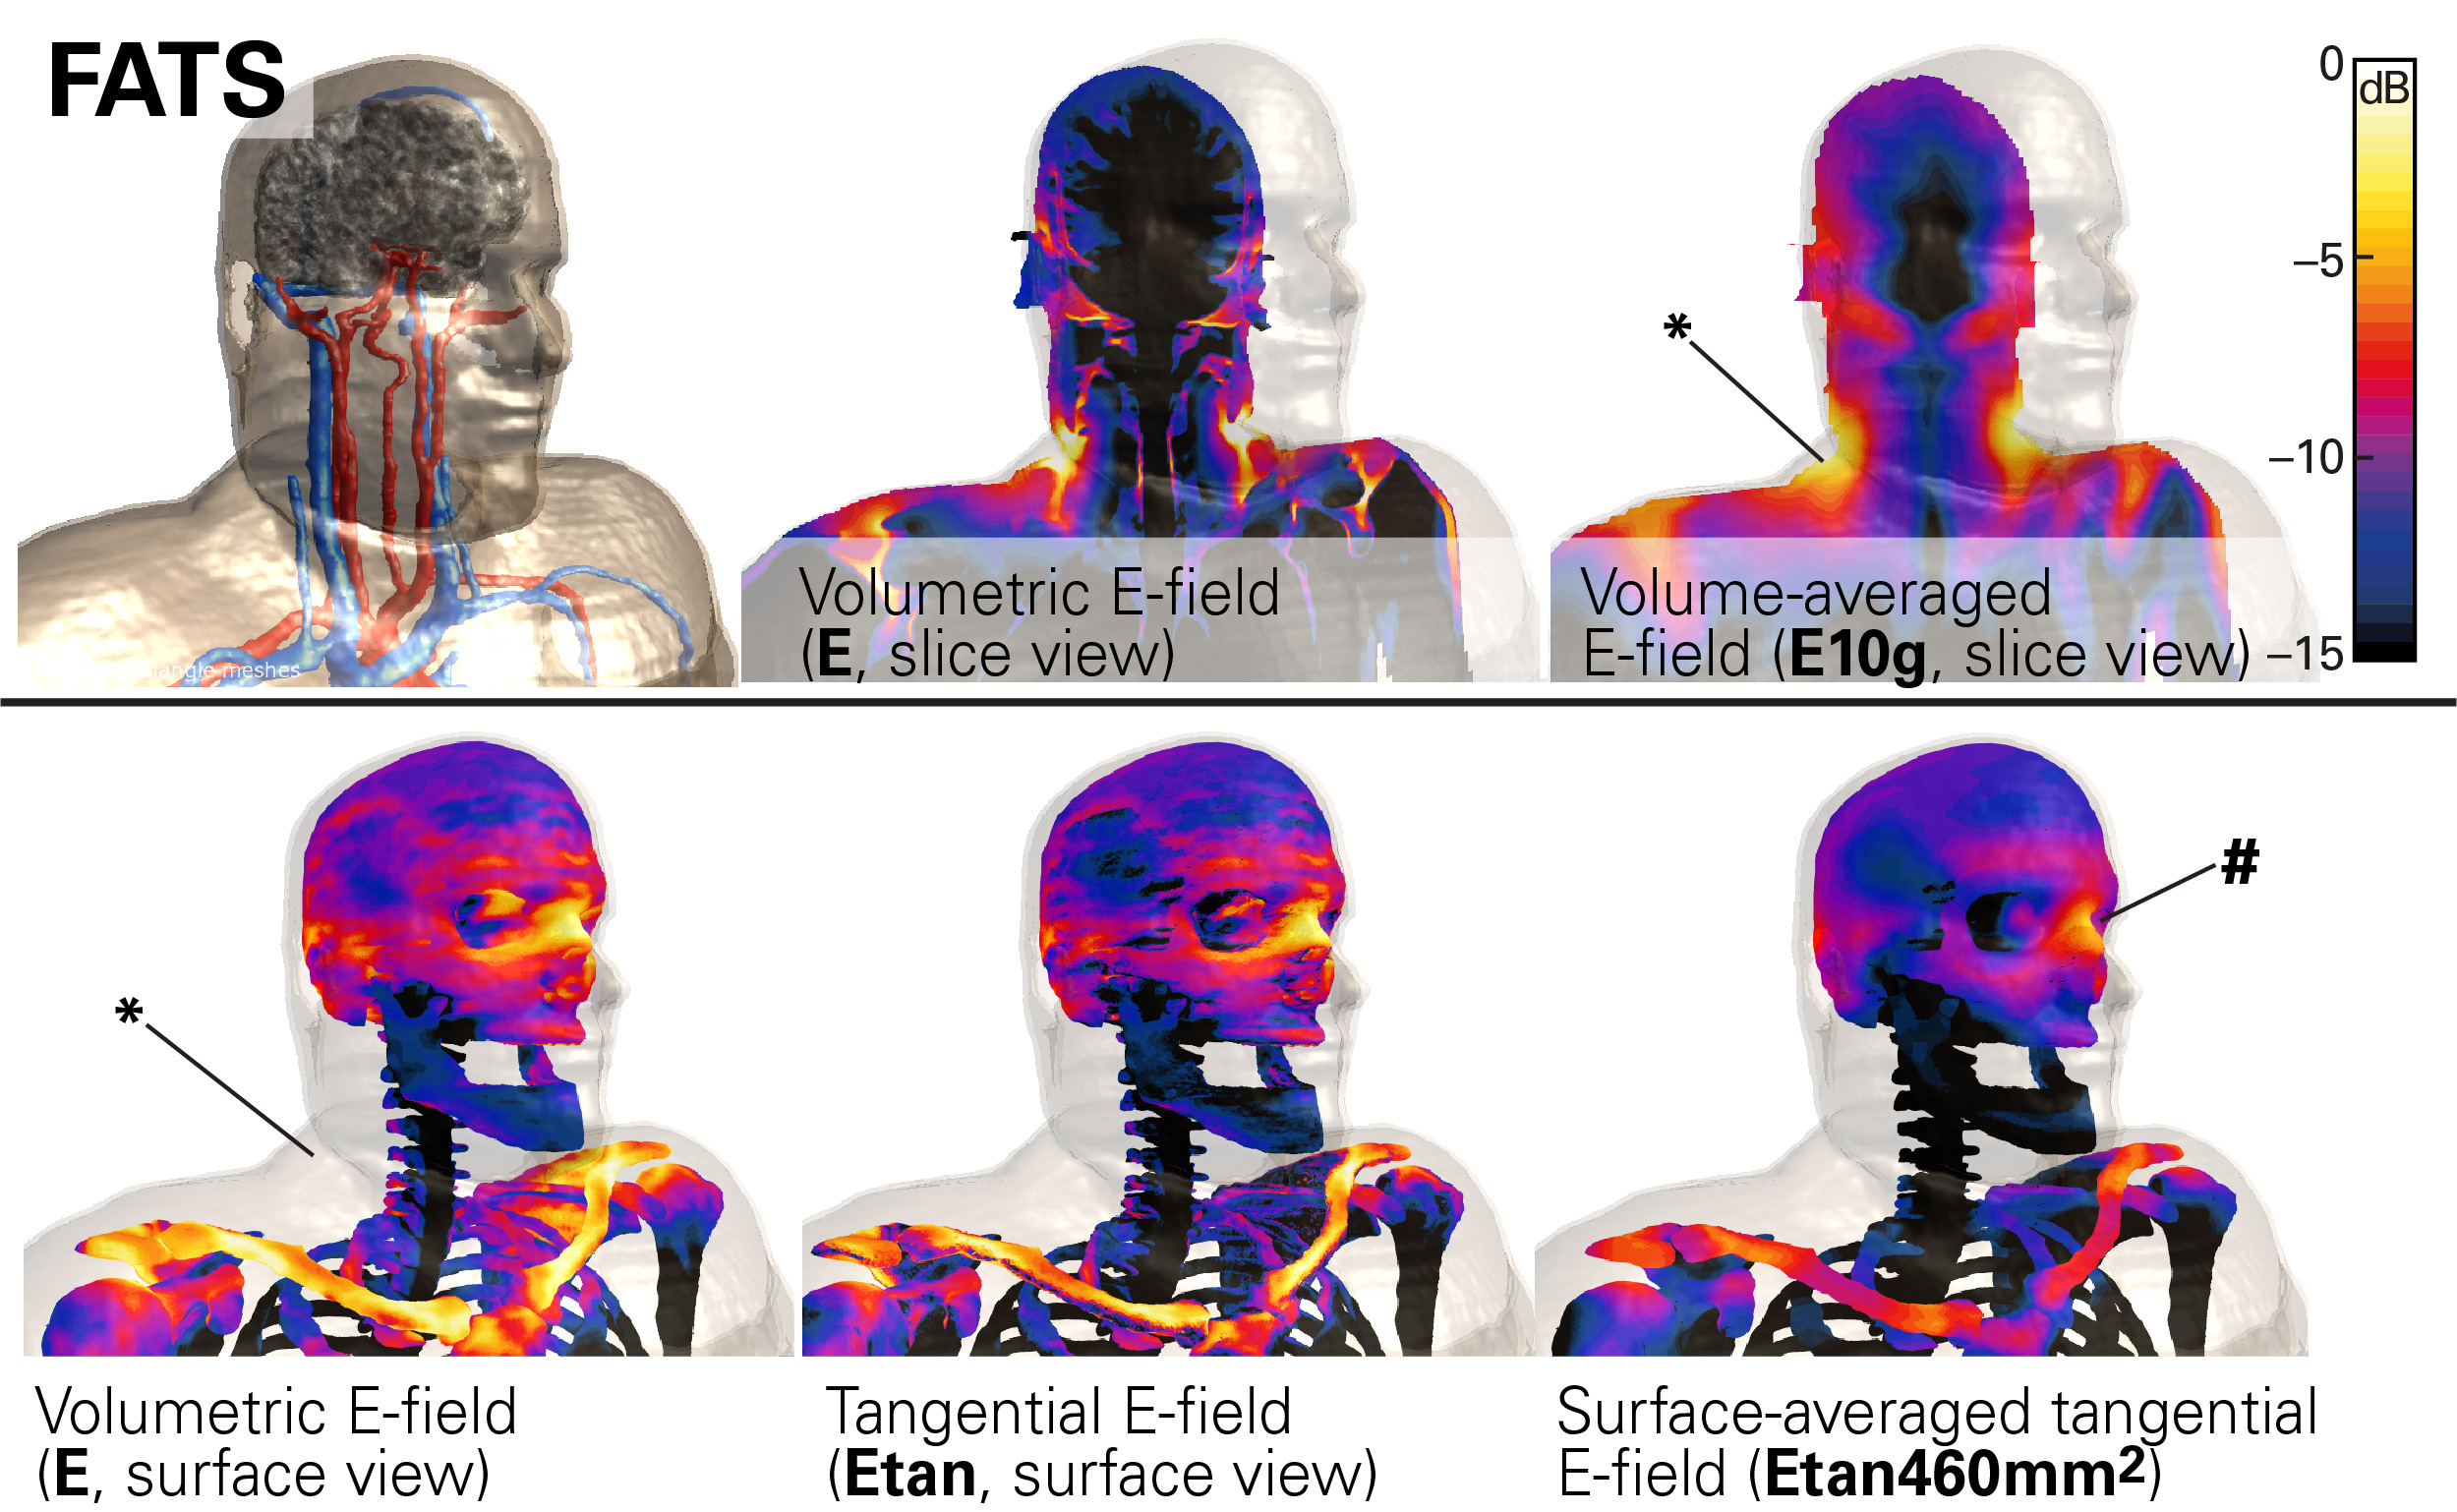
Orthopedic implant manufacturers produce a large portfolio of on-bone devices – such as plates and meshes – of tremendously diverse geometries and sizes. Specific application of a device on a given bone structure generates a very well-defined relevant incident electric (E-) field tangential (Etan) to the respective bone-surface. The Tier-2 method of the technical specification ISO/TS 109741 does not take advantage of Etan data, accepting instead the volumetric 10g averaged maximum E-field at the implant location as the criterion, which therefore, in general, leads to overestimation of the maximum E-field at the location of the implant. When only the surface-averaged Etan is considered, overestimation is eliminated, allowing for robust and conservative safety assessments of this implant category. A comparison between the volumetric and tangential E-fields is shown in Figure 1.
The “modified Tier-2” approach proposed here can be decomposed into 3 steps: (1) assessment of the maximally induced in vivo E-field on the surface of the patient’s bone; (2) evaluation of the resulting additional power deposition and temperature increase caused by the implant in vitro; and (3) validation of the conservativeness of this approach with full-wave simulations for selected scenarios.
In this feasibility study, we focus on a cranial bone plate and mesh, with the respective incident E-fields evaluated at the skull bone. Work to extend the concept for use with other body regions and implant categories is underway.
Methods
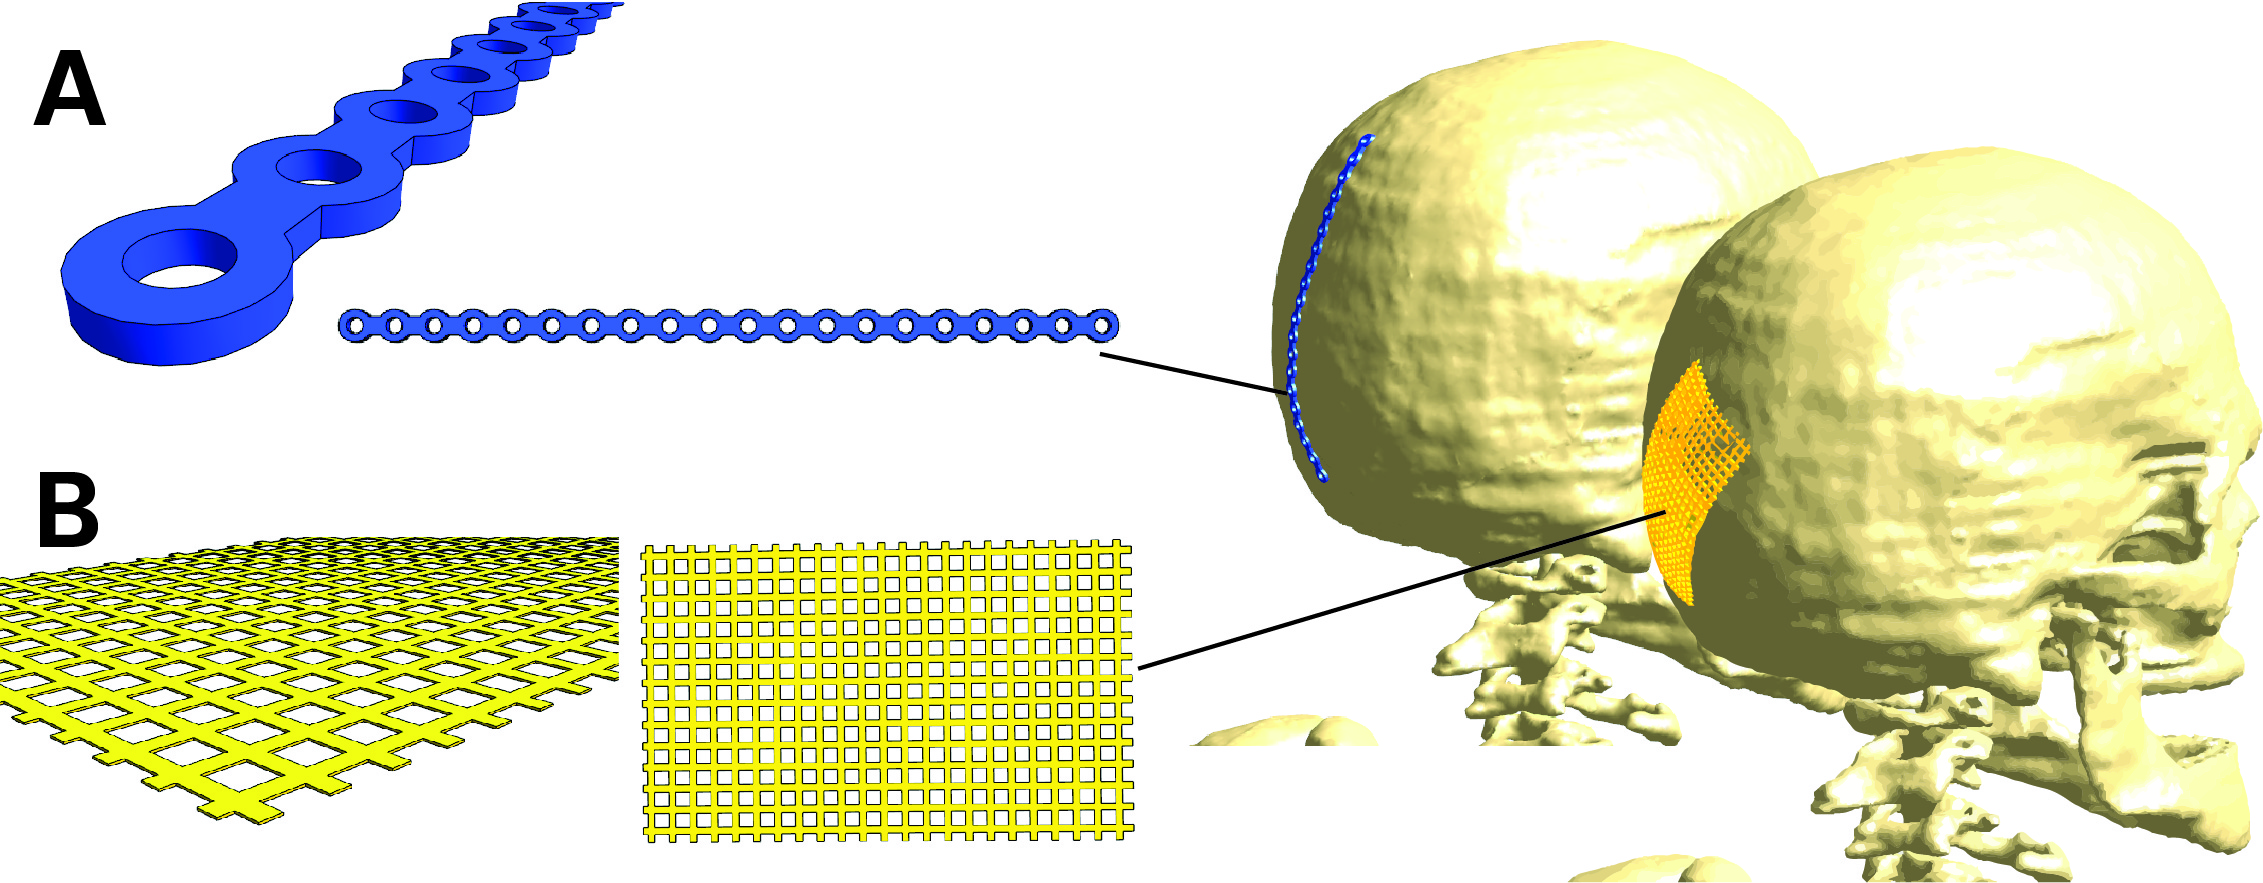
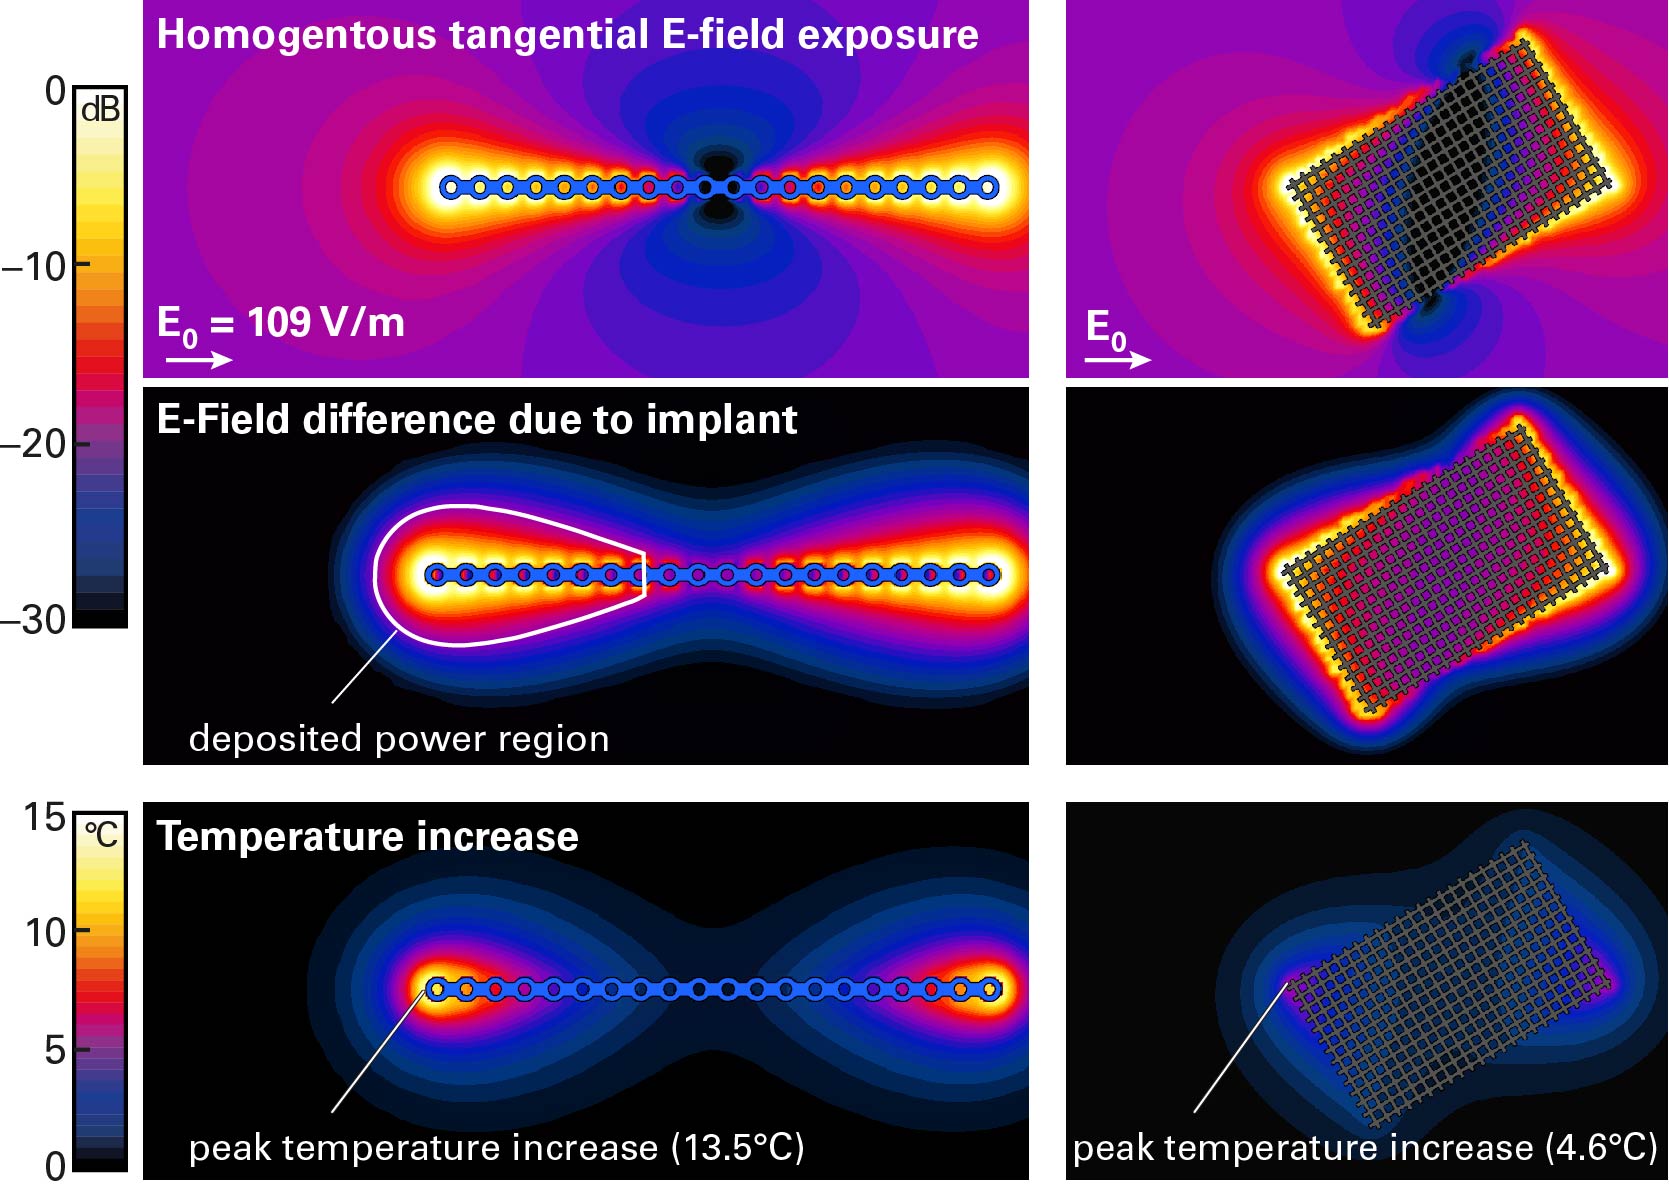
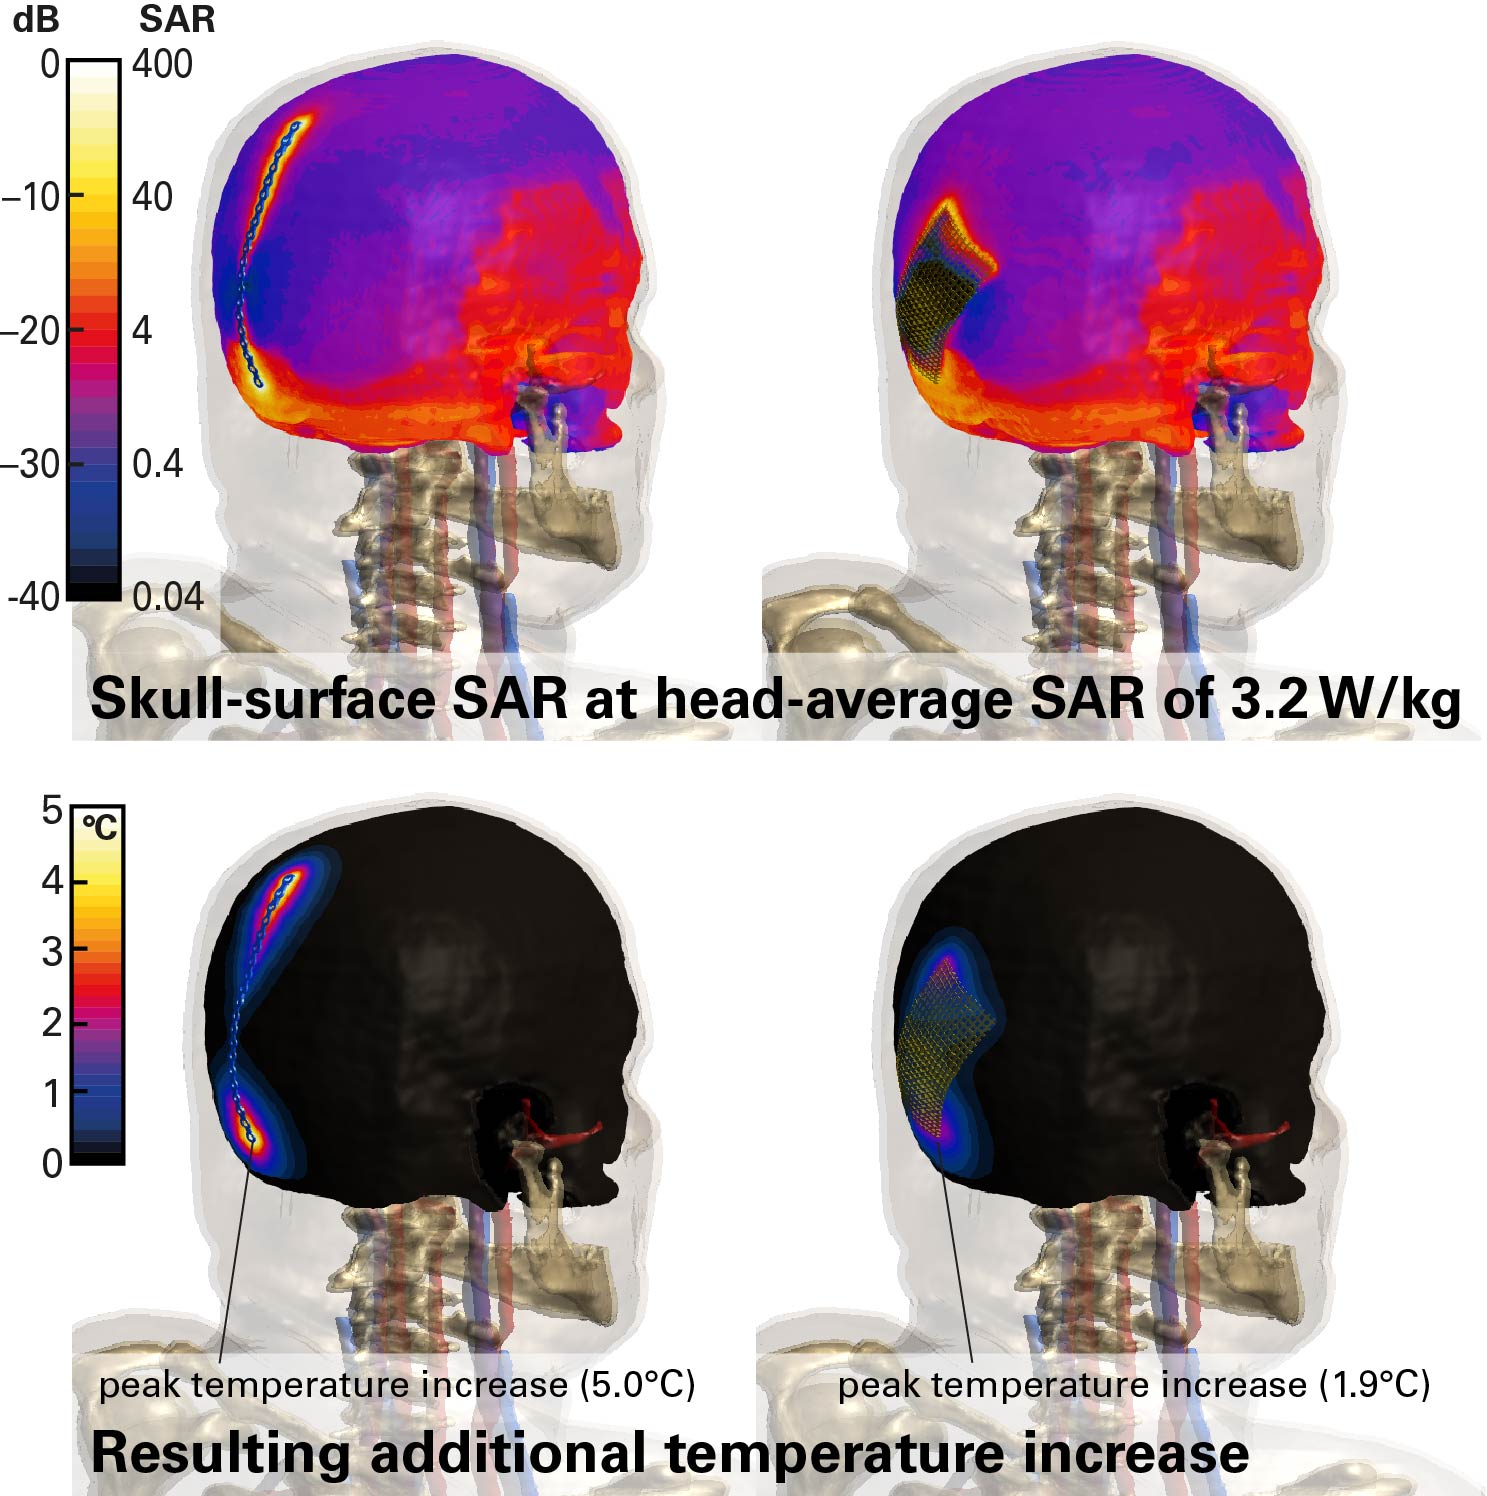
We investigated a generic cranial plate (120mm long, 5mm wide, 1mm thick) and a cranial mesh (82mm diagonal long, 0.1mm thick), both shown in Figure 2. The lengths of the two implant types were also varied to assess relative impact. The bone-surface E-fields (Step-1) were evaluated with the anatomical models DUKE and FATS of the Virtual Population2 in the head imaging position for a generic 1.5T CP birdcage body-coil, normalized to the guideline limit3 of 3.2 W/kg head-averaged specific absorption rate (SAR). Evaluations will be extended to the whole body, with other human models and various radiofrequency (RF) birdcage geometries. The tangential fields are determined with Sim4Life (ZMT, Zurich, Switzerland), and averaged over a 460mm2 area (Etan460mm2), which corresponds to the two-dimensional cross-section of a 10g-cube of muscle tissue. The implant-enhanced in vitro fields (Step-2) were computed by exposing the implant in a simplified planar tissue model to the E-field estimated in Step-1. The human skull is interfaced with fat or muscle on the outer surface, therefore the implant is placed onto a bone-tissue simulating block and embedded in the muscle tissue, which results in a larger amount of power deposited and higher temperature rise than at the bone-fat interface. The electrothermal simulations estimate the deposited power (within a 20dB falloff region) and the peak temperature increase at the implant tip, with the discretization adjusted to ascertain sufficient convergence. The scenarios identified for the full-wave simulation (Tier-4) are shown in Figure 2.Results
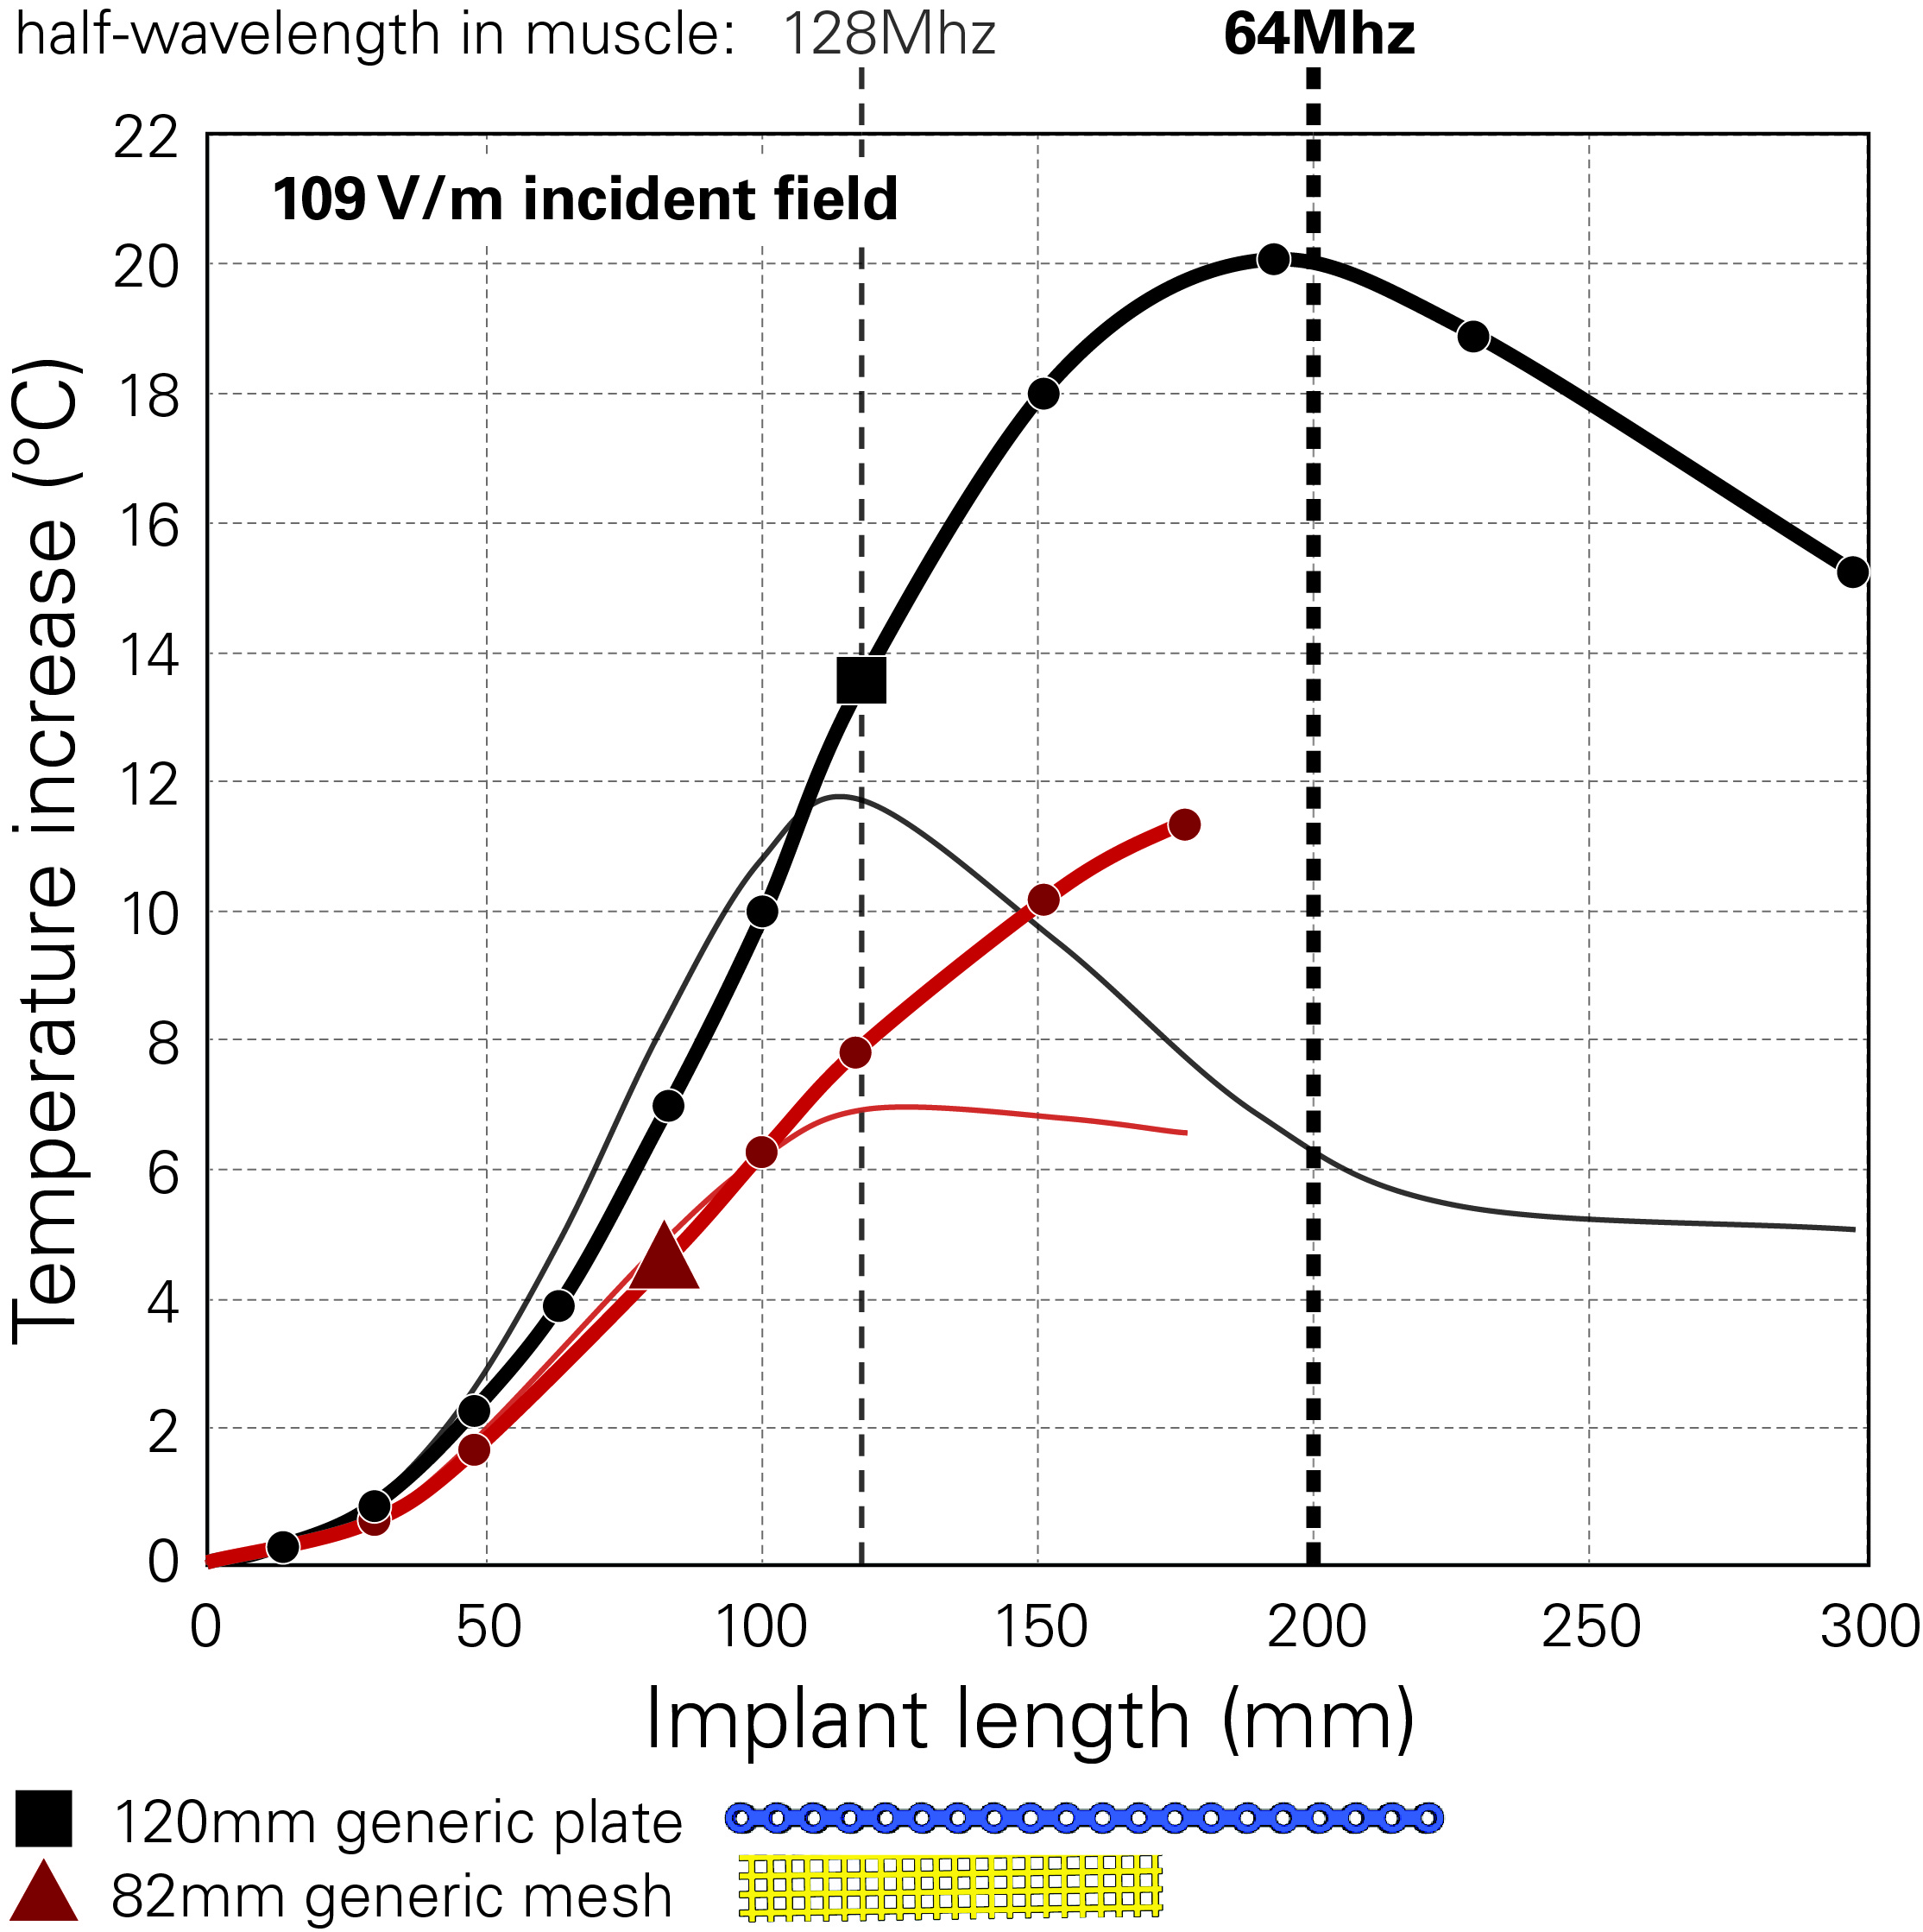
The maximum E-fields induced in FATS and DUKE in the head imaging position are (values in parentheses denote the 95th percentile): 348 (147) V/m E10g in the whole head and 217 (171) V/m E10g in the skull bone; the surface-averaged tangential fields are 155 (109) V/m Etan460mm2. Thus, our proposed approach returns 95th percentile incident fields almost 3 dB lower for the implant than obtained with the classic Tier-2 approach. As very short implants (<20mm) are less of a concern, we applied the 95th percentile Etan460mm2 of 109 V/m for the incident field of the in vitro exposure of Step-2. The estimated peak temperature increases are 13.5°C for the cranial plate and 4.6°C for the mesh (Fig.3). These values conservatively cover all possible implant placements on the skull. Variation of the implant lengths show the expected behavior when approaching the resonant length in tissue (Fig.4). The Tier-4 validation simulations are illustrated in Figure 5. The full-wave simulations for the two selected exposure scenarios show temperature increases well below the estimated conservative values of Step-2.Conclusions
Conservative but not overly restrictive magnetic resonance imaging (MRI) RF implant safety assessment is essential to make MRI scanning available to patients with implants. Our proposed approach facilitates the estimation of thermal load due to orthopedic on-bone devices. In further studies, we will extend our approach to the rest of the body and investigate the feasibility of surrogate modelling to cover entire on-bone implant groups.Disclaimer
The mention of commercial products, their sources, or their use in connection with material reported herein is not to be construed as either an actual or suggested endorsement of such products by the Department of Health and Human Services.Acknowledgements
No acknowledgement found.References
1. ISO/TS. 10974:2012, Requirements for the safety of magnetic resonance imaging for patients with an active implantable medical device. ISO/TS 10974 2012.
2. Gosselin M-C, Neufeld E, Moser H, et al. Development of a new generation of high-resolution anatomical models for medical device evaluation: the Virtual Population 3.0. Phys Med Biol 2014;59:5287–5303.
3. IEC. Medical electrical equipment - Part 2-33: Particular requirements for the basic safety and essential performance of magnetic resonance equipment for medical diagnosis, Edition 3.2. IEC 60601-2-33:2010+AMD1:2013+AMD2:2015 CSV 2015.
Figures