0643
Imaging Conditions and Image Quality for Patients with MR-conditional Implantable Medical Devices: Normal Volunteer Study1Course of Electric and Electronic Engineering, Graduate School of Engineering, Tokai University, Hiratsuka, Japan, 2Graduate School of Science and Technology, Tokai University, Hiratsuka, Japan, 3Department of Radiology, School of Medicine, Tokai University, Isehara, Japan
Synopsis
Actual SAR values measured by calorimetry varied for a factor of 2.3 among three different scanners (two 1.5T and one 3T) even at identical console SAR settings. Console B1+RMS values also deviate for a factor of 1.2 between the two 1.5T. Image quality assessment performed by three radiologists suggested that the image quality change due to the console SAR setting was not critical at a 1.5-T scanner, but was so at a 3-T scanner. Therefore attention should be paid to the variation of the actual SAR even if the console SAR is at a condition specified for an implantable medical device.
Background and Purpose
Currently, maximum allowable values of specific absorption rate (SAR) and/or B1+RMS are specified as imaging conditions for MR-conditional implantable medical devices. Since these parameters have different physical meanings, the imaging parameters and the resultant image quality may vary with the selection of these limiting conditions. In addition, only SAR is available on some relatively old 1.5-T scanners. Dissociation of the image quality stemmed from the selection of these limiting factors should be avoided in order to guarantee clinical output. Thus, the present study was conducted to evaluate the actual SAR, image quality, scan duration and spatial coverage under different SAR and B1+RMS settings in a phantom and healthy volunteers with various BMI's.
Methods
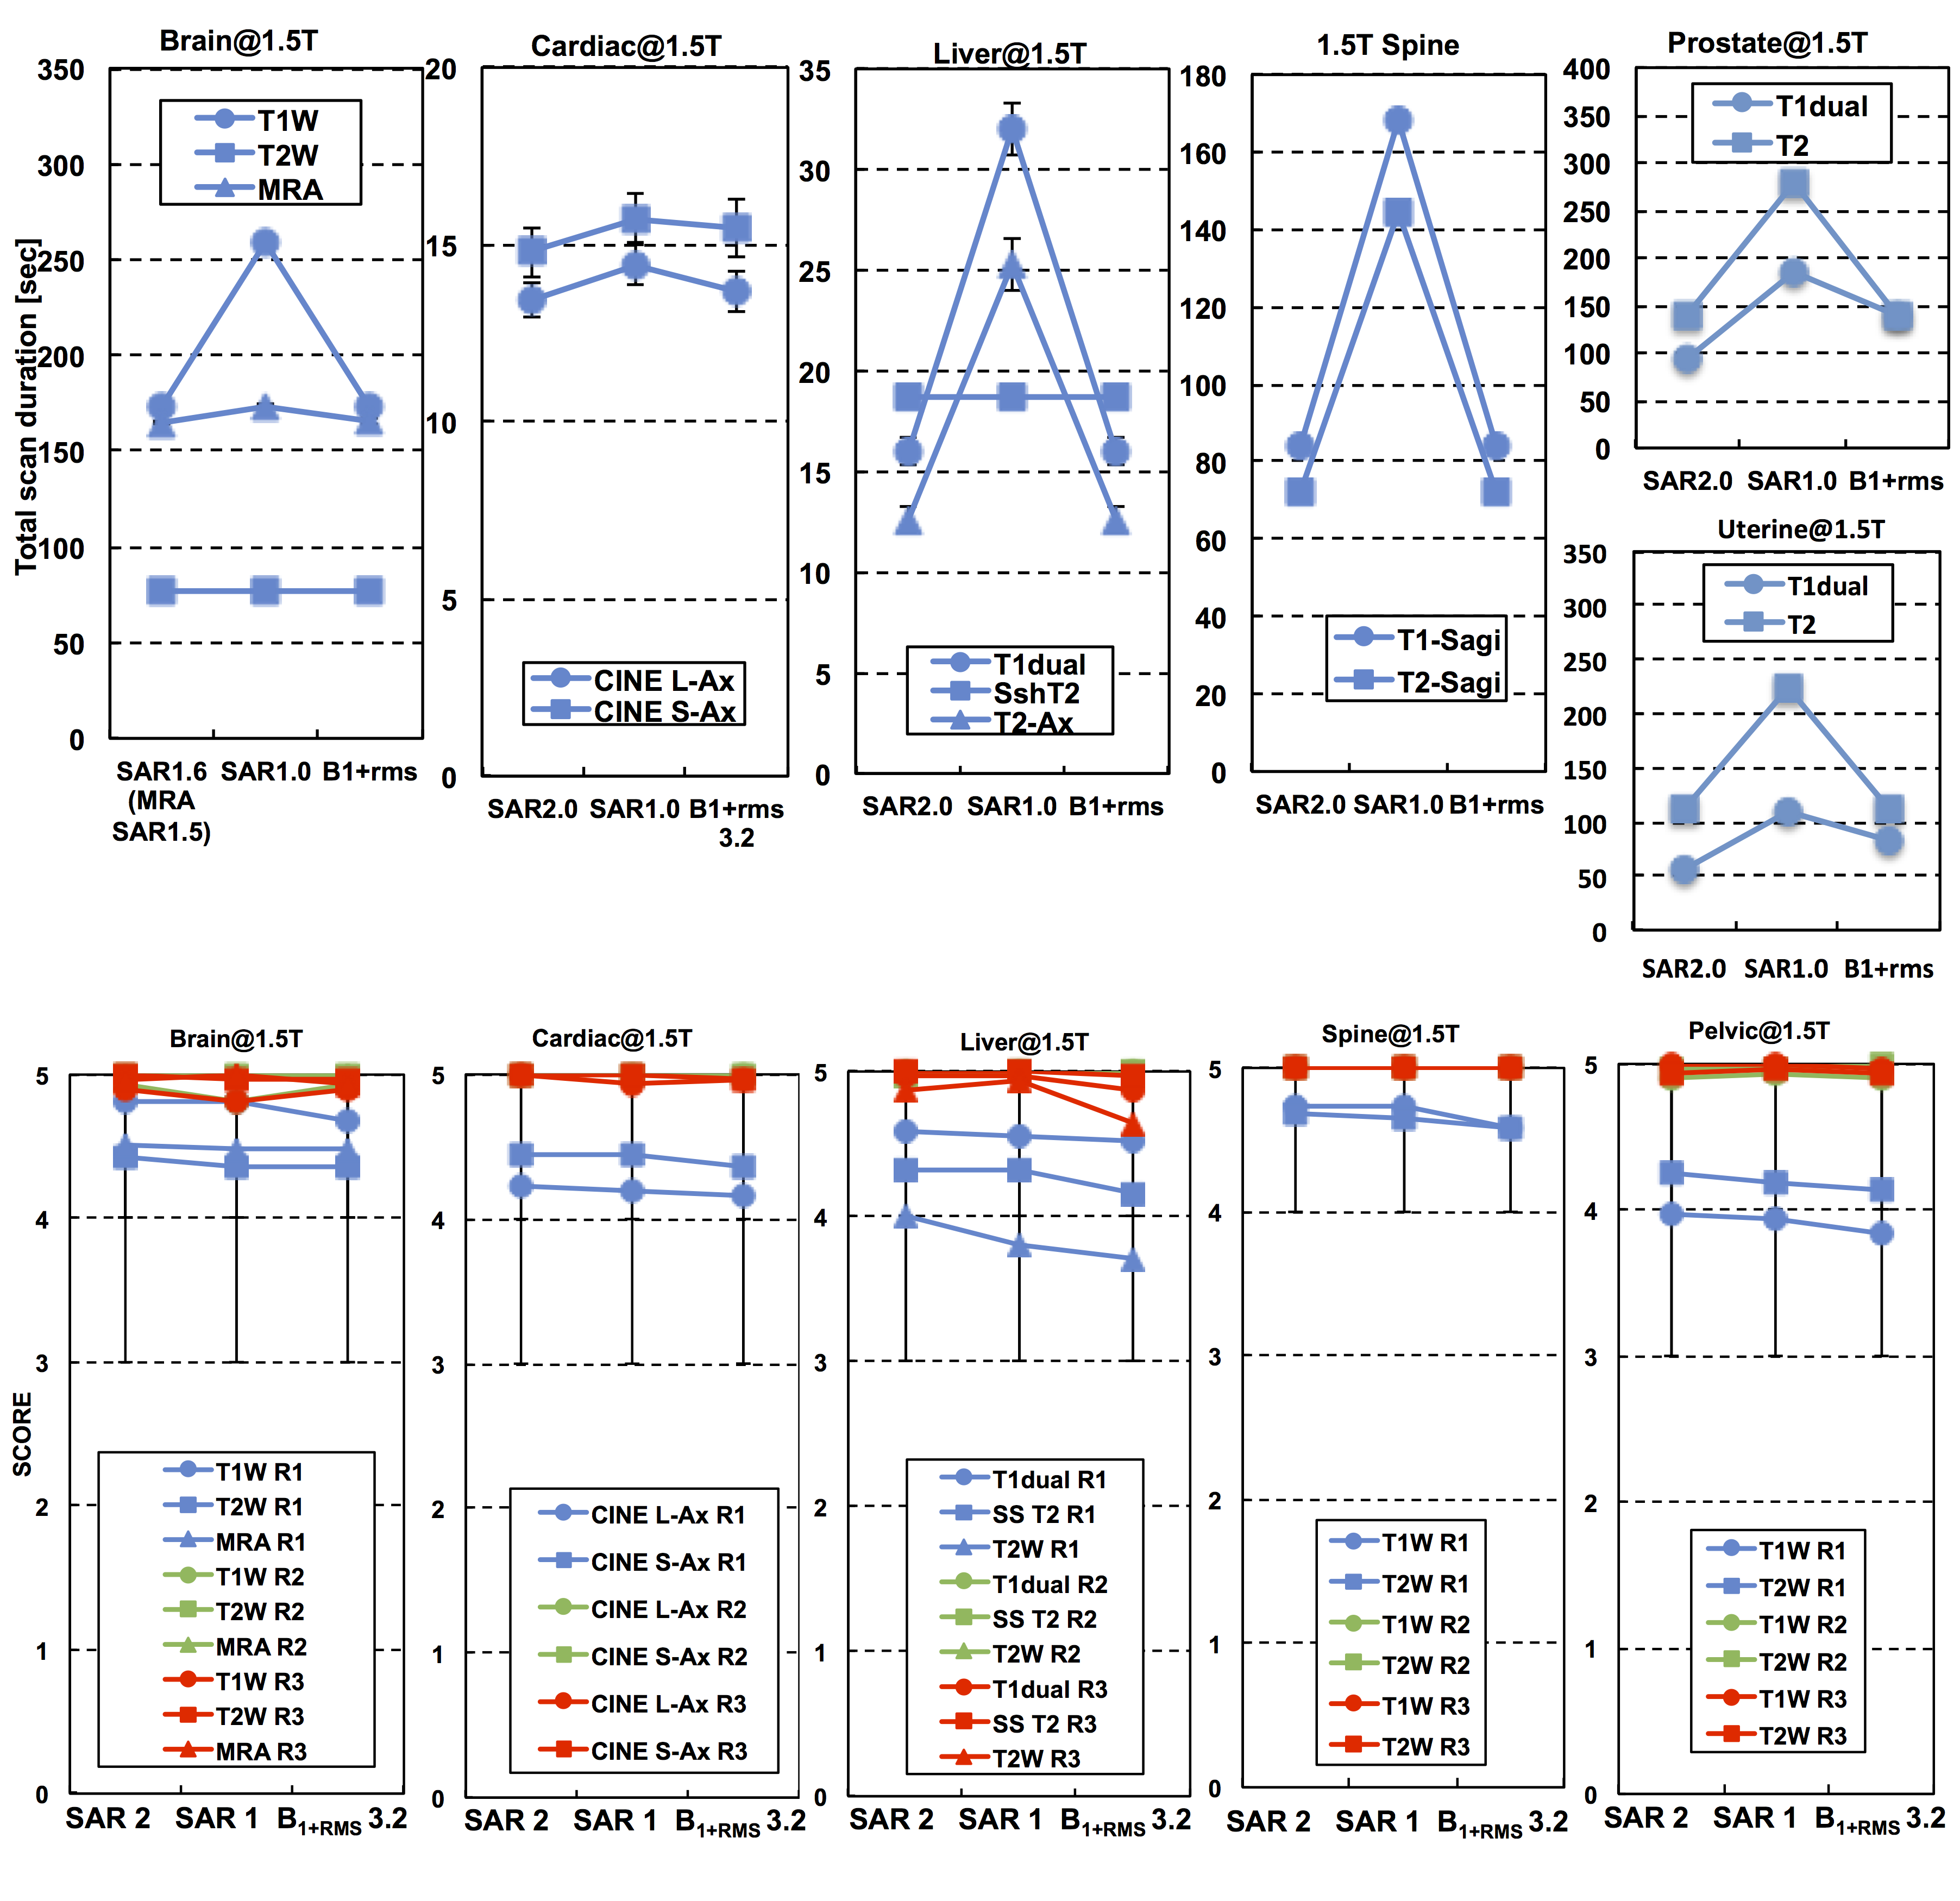
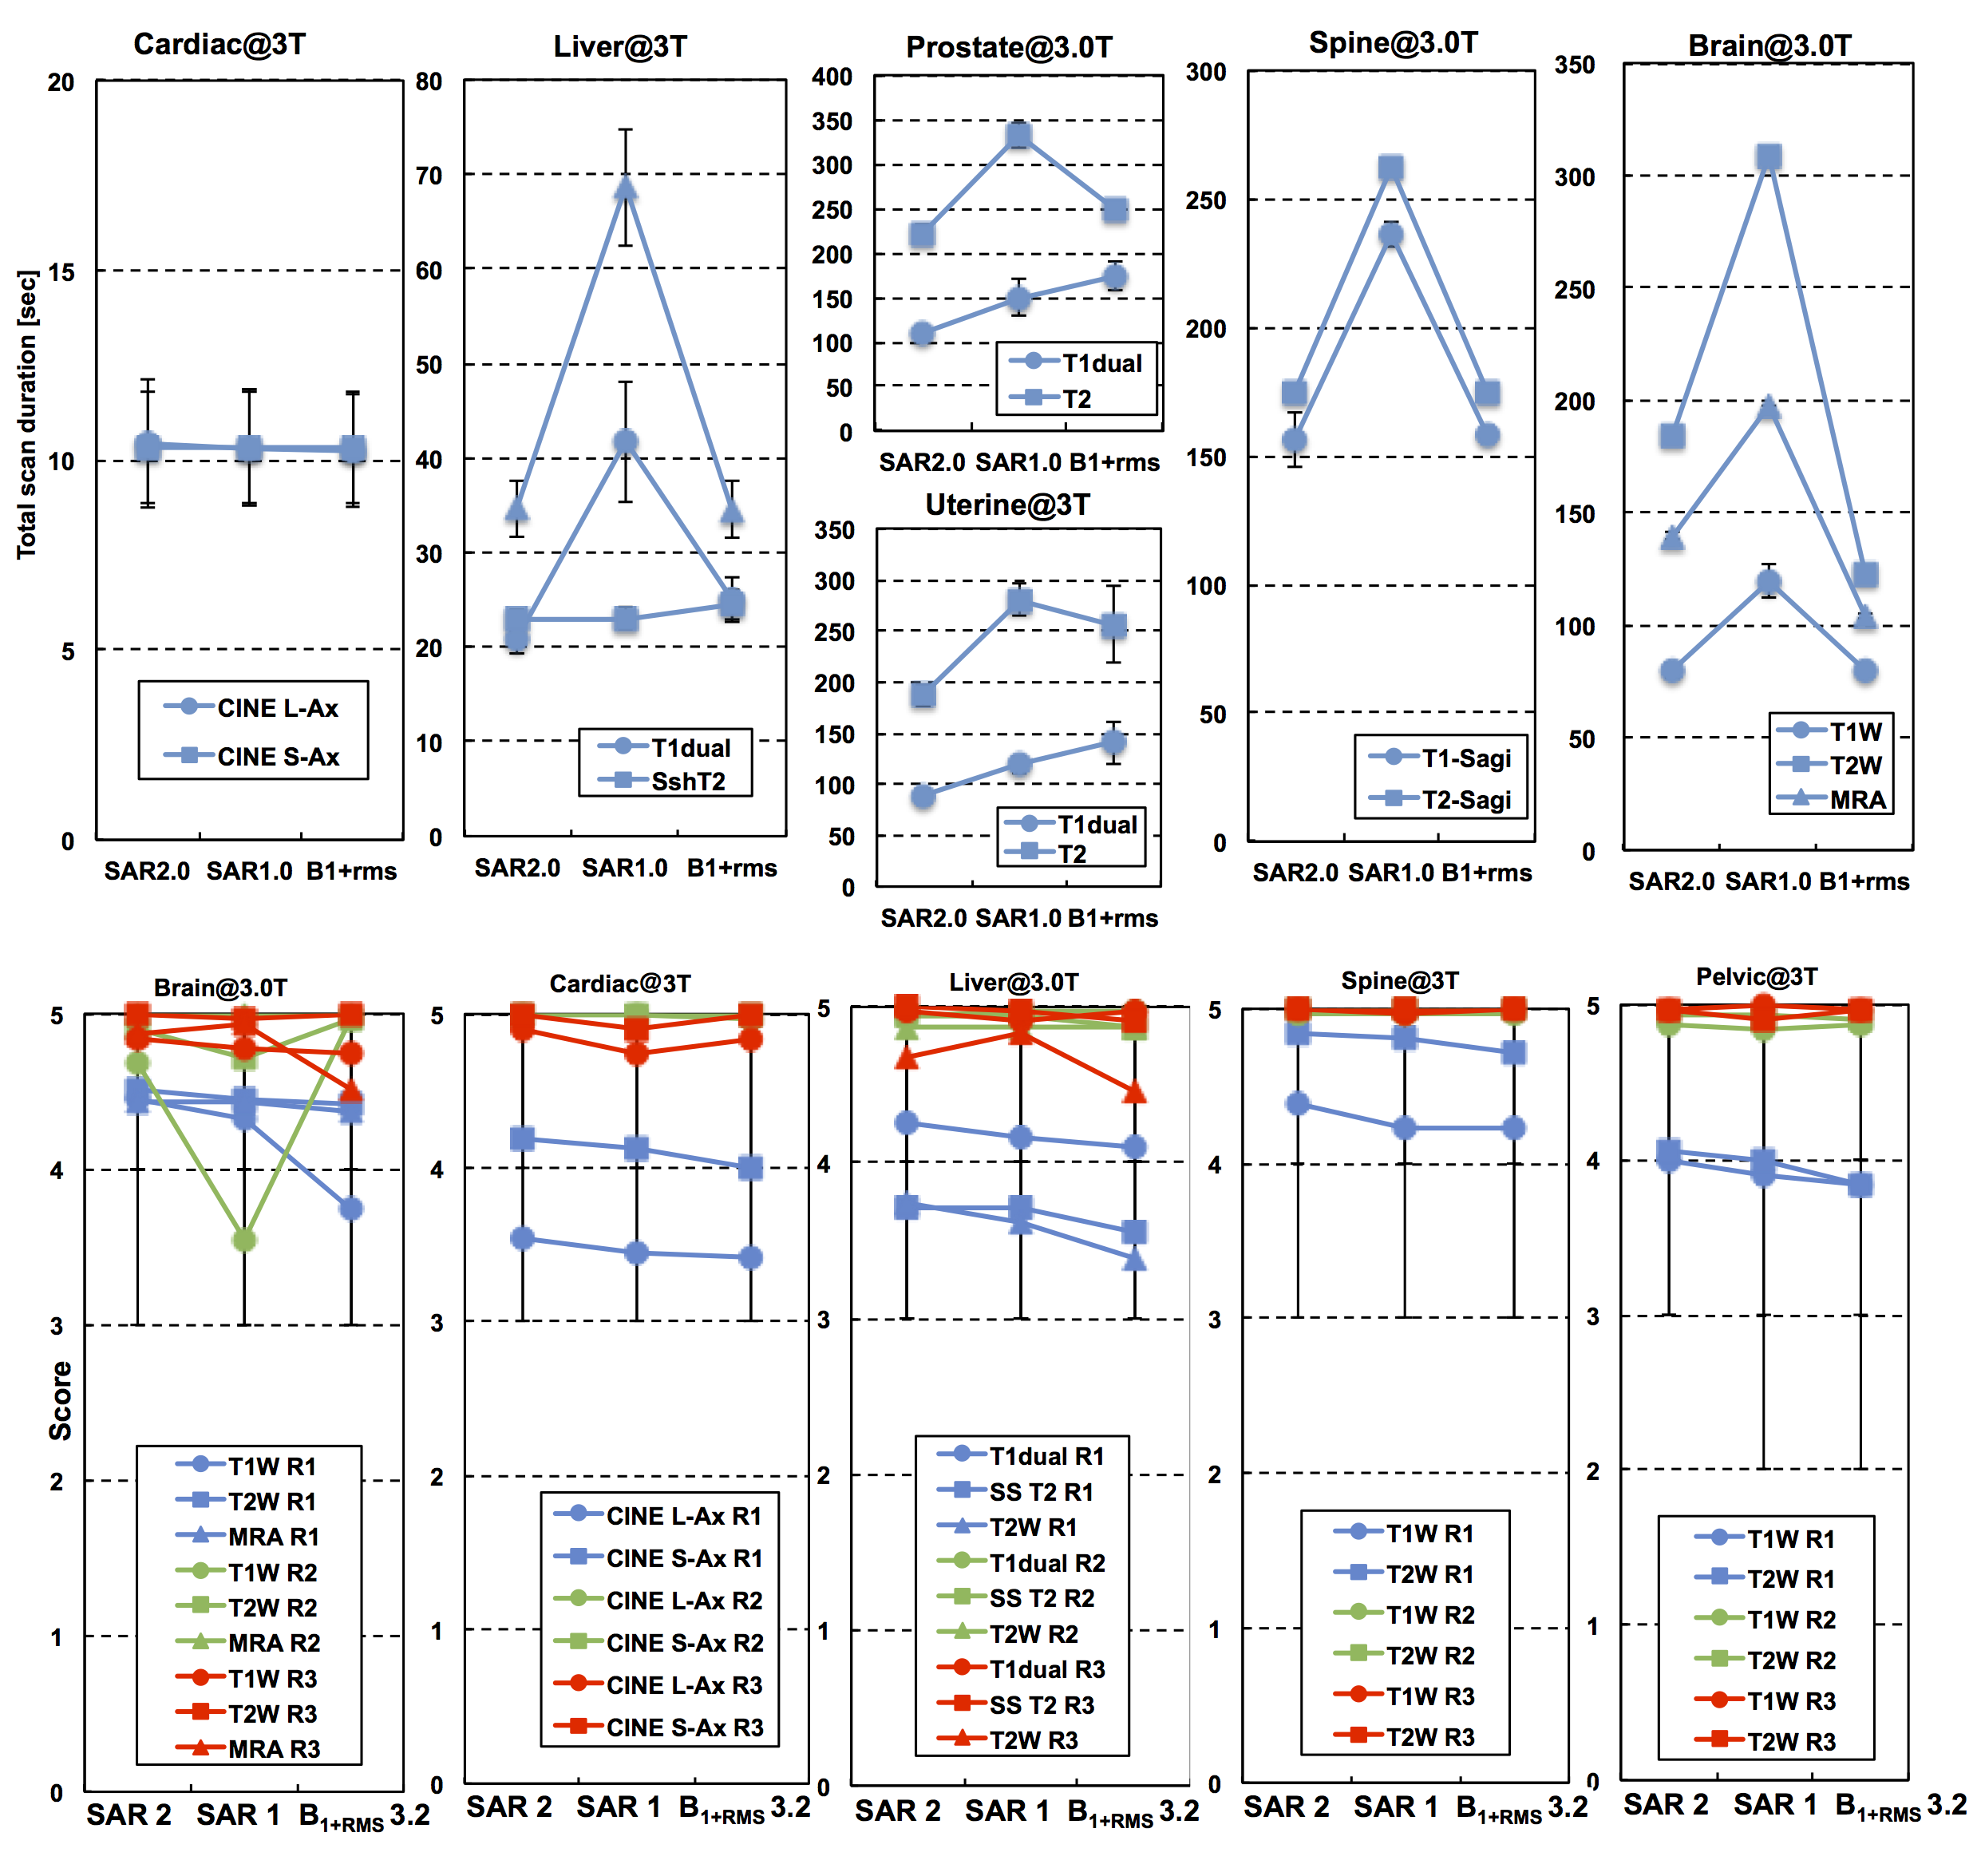
To compare actual SAR with console-displayed SAR and B1+RMS, calorimetry was performed in an ASTM phantom(1) placed in two different 1.5-T and in one 3-T clinical scanners. The imaging conditions were set to have a console-reported whole body averaged SAR (Console SAR) as 2.0 W/kg, 1.0 W/kg, or a console-displayed B1+RMS (Console B1+RMS) as 3.2 μT. Temperature measurement was performed along with the ASTM method(1) for 30 minutes during fast spin echo sequence of TR, 3275-4424 ms; TE, 63 ms; and ETL 7 or 14. Image qualities in various body regions were evaluated for 30 healthy volunteers (15 male and 15 females) at both 1.5T and 3T with the different SAR and B1+RMS settings. Routinely used imaging sequences and parameters were applied to the brain, cardiac, liver, lumber, and pelvic (uterine for female and prostate for male) regions. The scan durations and spatial coverage were maintained as similar as possible among the different console-SAR and console-B1+RMS settings. Quality of the image was assessed subjectively by three experienced radiologists.Results
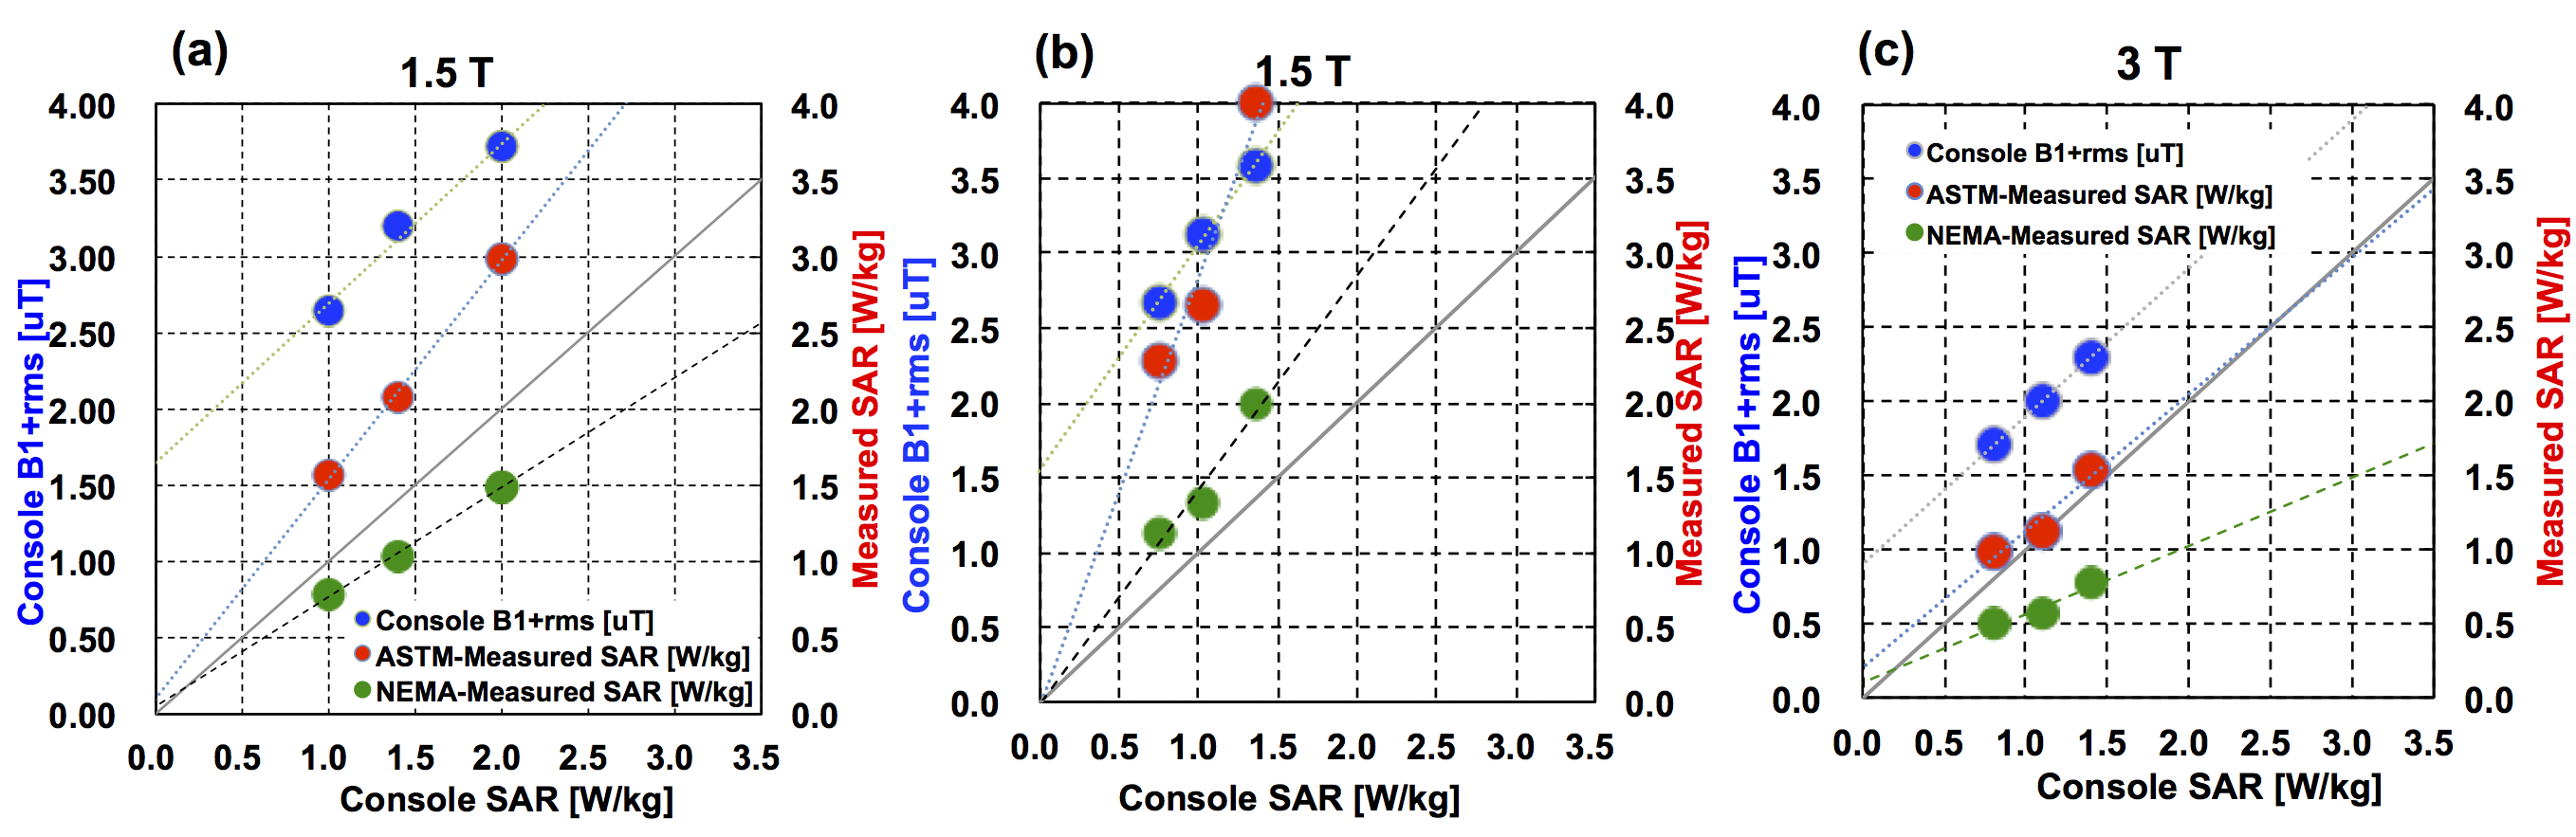
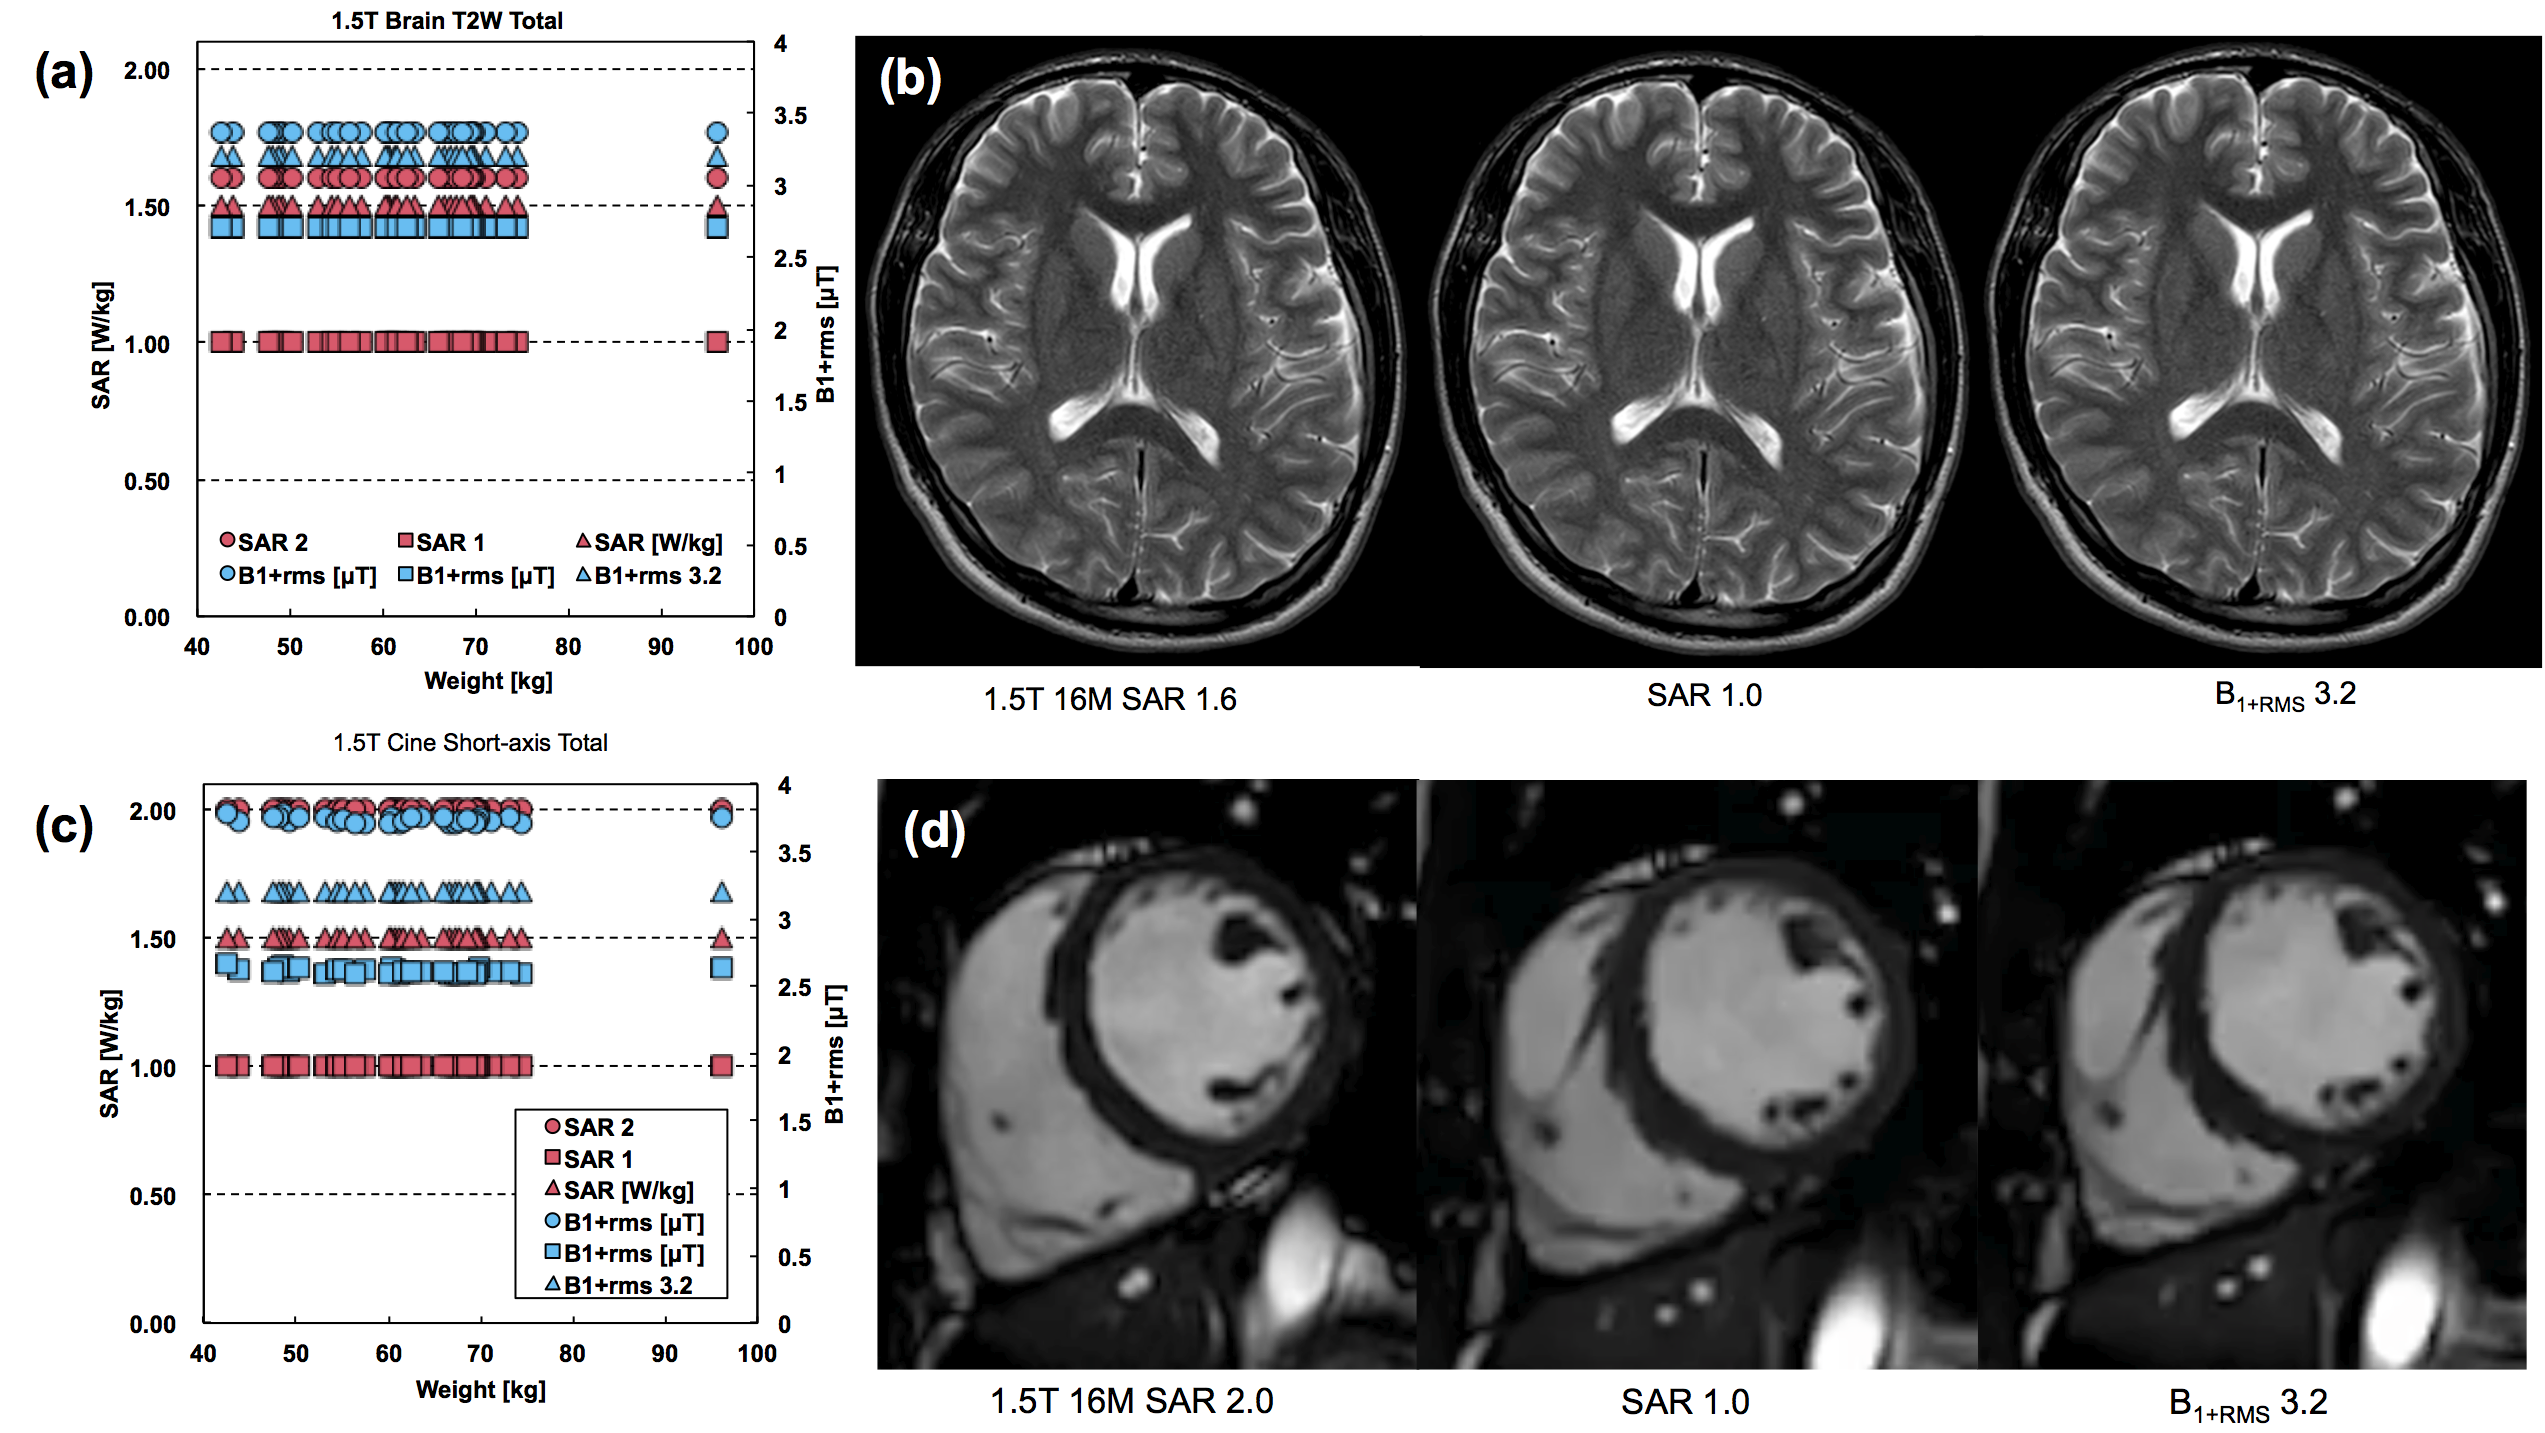
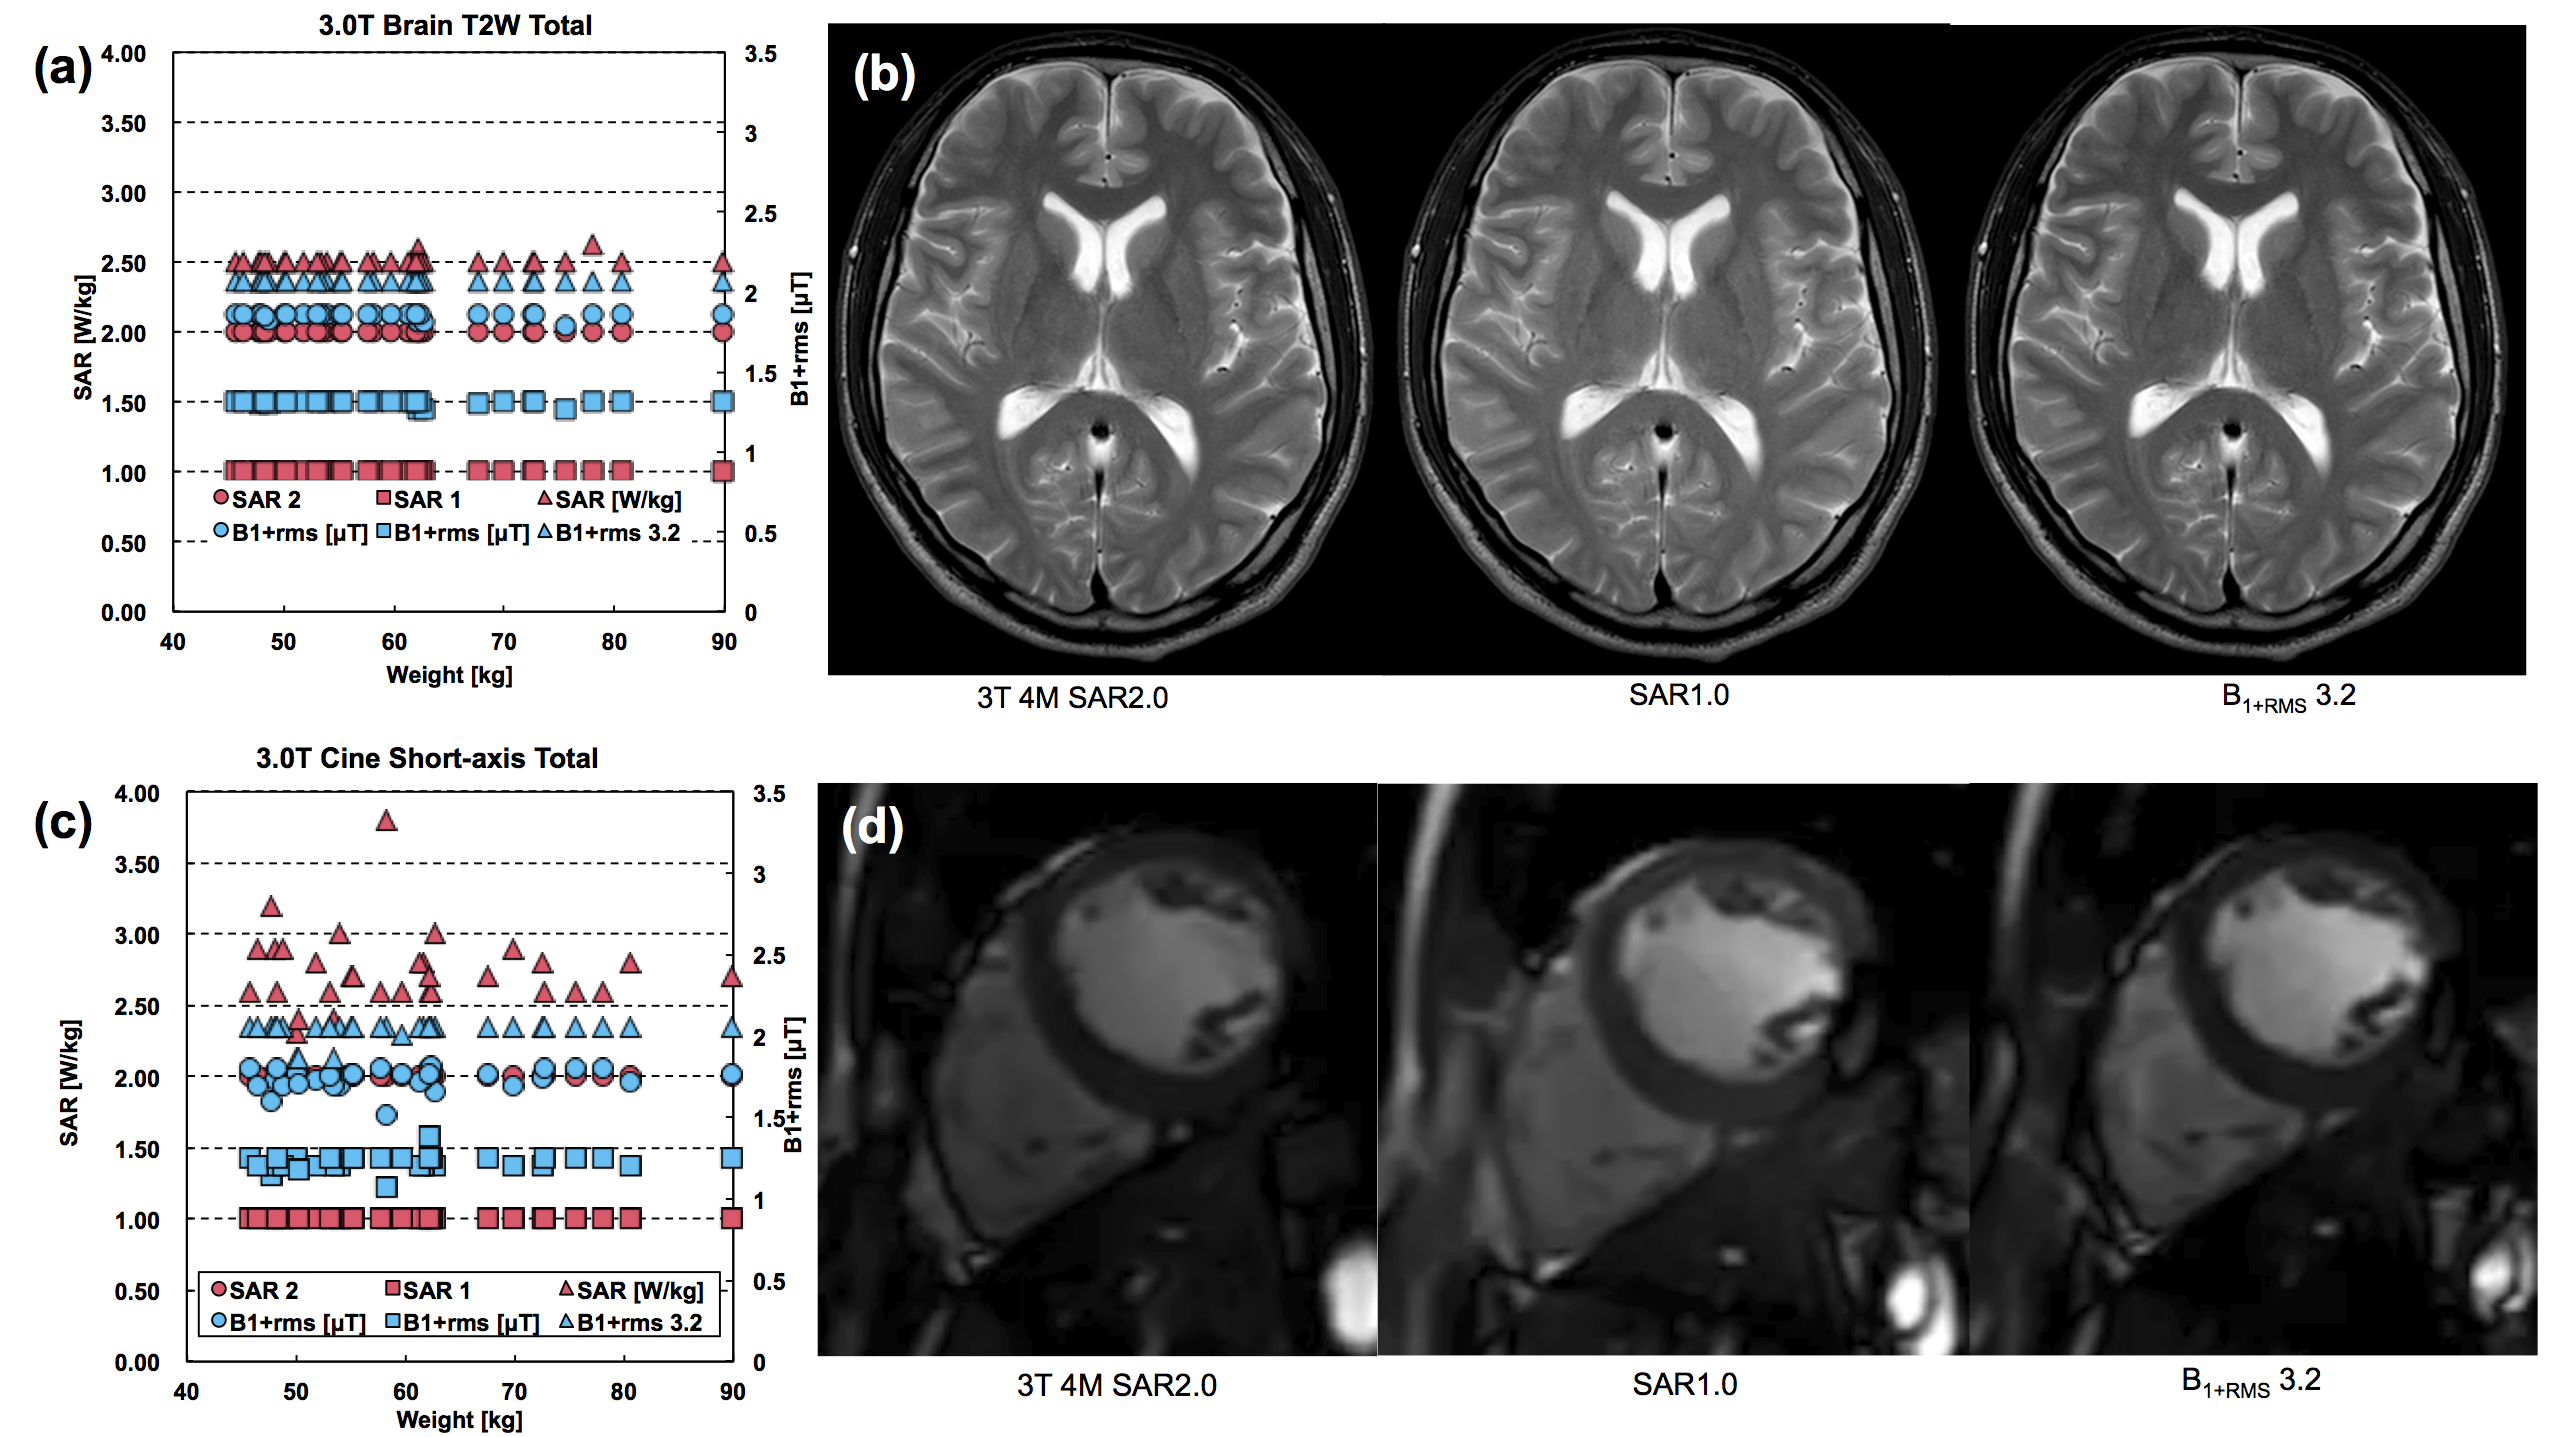
The measured SAR and console B1+RMS were plotted against console SAR in Fig. 1 based on the ASTM (1) and NEMA (2) strategies. In the ASTM strategy, the weight was given by the net phantom mass (25kg), while in the NEMA, the weight was given as the equivalent body mass (EBM) of 50-75kg(2) or 70-90 kg(3). In one 1.5T, the NEMA results exhibited the measured SAR smaller than the console SAR (a), meaning that the console SAR was conservative. However, in the other 1.5T, the measured SAR with the EBM was still higher than the console SAR (b). In the 3T, the measured SAR was lower than the console SAR even with the net phantom weight (c). The variation of the measured SAR with the identical EBM was of a factor of 2.3 among the three scanners. There was also a variation of a factor of 1.2 between the B1+RMS values at the two 1.5T. The console SAR and B1+RMS were constant for 30 volunteers at 1.5T as exampled in Fig. 2 (a) and (c). The resultant images are shown in Fig. 2(b) and (d). Image quality scored by the radiologists was similar for the different console settings, although individual difference among the radiologists was recognized in Fig. 3. Similar trend was observed in all the locations at 1.5T. At 3T, there were deviation in the console SAR and B1+RMS and recognizable image quality degradation due to lower SAR setting.
Discussion
The relationships between the console SAR and the measured SAR or console B1+RMS varied markedly with the scanners. In one 1.5T, the measured SAR was higher than the console SAR unless the EBM is assumed to be higher than 70 kg. Also the behaviors of B1+RMS were quite different among the three scanners used in this study. The results indicate that there are large variations in actual SAR and B1+RMS among different scanners, even when the consoles report identical SAR values.
The volunteer study at 1.5T exhibited that the console SAR and B1+RMS settings may not crucially affect on the image quality. This means that patients with implantable device with a low SAR limit may have similar quality of MR diagnosis. At 3T, degradation of the image quality was clearer than at 1.5T because of the inherent higher SAR property.
Conlusion
We should note that there is a large variation of the actual SAR even when the console SAR is the same, and that such variation appeared differently according to the equivalent body mass used by the manufacturers. Also, the subjective evaluation by the radiologists suggested that the image quality degradation due to the lower SAR setting was not critical at 1.5T in this particular study, but was so at 3T. Quantitative assessment of SNR and CNR for different SAR and B1+RMS has to be performed on the same data sets.
Acknowledgements
The present study was supported by Japanese Society for Magnetic Resonance in Medicine.References
(1)American Society for Testing and Materials (ASTM) . Standard Test Method for Measurement of Radio Frequency Induced Heating Near Passive Implants During Magnetic Resonance Imaging. 2011;F 2182-11a.
(2)National Electrical Manufacturers Association (NEMA). Characterization of the Specific Absorption Rate for Magnetic Resonance Imaging Systems. Standards Publication 2008;MS 8-2008.
(3)National Electrical Manufacturers Association (NEMA). Characterization of the Specific Absorption Rate for Magnetic Resonance Imaging Systems. Standards Publication 2016;MS 8-2016.
Figures