0637
Ketone measurement in human glioma following an Atkins-based diet1Russell H. Morgan Department of Radiology, Johns Hopkins University School of Medicine, Baltimore, MD, United States, 2F. M. Kirby Center for Functional Brain Imaging, Kennedy Krieger Institute, Baltimore, MD, United States, 3Department of Neurology, Johns Hopkins University School of Medicine, Baltimore, MD, United States, 4Department of Radiology, Wake Forest School of Medicine, Winston, NC, United States, 5Departments of Neurology and Oncology, Wake Forest School of Medicine, Winston, NC, United States
Synopsis
Recent studies have focused on the use of ketogenic diet (KD) in the treatment of glioma since tumor cells are heavily glucose-dependent. Here, we assess the ability of MRS to monitor KD-therapy in glioma patients. Using a semi-LASER sequence at 3 T, with fully simulated basis for spectral fitting, we measured increases in acetone and β-hydroxybutyrate after KD in tumor and contralateral brain. NAA concentration decreased in contralateral brain and there was an observed elevation of β-hydroxybutyrate in IDH-mutated gliomas; potentially indicating differential response to KD. These results indicate a potential for MRS in monitoring KD-based therapy in glioma.
Aim
To assess the potential for in vivo 1H-MRS measurement of ketone bodies: acetone (Ace), acetoacetate (AcAc) and β-hydroxybutyrate (bHB) in human glioma patients during ketogenic dietary therapy.Introduction
Metabolic therapy with a high-fat, low-carbohydrate ketogenic diet (KD) is a long-established method for the treatment of intractable epilepsy.1,2 Recently, KD has been proposed in cancers including glioma.3–5 Glucose-dependent tumor cells have an impaired ability to metabolize ketones, thus offering the potential for disruption of metabolism with KD.6,7 Glioma is also characterized by molecular subtypes,8 which may respond differentially to KD. The ability to monitor cerebral ketone levels is therefore desirable for assessment of KD efficacy. 1H-MRS of ketones has been demonstrated in epilepsy patients following KD 9,10, diabetic ketoacidosis 11,12 and fasting.13 Artzi et al. recently measured increases in Ace after KD in glioma, however did not report bHB.14 Detection of the bHB doublet (1.20 ppm) is complicated by lipid overlap and chemical shift, and singlets of Ace (2.22 ppm) and AcAc (2.27 ppm) are difficult to resolve. This study used the semi-LASER 15,16 MRS sequence at 3 T to assess ketone detection in vivo in glioma patients following a KD-like diet, and compared measurements to clinical characteristics.Methods
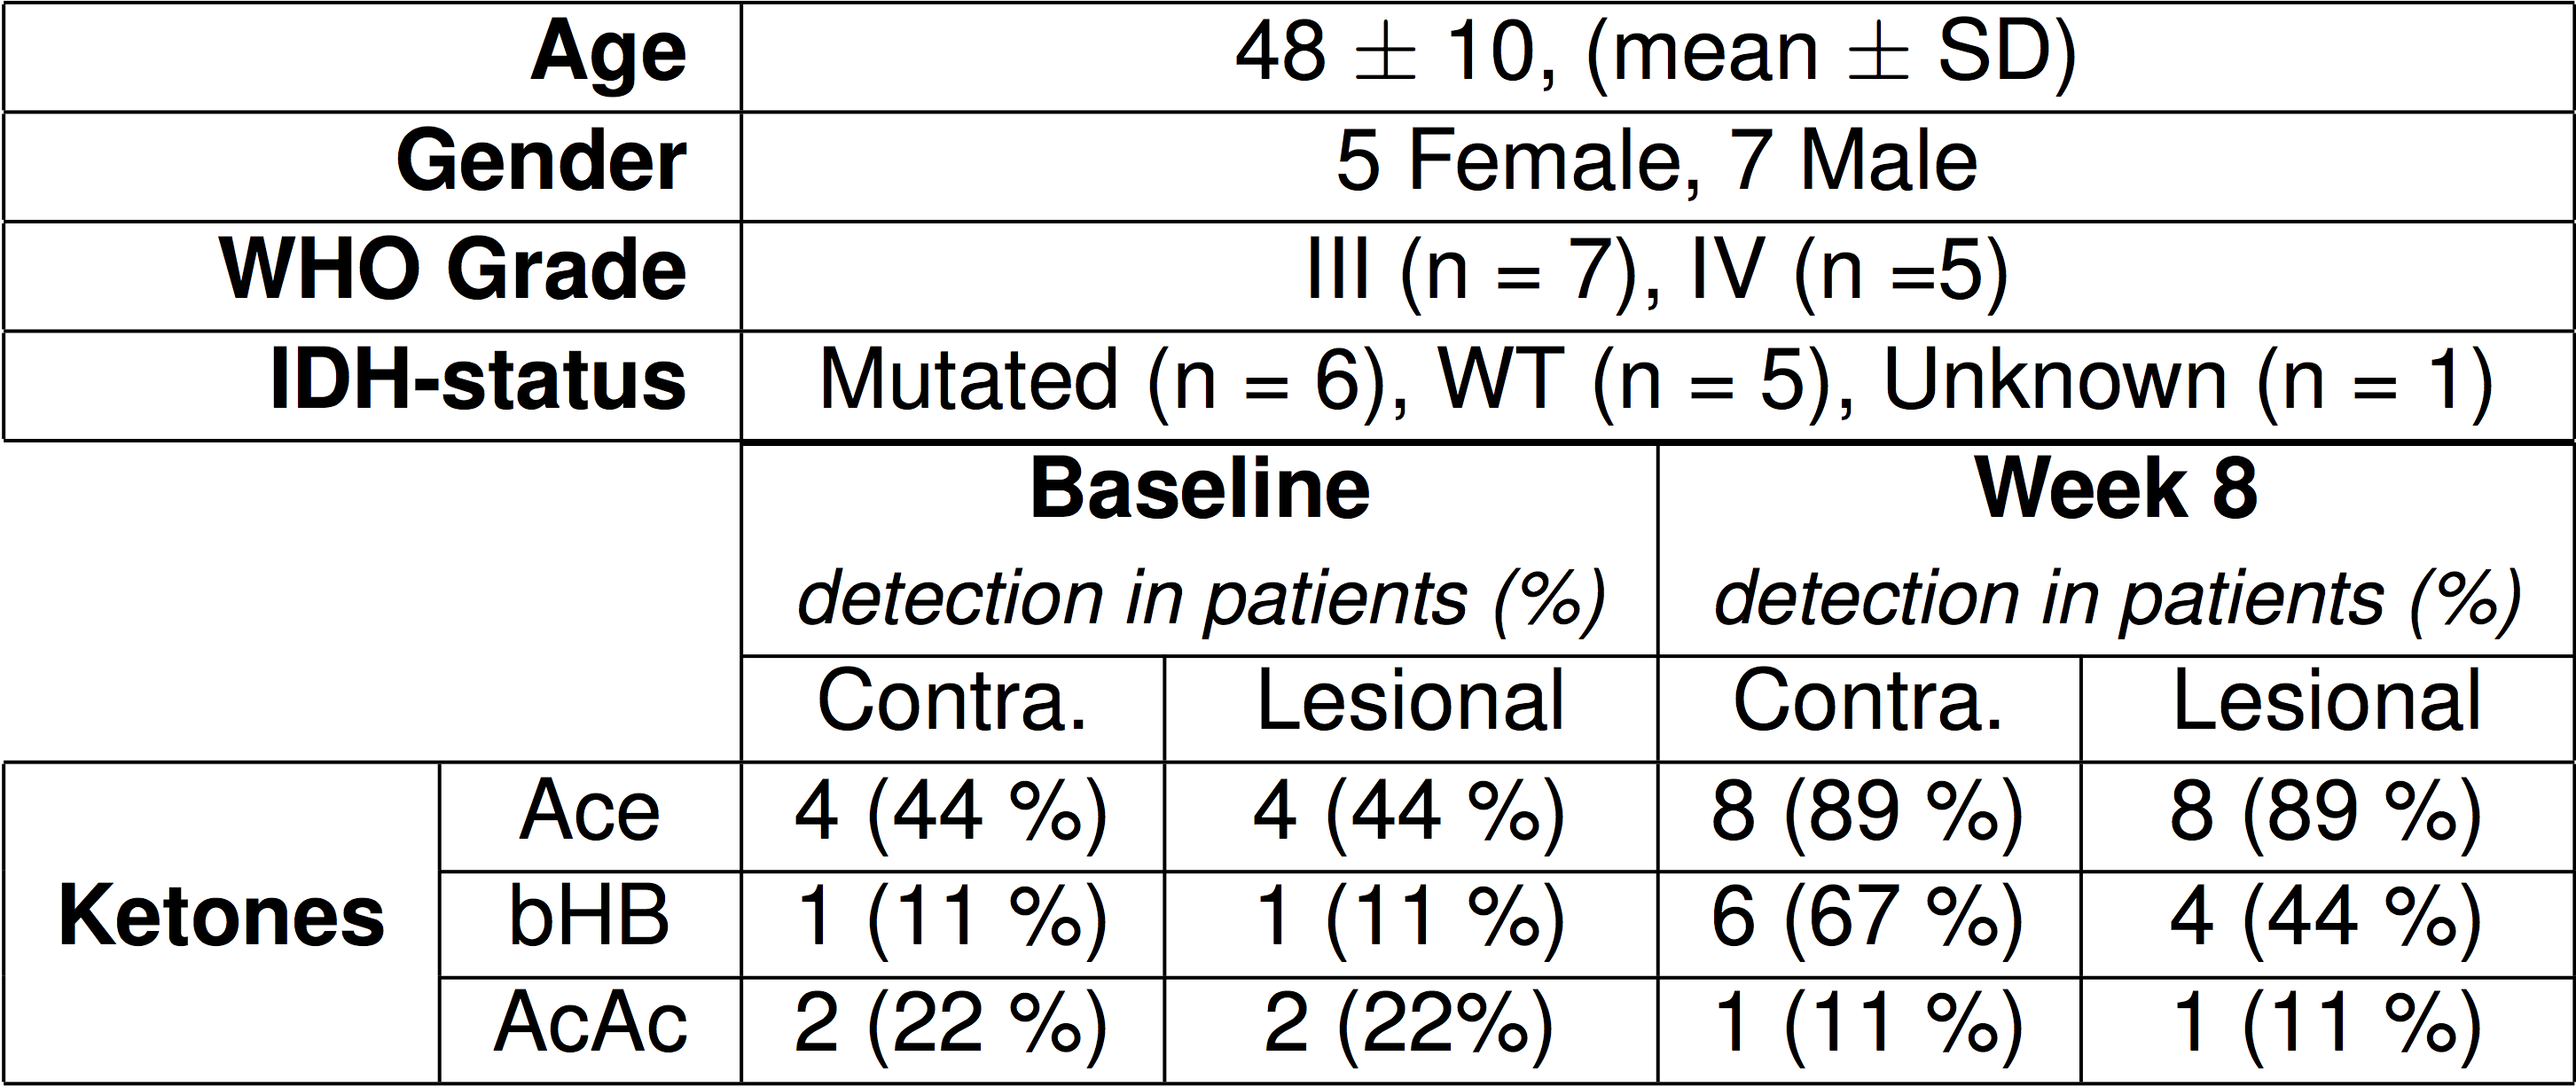
The 8-week GLAD diet consisted of caloric restriction (2 days: 20% recommended allowance) followed by a modified-Atkins diet (5 days: 20 g carbohydrate restriction). Patients were scanned at the beginning and end of the diet on a 3 T Philips Achieva MR system with 32-channel head coil. Spectra were acquired from two 2x2x2 cm3 voxels placed in the lesion and contralateral brain. 12 glioma patients (Fig. 1) were recruited; three patients were excluded from the analysis (2 failed to complete, 1 measurement error). MRS was performed using semi-LASER localization (TE/TR = 34 ms / 2.2 s, NT = 128, samples = 1024, SW = 2 kHz, refocusing: duration = 4.4 ms, bandwidth = 3 kHz). The ‘LCModel’ program17 was used to fit spectra, with fully-localized simulated basis sets containing 21 metabolites and 3 ketone bodies (Ace, AcAc and bHB) generated using real refocusing pulse information (Matlab, Mathworks Inc). Concentrations were estimated relative to an internal water reference. Metabolite fits with Cramér-Rao lower bound (CRLB) ≤ 80% were considered detected. Differences were assessed with a two-tailed paired t-test at 5% significance threshold.Results
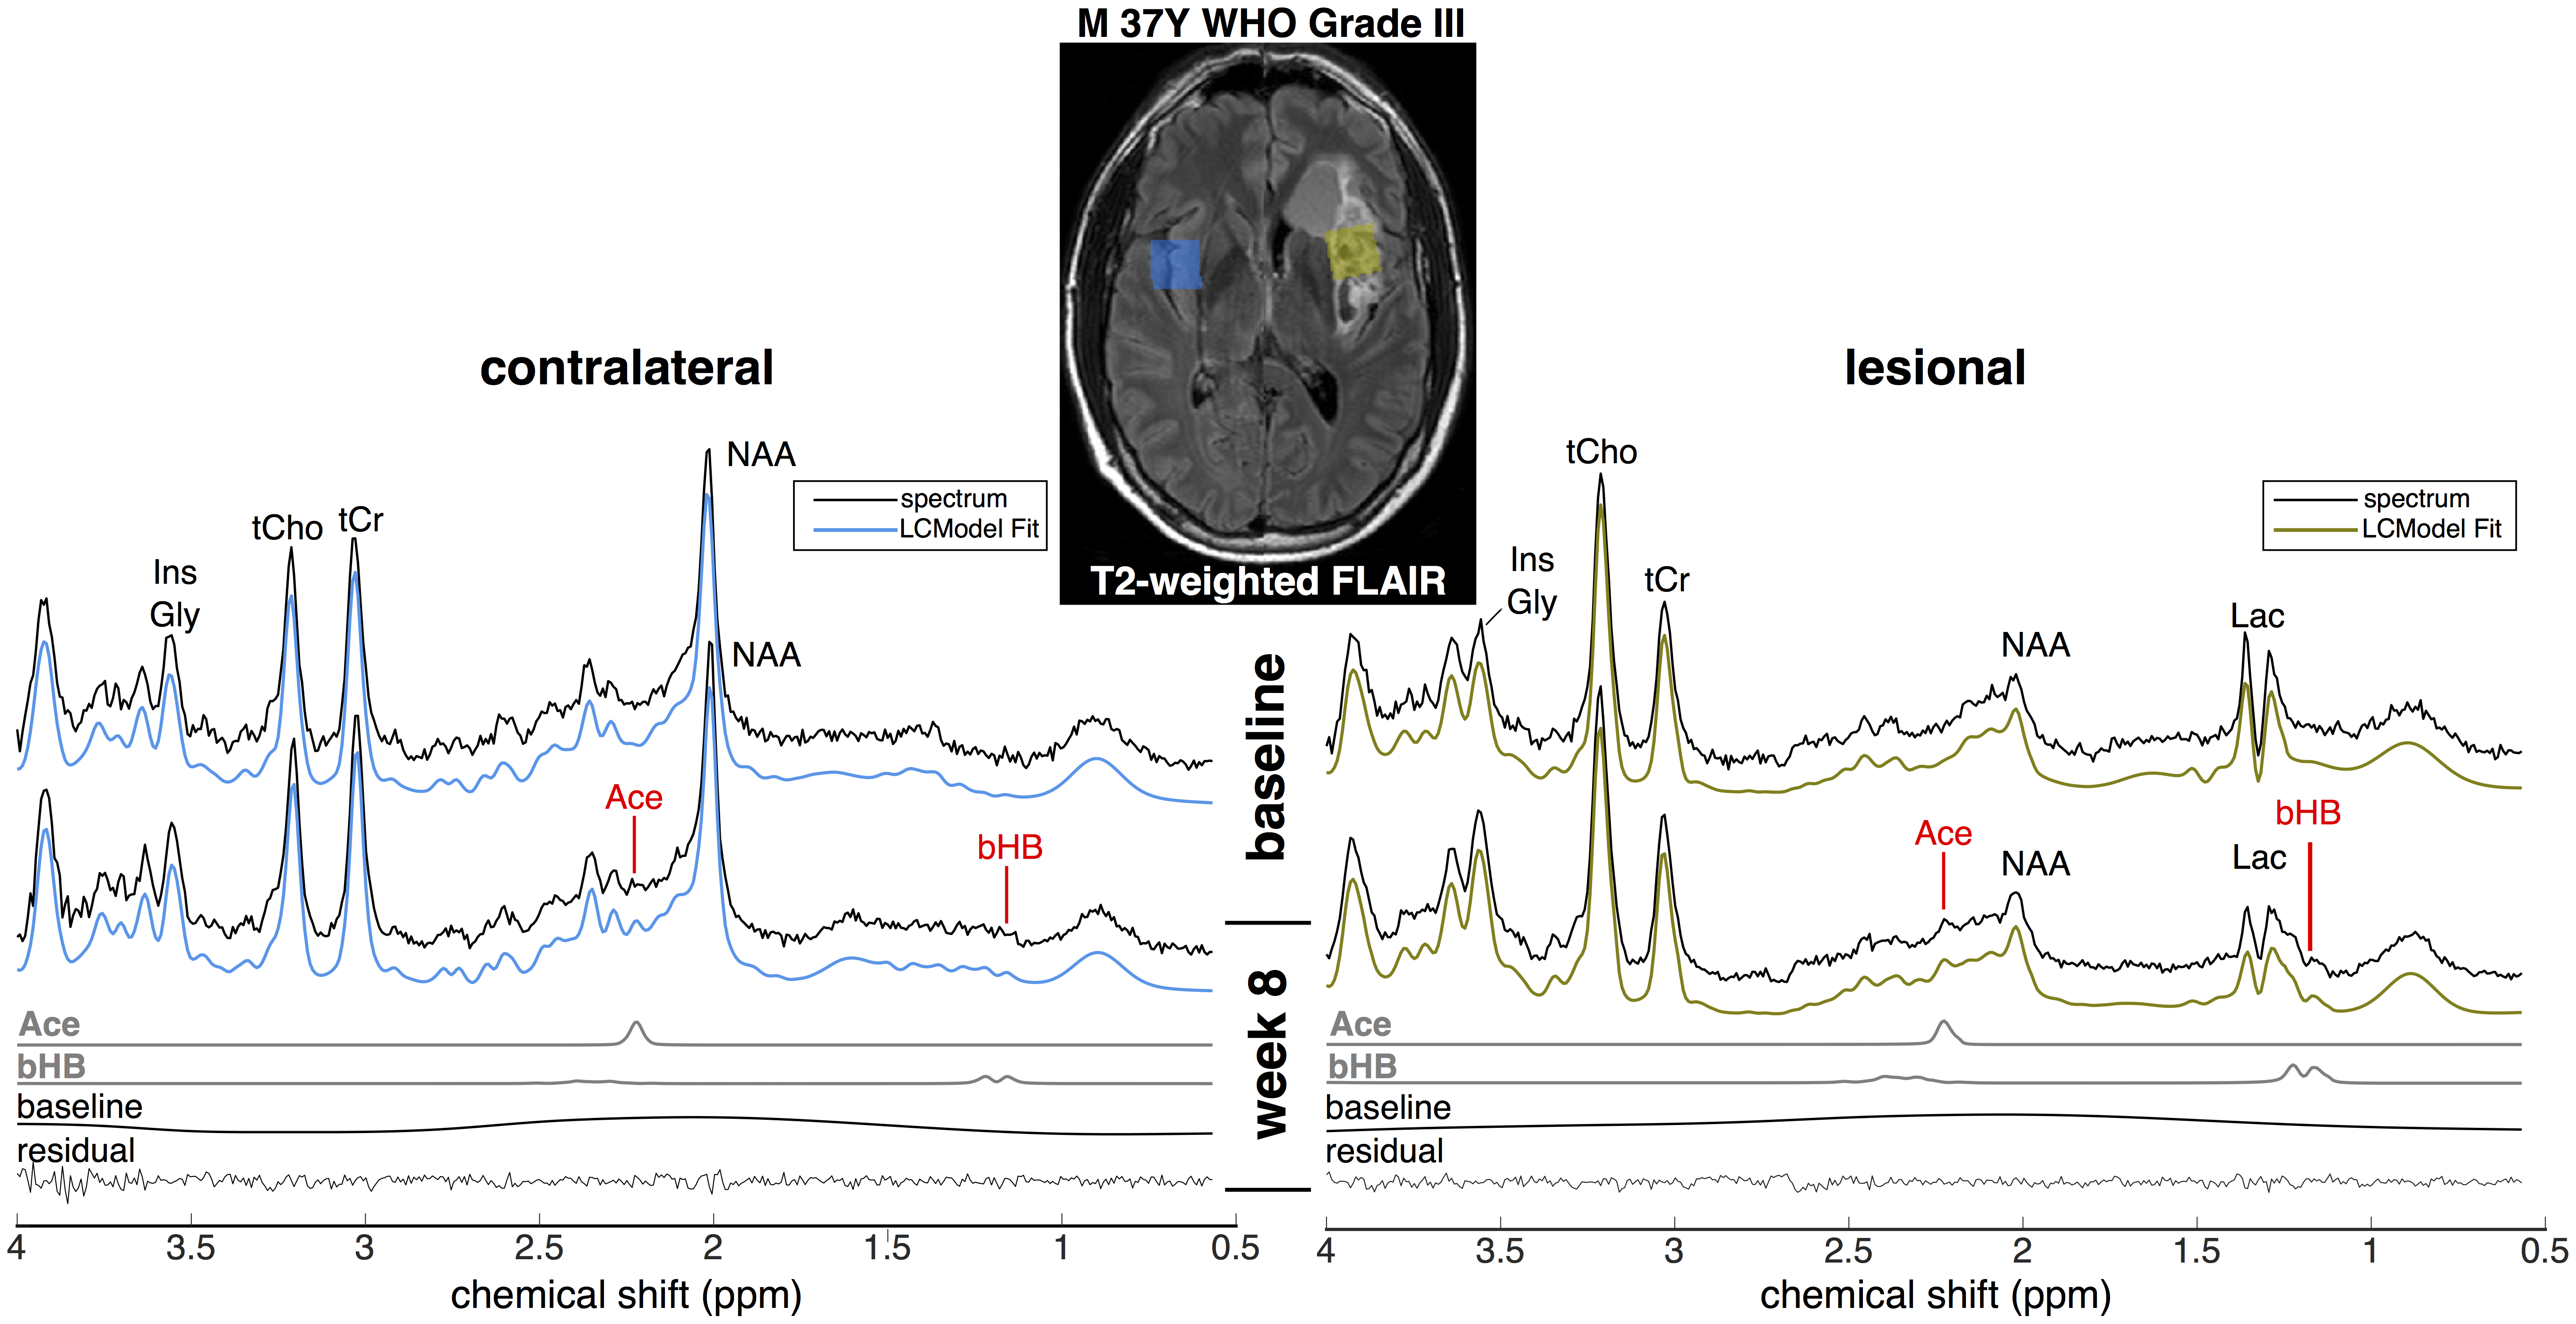
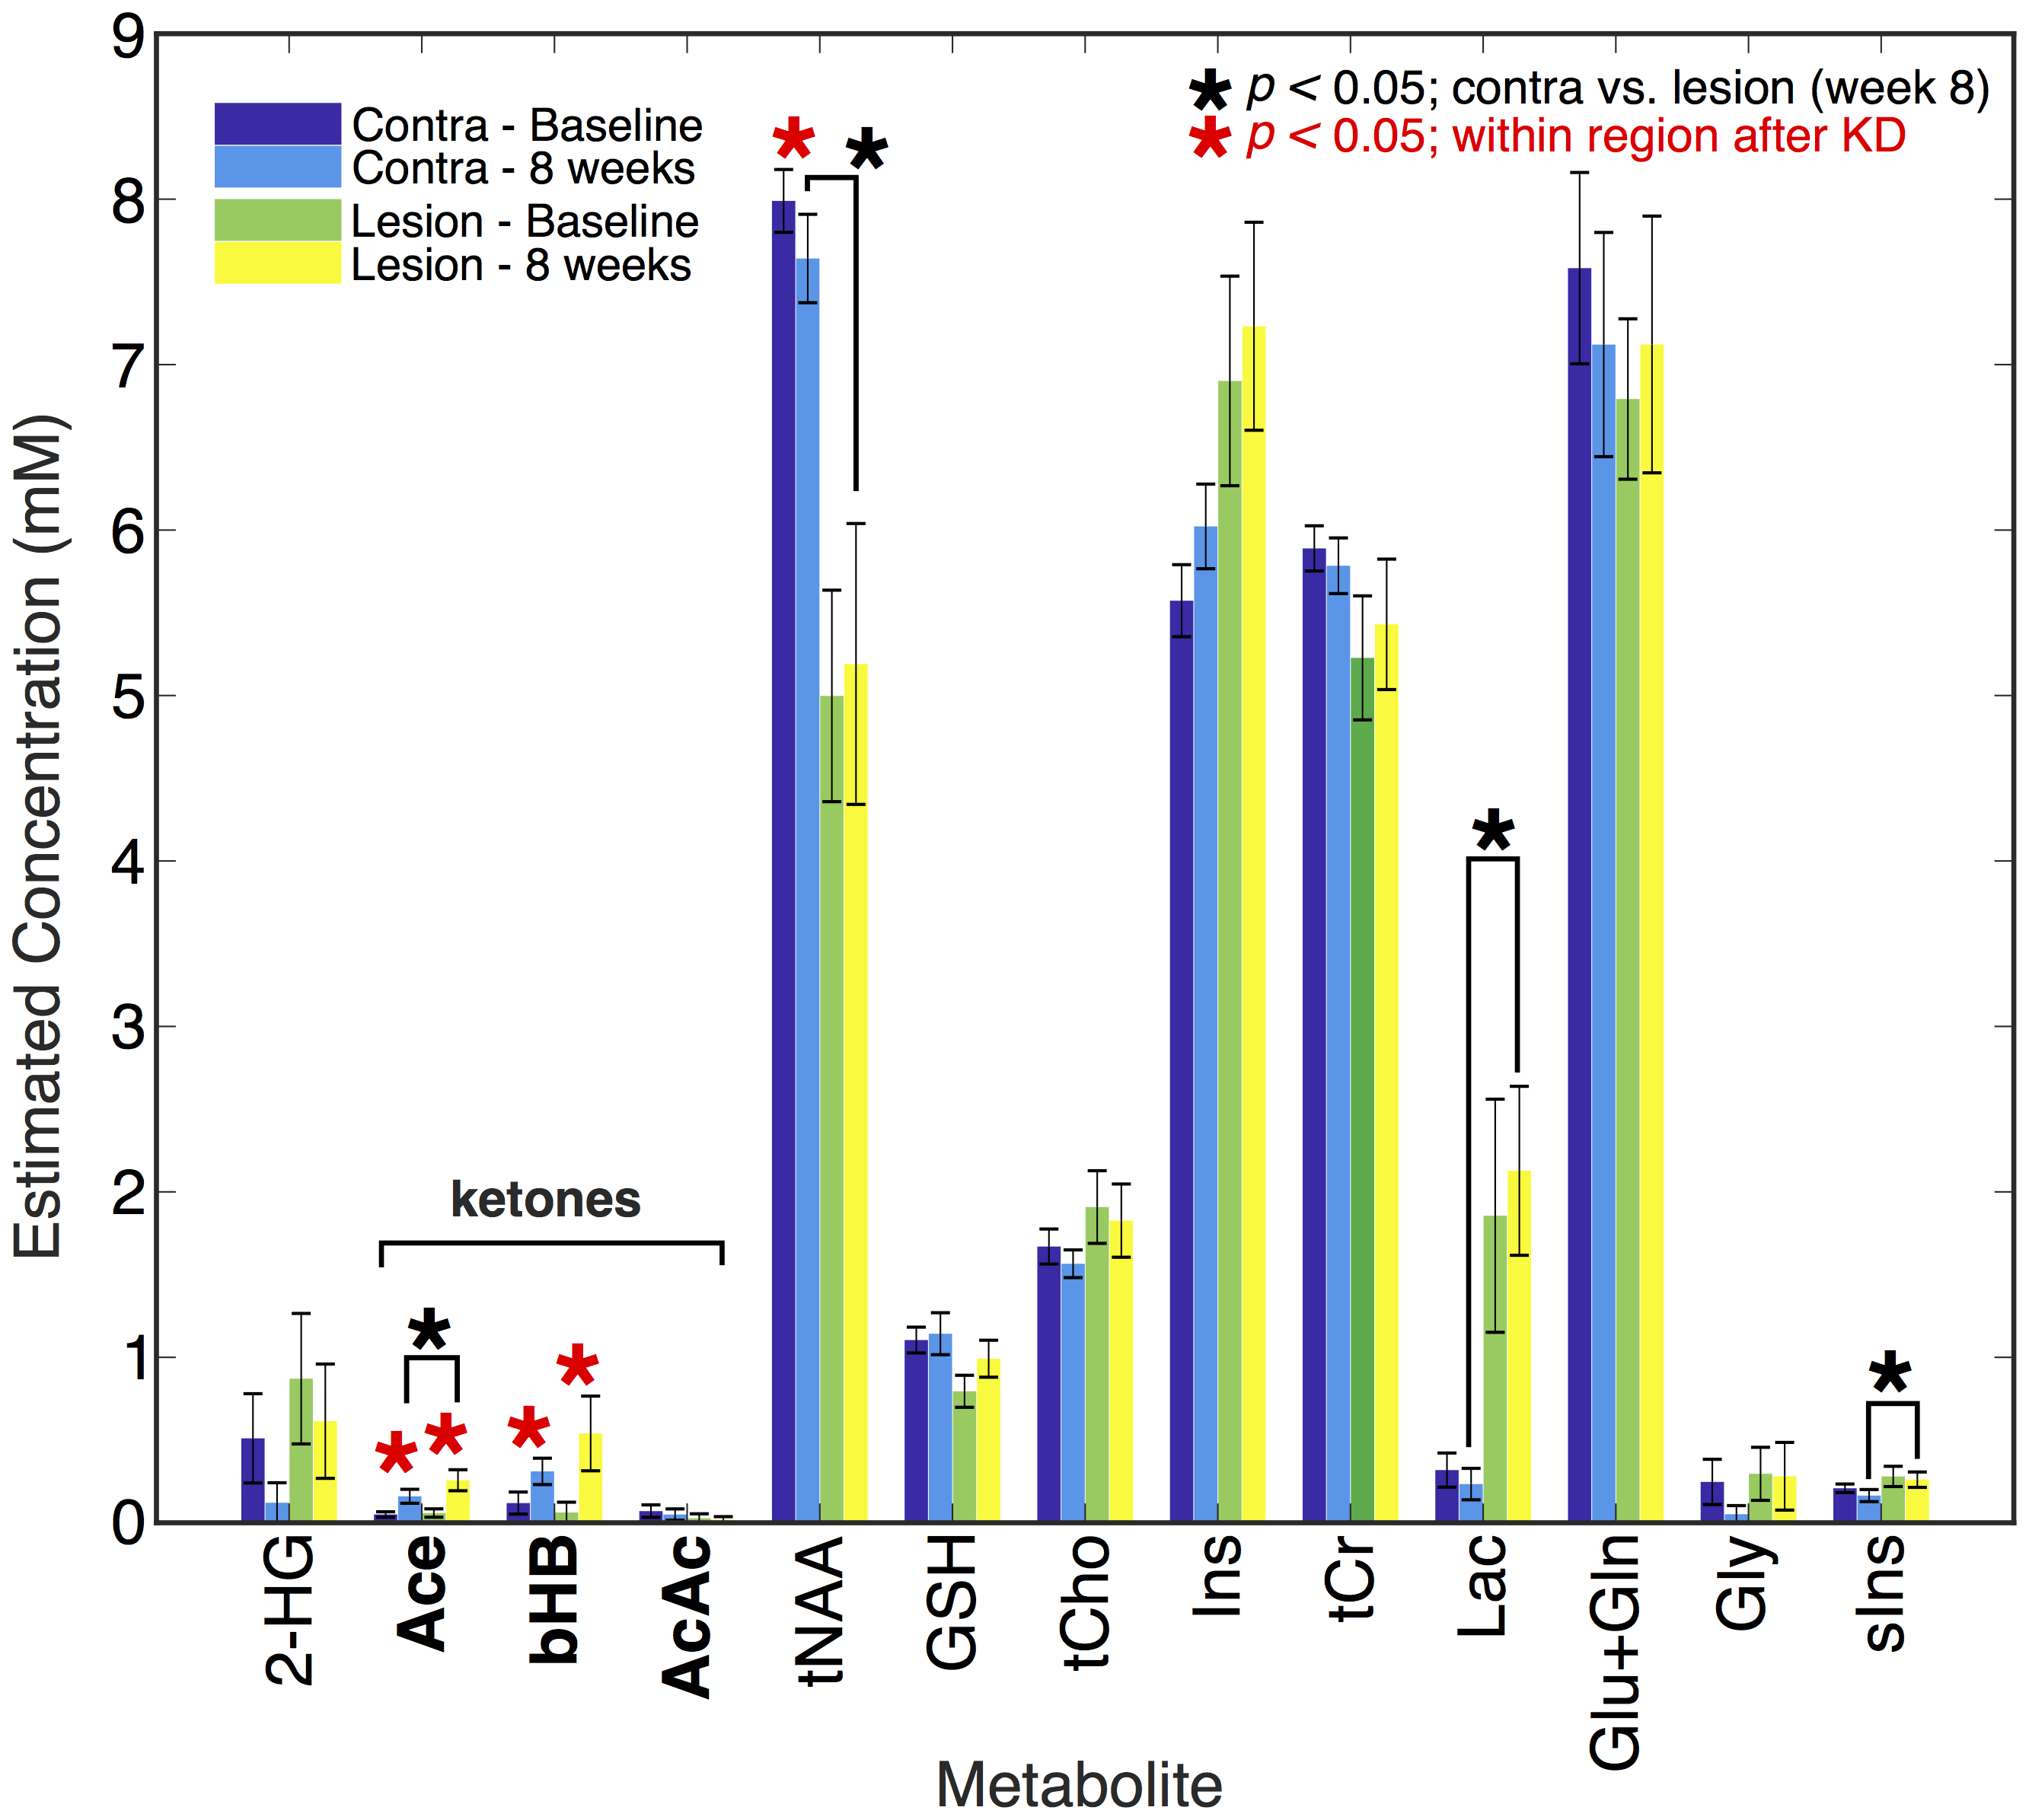
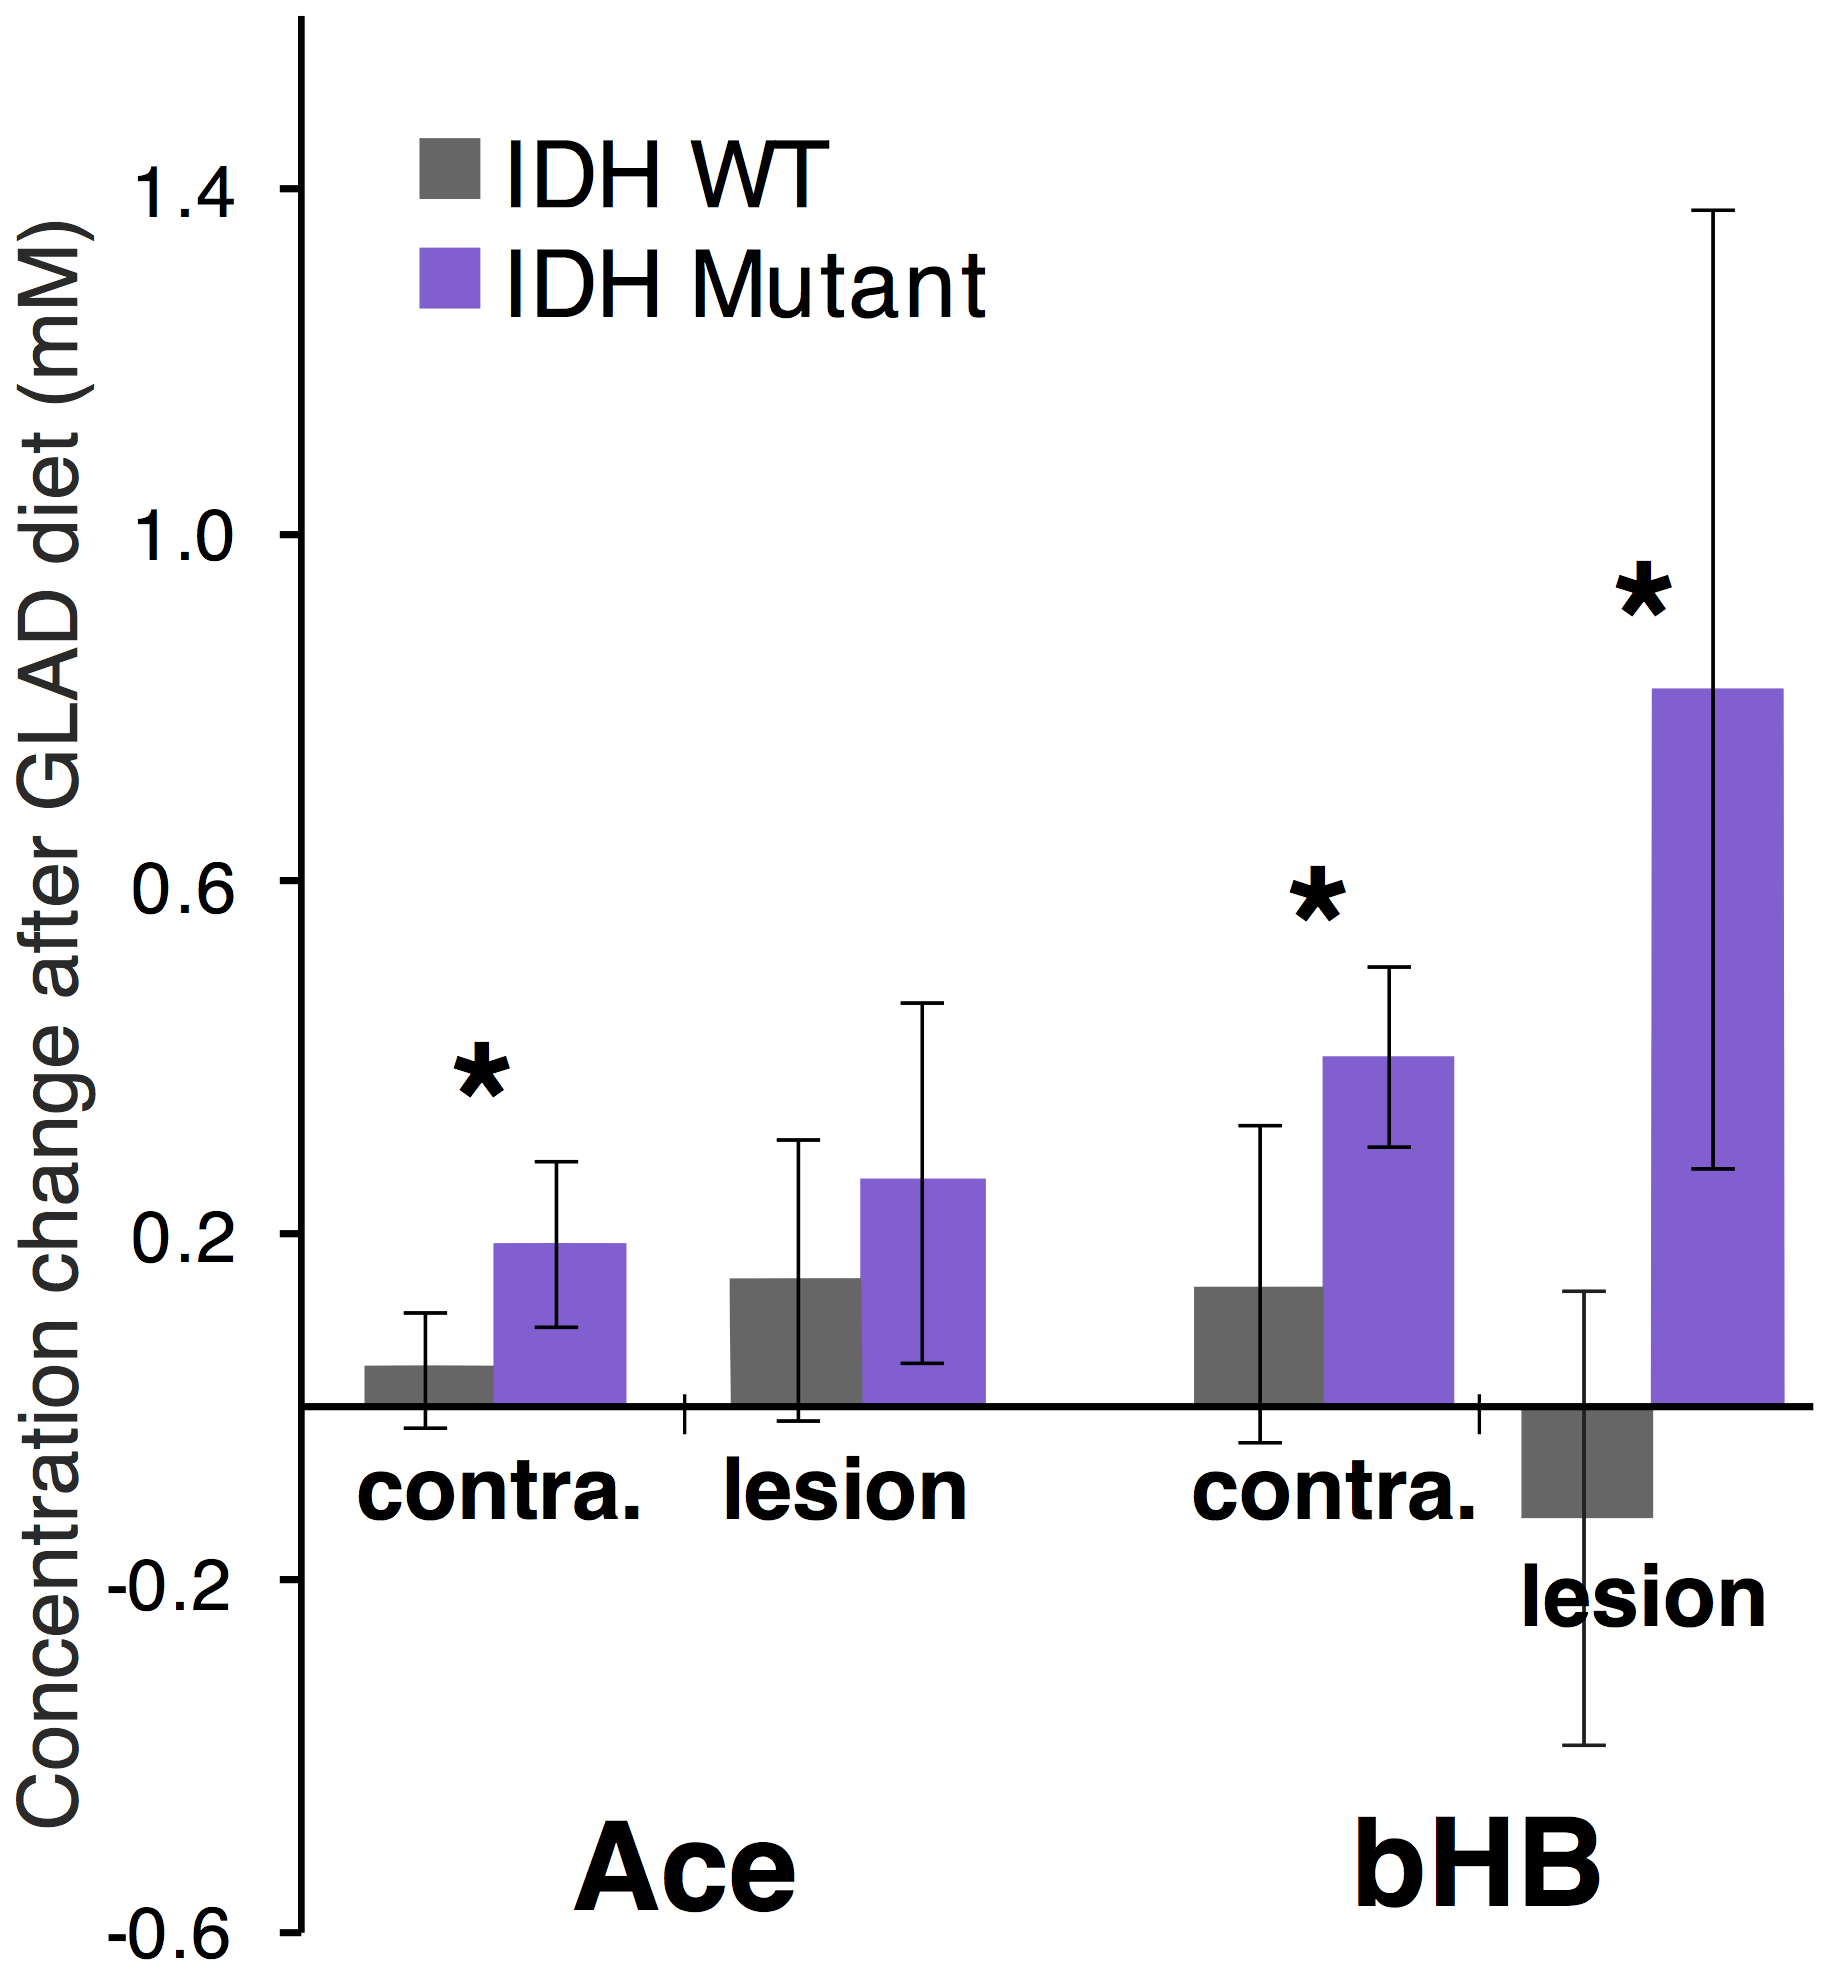
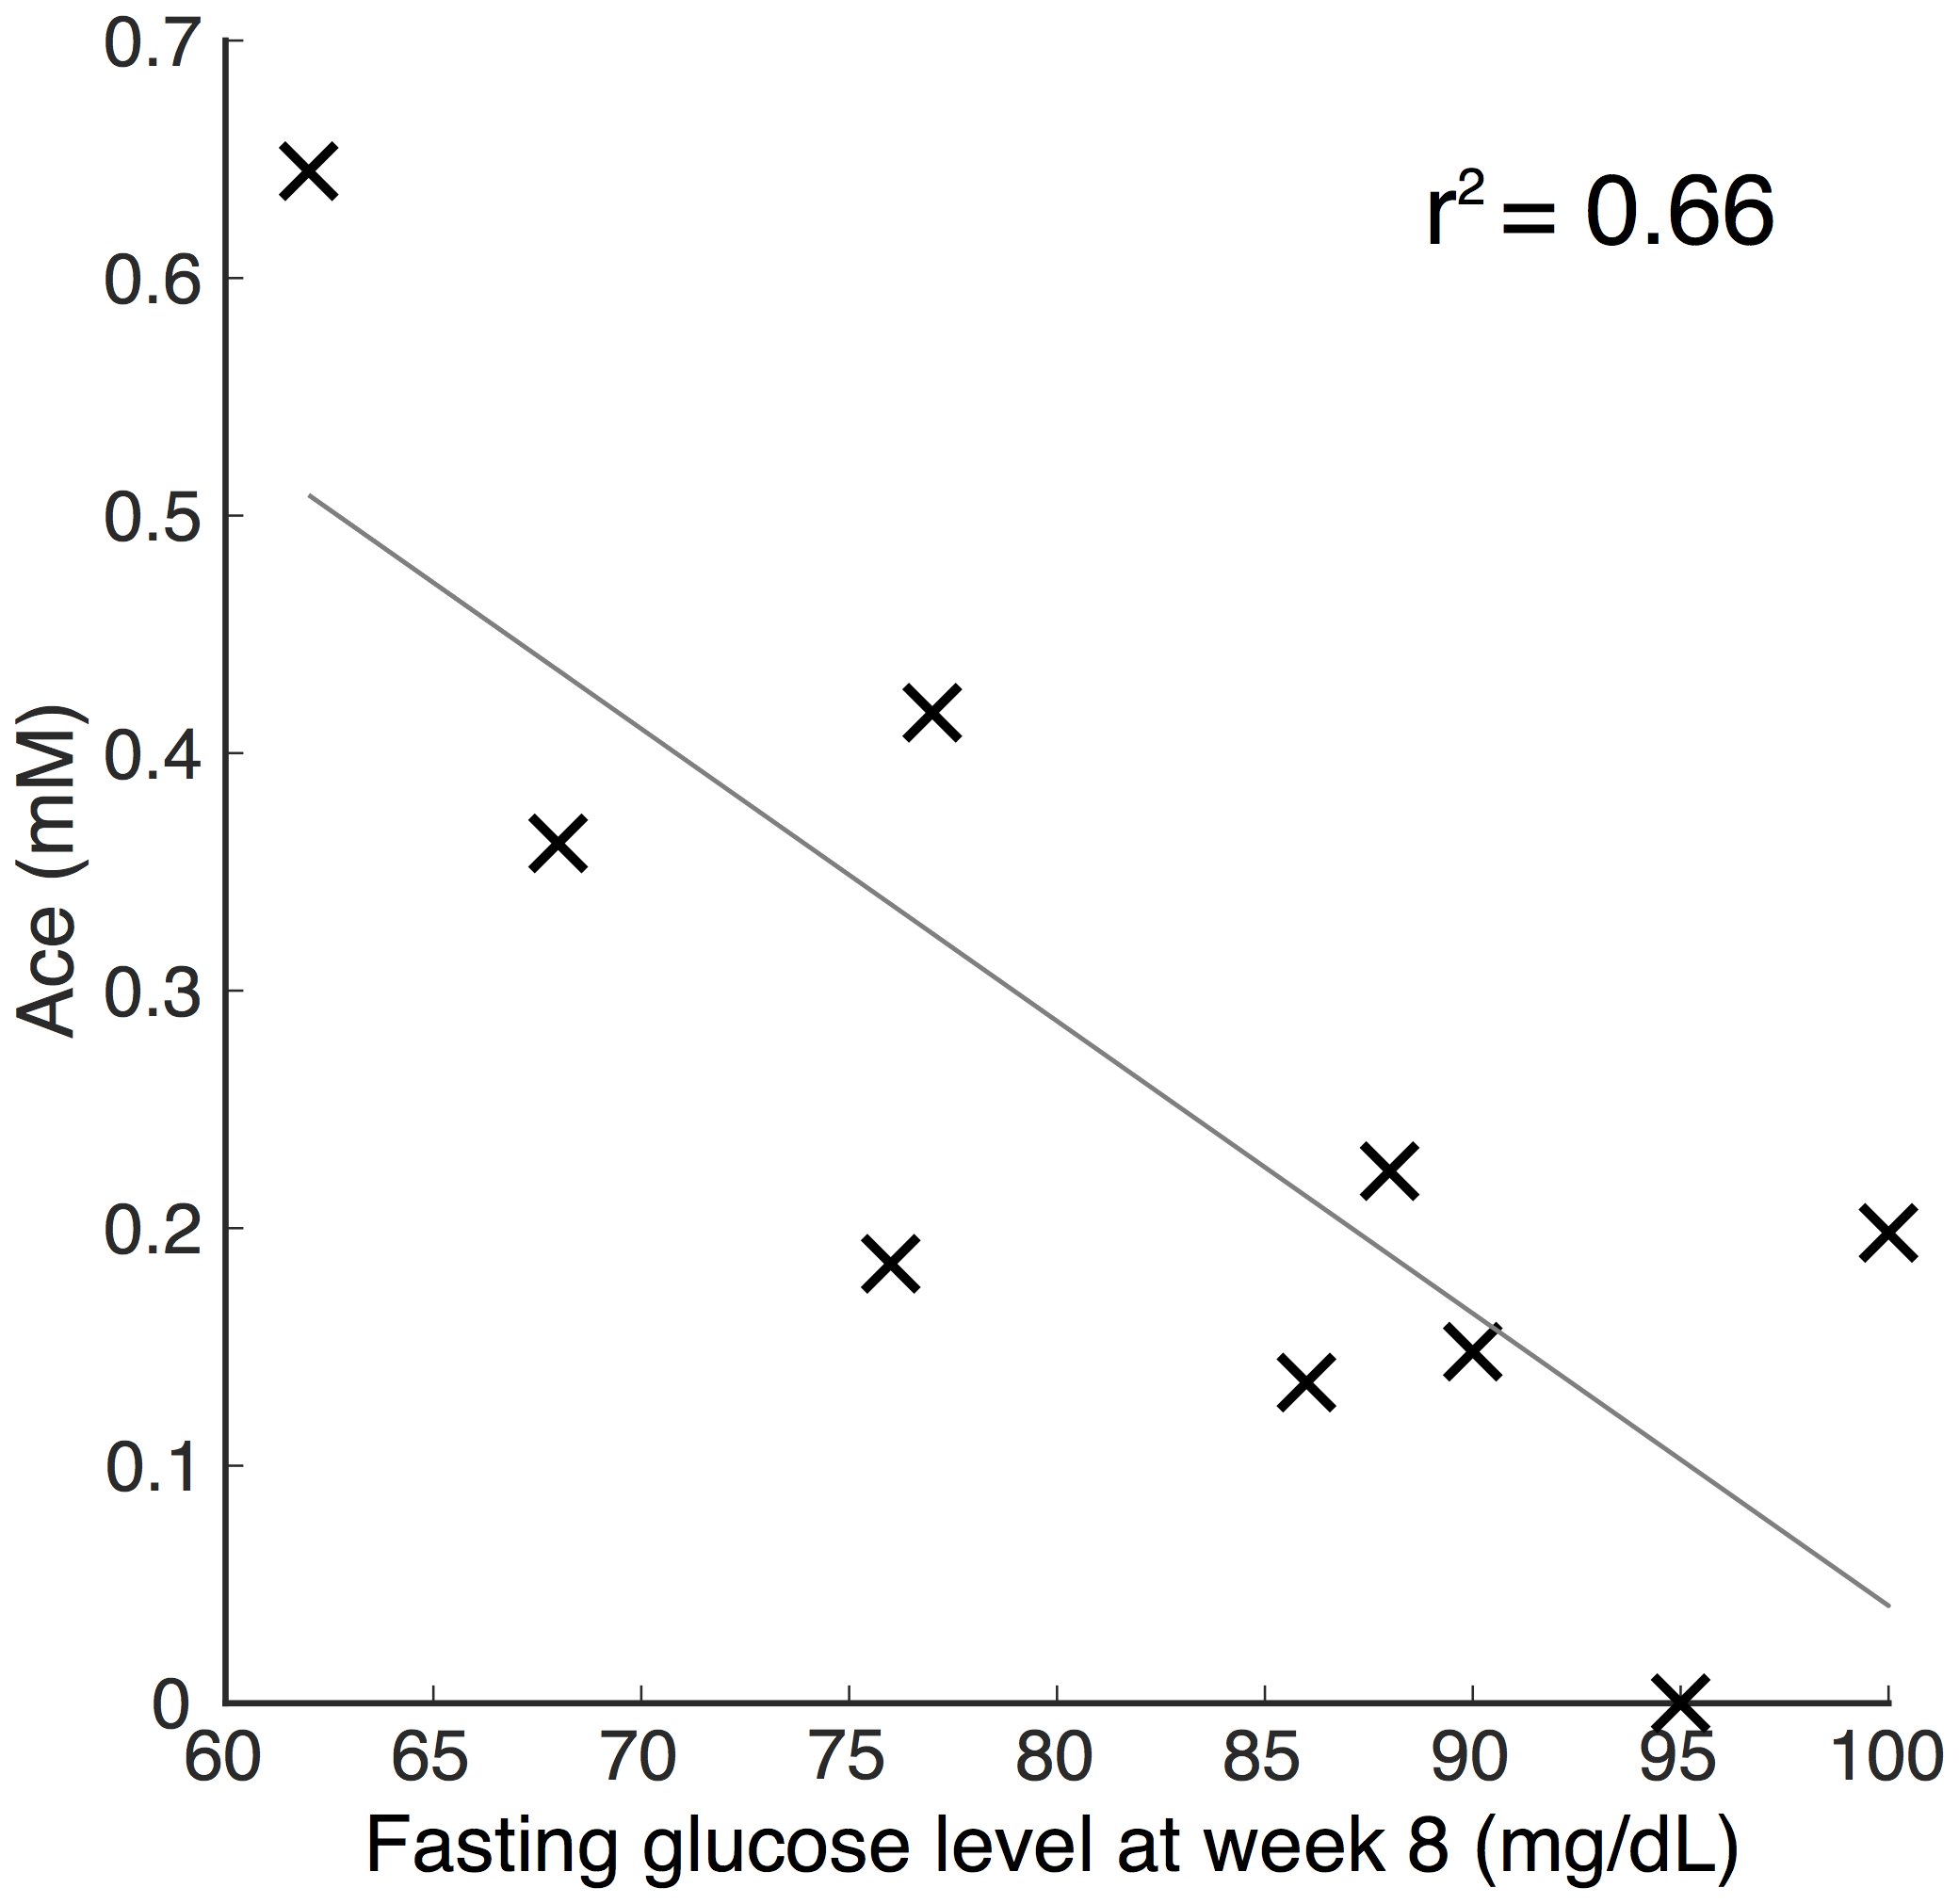
High quality spectra were acquired in all patients with minimal contamination. Systemic ketosis was achieved in eight patients (89%) during diet. Fig. 2 shows representative spectra from one patient; Ace and bHB resonances appeared in lesion and contralateral spectra at week 8 indicating measurable cerebral ketosis. Across all patients (Fig. 3), ketone levels increased significantly in lesional (Ace: 0.19±0.17 mM, p=0.012 and bHB: 0.46±0.6 mM, p=0.046) and contralateral brain regions (Ace: 0.12±0.10 mM, p=0.009 and bHB: 0.27±0.23 mM, p=0.007). Mean CRLBs after KD in tumor were 29% for Ace and 34% for bHB. In contralateral and lesional regions, bHB was largely undetectable at baseline (n=1), however, was detected after diet in 6 and 4 patients, respectively. Similarly, Ace was detected in almost all patients after diet (n=8 contra and lesion), yet AcAc remained undetected in the majority of spectra. Total NAA (tNAA) was found to decrease in contralateral brain (p=0.026). Interestingly, we found an elevation of bHB in tumor in patients with IDH-mutation (Fig. 3), which was different from IDH-wildtype (p=0.02) and also occurred in the contralateral region. Fasting blood glucose level was found to negatively correlate to Ace after KD (r2=0.66) (Fig. 4).Discussion/Conclusion
This study demonstrates that longitudinal monitoring of ketones is possible in glioma patients following KD. Measured cerebral ketone concentrations may be associated with glioma type, such as IDH-status, as well as clinical measures of blood glucose levels. Observed increases in Ace after KD (similar to a recent study14), which correlated with fasting glucose levels (Fig. 4), suggest the efficacy of MRS to monitor cerebral ketotic state as a marker of dietary response. Increases in Ace and bHB in contralateral brain suggest the wider impact of KD and the observed tNAA decrease in such regions may perhaps be explained by a disruption of TCA cycle activity. bHB elevation in IDH-mutated tumors is suggestive of an altered response to KD therapy; studies on more patients are required. AcAc was largely undetectable since it may be of low concentration and overlaps (at 3.45 ppm) using short-TE may prevent its measurement.18 Future development may be needed to optimize detection of all three ketone bodies for monitoring KD-based therapies.Acknowledgements
The authors would like to acknowledge the generosity of all the patients who volunteered for the study.References
1. Wilder R. M. The effect of ketonemia on the course of epilepsy. Mayo Clin. Bull. 2, 307–308 (1921). 2. Cervenka, M. C. & Kossoff, E. H. Dietary Treatment of Intractable Epilepsy. Contin. Lifelong Learn. Neurol. 19, 756–766 (2013).
3. Schmidt, M., Pfetzer, N., Schwab, M., Strauss, I. & Kämmerer, U. Effects of a ketogenic diet on the quality of life in 16 patients with advanced cancer: A pilot trial. Nutr. Metab. (Lond). 8, 54 (2011).
4. Rieger, J. et al. ERGO: a pilot study of ketogenic diet in recurrent glioblastoma. Int. J. Oncol. 44, 1843–52 (2014).
5. Zuccoli, G. et al. Metabolic management of glioblastoma multiforme using standard therapy together with a restricted ketogenic diet: Case Report. Nutr. Metab. (Lond). 7, 33 (2010).
6. Strowd, R. E. et al. Glycemic modulation in neuro-oncology: experience and future directions using a modified Atkins diet for high-grade brain tumors. Neuro-Oncology Pract. 2, 127–136 (2015).
7. Chang, H. T., Olson, L. & Schwartz, K. A. Ketolytic and glycolytic enzymatic expression profiles in malignant gliomas: implication for ketogenic diet therapy. Nutr. Metab. (Lond). 10, 47 (2013).
8. Louis, D. N. et al. The 2016 World Health Organization Classification of Tumors of the Central Nervous System: a summary. Acta Neuropathol. 131, 1–18 (2016).
9. Novotny, E. & Rothman, D. L. Observation of Cerebral Ketone Bodies by Proton Nuclear Magnetic Resonance Spectroscopy. Ann. Neurol. 40, 285–339 (1996).
10. Seymour, K. J., Bluml, S., Sutherling, J., Sutherling, W. & Ross, B. D. Identification of cerebral acetone by 1H-MRS in patients with epilepsy controlled by ketogenic diet. Magma 8, 33–42 (1999).
11. Kreis, R. & Ross, B. D. Cerebral metabolic disturbances in patients with subacute and chronic diabetes mellitus: detection with proton MR spectroscopy. Radiology 184, 123–130 (1992).
12. Wootton-Gorges, S. L. et al. Detection of cerebral beta-hydroxybutyrate, acetoacetate, and lactate on proton MR spectroscopy in children with diabetic ketoacidosis. AJNR. Am. J. Neuroradiol. 26, 1286–91 (2005).
13. Pan, J. W., Rothman, D. L., Behar, K. L., Stein, D. T. & Hetherington, H. P. Human Brain β-Hydroxybutyrate and Lactate Increase in Fasting-Induced Ketosis. J. Cereb. Blood Flow Metab. 20, 1502–1507 (2000).
14. Artzi, M. et al. Changes in cerebral metabolism during ketogenic diet in patients with primary brain tumors: 1H-MRS study. J. Neurooncol. 132, 267–275 (2017).
15. Öz, G. & Tkáč, I. Short-echo, single-shot, full-intensity proton magnetic resonance spectroscopy for neurochemical profiling at 4 T: Validation in the cerebellum and brainstem. Magn. Reson. Med. 65, 901–910 (2011). 16. Scheenen, T. W. J., Klomp, D. W. J., Wijnen, J. P. & Heerschap, A. Short echo time 1H-MRSI of the human brain at 3T with minimal chemical shift displacement errors using adiabatic refocusing pulses. Magn. Reson. Med. 59, 1–6 (2008).
17. Provencher, S. W. Estimation of metabolite concentrations from localized in vivo proton NMR spectra. Magn. Reson. Med. 30, 672–679 (1993).
18. Cecil, K. M., Mulkey, S. B., Ou, X. & Glasier, C. M. Brain ketones detected by proton magnetic resonance spectroscopy in an infant with Ohtahara syndrome treated with ketogenic diet. Pediatr. Radiol. 45, 133–137 (2015).
Figures