0636
PI3K/mTOR inhibition of IDH1 mutant glioma leads to reduced 2HG production that is associated with increased survival1Radiology and Biomedical Imaging, University of California, San Francisco, San Francisco, CA, United States, 2Neurological Surgery, University of California, San Francisco, San Francisco, CA, United States
Synopsis
Mutant IDH1 produces the oncometabolite 2HG, which drives tumorigenesis in low-grade gliomas. One potential therapeutic option for such gliomas is treatment with a PI3K/mTOR inhibitor. Using cell models genetically-engineered to express mutant IDH1, we observed that PI3K/mTOR inhibition induced a reduction in 2HG levels in treated cells and tumors, that was associated with reduced cell proliferation and enhanced animal survival. The drop in 2HG was due to a reduction in its synthesis from both glucose and glutamine. Our study identifies MRS-detectable metabolic alterations that could serve as indicators of response for mutant IDH1 glioma patients undergoing treatment with PI3K/mTOR inhibitors.
Introduction
Mutations in isocitrate dehydrogenase 1 (IDH1) drive tumorigenesis in 70-90% of low-grade gliomas and secondary glioblastomas. The mutant IDH1 enzyme (IDH1mut) produces the oncometabolite 2-hydroxyglutarate (2HG), which, in addition to driving tumorigenesis, induces cellular metabolic reprogramming. Dual phosphoinositide-3-kinase (PI3K)/mammalian target of rapamycin (mTOR) inhibition is one of the therapeutic options currently in clinical trials for the treatment of IDH1mut gliomas. The PI3K/mTOR pathway modulates, amongst others, lactate dehydrogenase A (LDHA) levels, and we have previously shown that the conversion of hyperpolarized pyruvate to lactate is reduced in wild-type IDH1 glioma providing an early magnetic resonance spectroscopy (MRS) biomarker of tumor response to PI3K/mTOR inhibitors1-3. However, in IDH1mut tumors, LDHA is silenced precluding the use of hyperpolarized lactate as biomarker for monitoring response4. The goal of the current study was therefore to identify MRS-based metabolic biomarkers of response to PI3K/mTOR inhibitors by investigating the effect of one such inhibitor, XL765 (Voxtalisib), in IDH1mut cells and tumors.Methods
Cell studies: We used two cell models, U87 glioblastoma cells and immortalized normal human astrocyte cells, that were both genetically-engineered to express IDH1mut (U87mut and NHAmut respectively). Cells were maintained as previously5. For 13C-MR studies, cells were cultured in medium containing 5.5mM [1-13C]glucose or 3mM [3-13C]glutamine. XL765-treatment was with each cell’s IC50 (NHAmut: 32μM for 72h and U87mut: 12μM for 24h) or vehicle (DMSO; NHAmut: 0.16% for 72h and U87mut: 0.06% for 24h).
Immunoblotting: Phosphorylated initiation factor 4E-binding protein 1 (p4E-BP1) levels were evaluated using western blotting with β-actin as loading control.
Animal Studies: U87mut orthotropic tumor xenografts were generated as previously1 and imaged on a 600MHz vertical Varian spectrometer using a volume coil. Axial high-resolution images were recorded using a spin echo sequence (TE/TR=20/1200ms, FOV=30x30mm, 256x256, ST=1mm, NA=2). When tumors reached 2-3mm in diameter (day zero (D0)) mice were randomized and treated twice a day orally with 30mg/kg XL765 or HCl (vehicle facilitating drug uptake from GI track). Tumor size was evaluated using in-house software6 and normalized to the D0 value.
Cell/brain tumor tissue extraction: Extractions were performed using the dual-phase extraction method7 and the aqueous phase was lyophilized and resuspended in D2O.
Extract MRS data acquisition and analysis: 1H (90o flip angle (θ), TR=3s) and proton-decoupled 13C-spectra (θ=30o, TR=3s) were recorded using a 500MHz spectrometer equipped with a triple resonance cryoprobe. The spectra were quantified by peak integration using MestRenova (Mestrelab) and integrals corrected for saturation and NOE (13C acquisitions only) and normalized to an external sodium 3-(trimethylsilyl)propionate-2,2,3,3-d4 (TSP) reference and to cell number (cells) or total signal (tissue).
Multivariate analysis: An unsupervised Principal Component Analysis (PCA) was performed on the cell extract data (n=8) to determine the intrinsic clustering of samples between treated and control groups using MetaboAnalyst8. The Variable Importance in Projection (VIP) plot was used to detect the metabolites involved in discriminating the two groups.
Univariate analysis: Other results (n≥3) are expressed as mean±s.d. and the significance of univariate comparisons was determined using unpaired two-tailed Student’s t-test with unequal variance.
Results
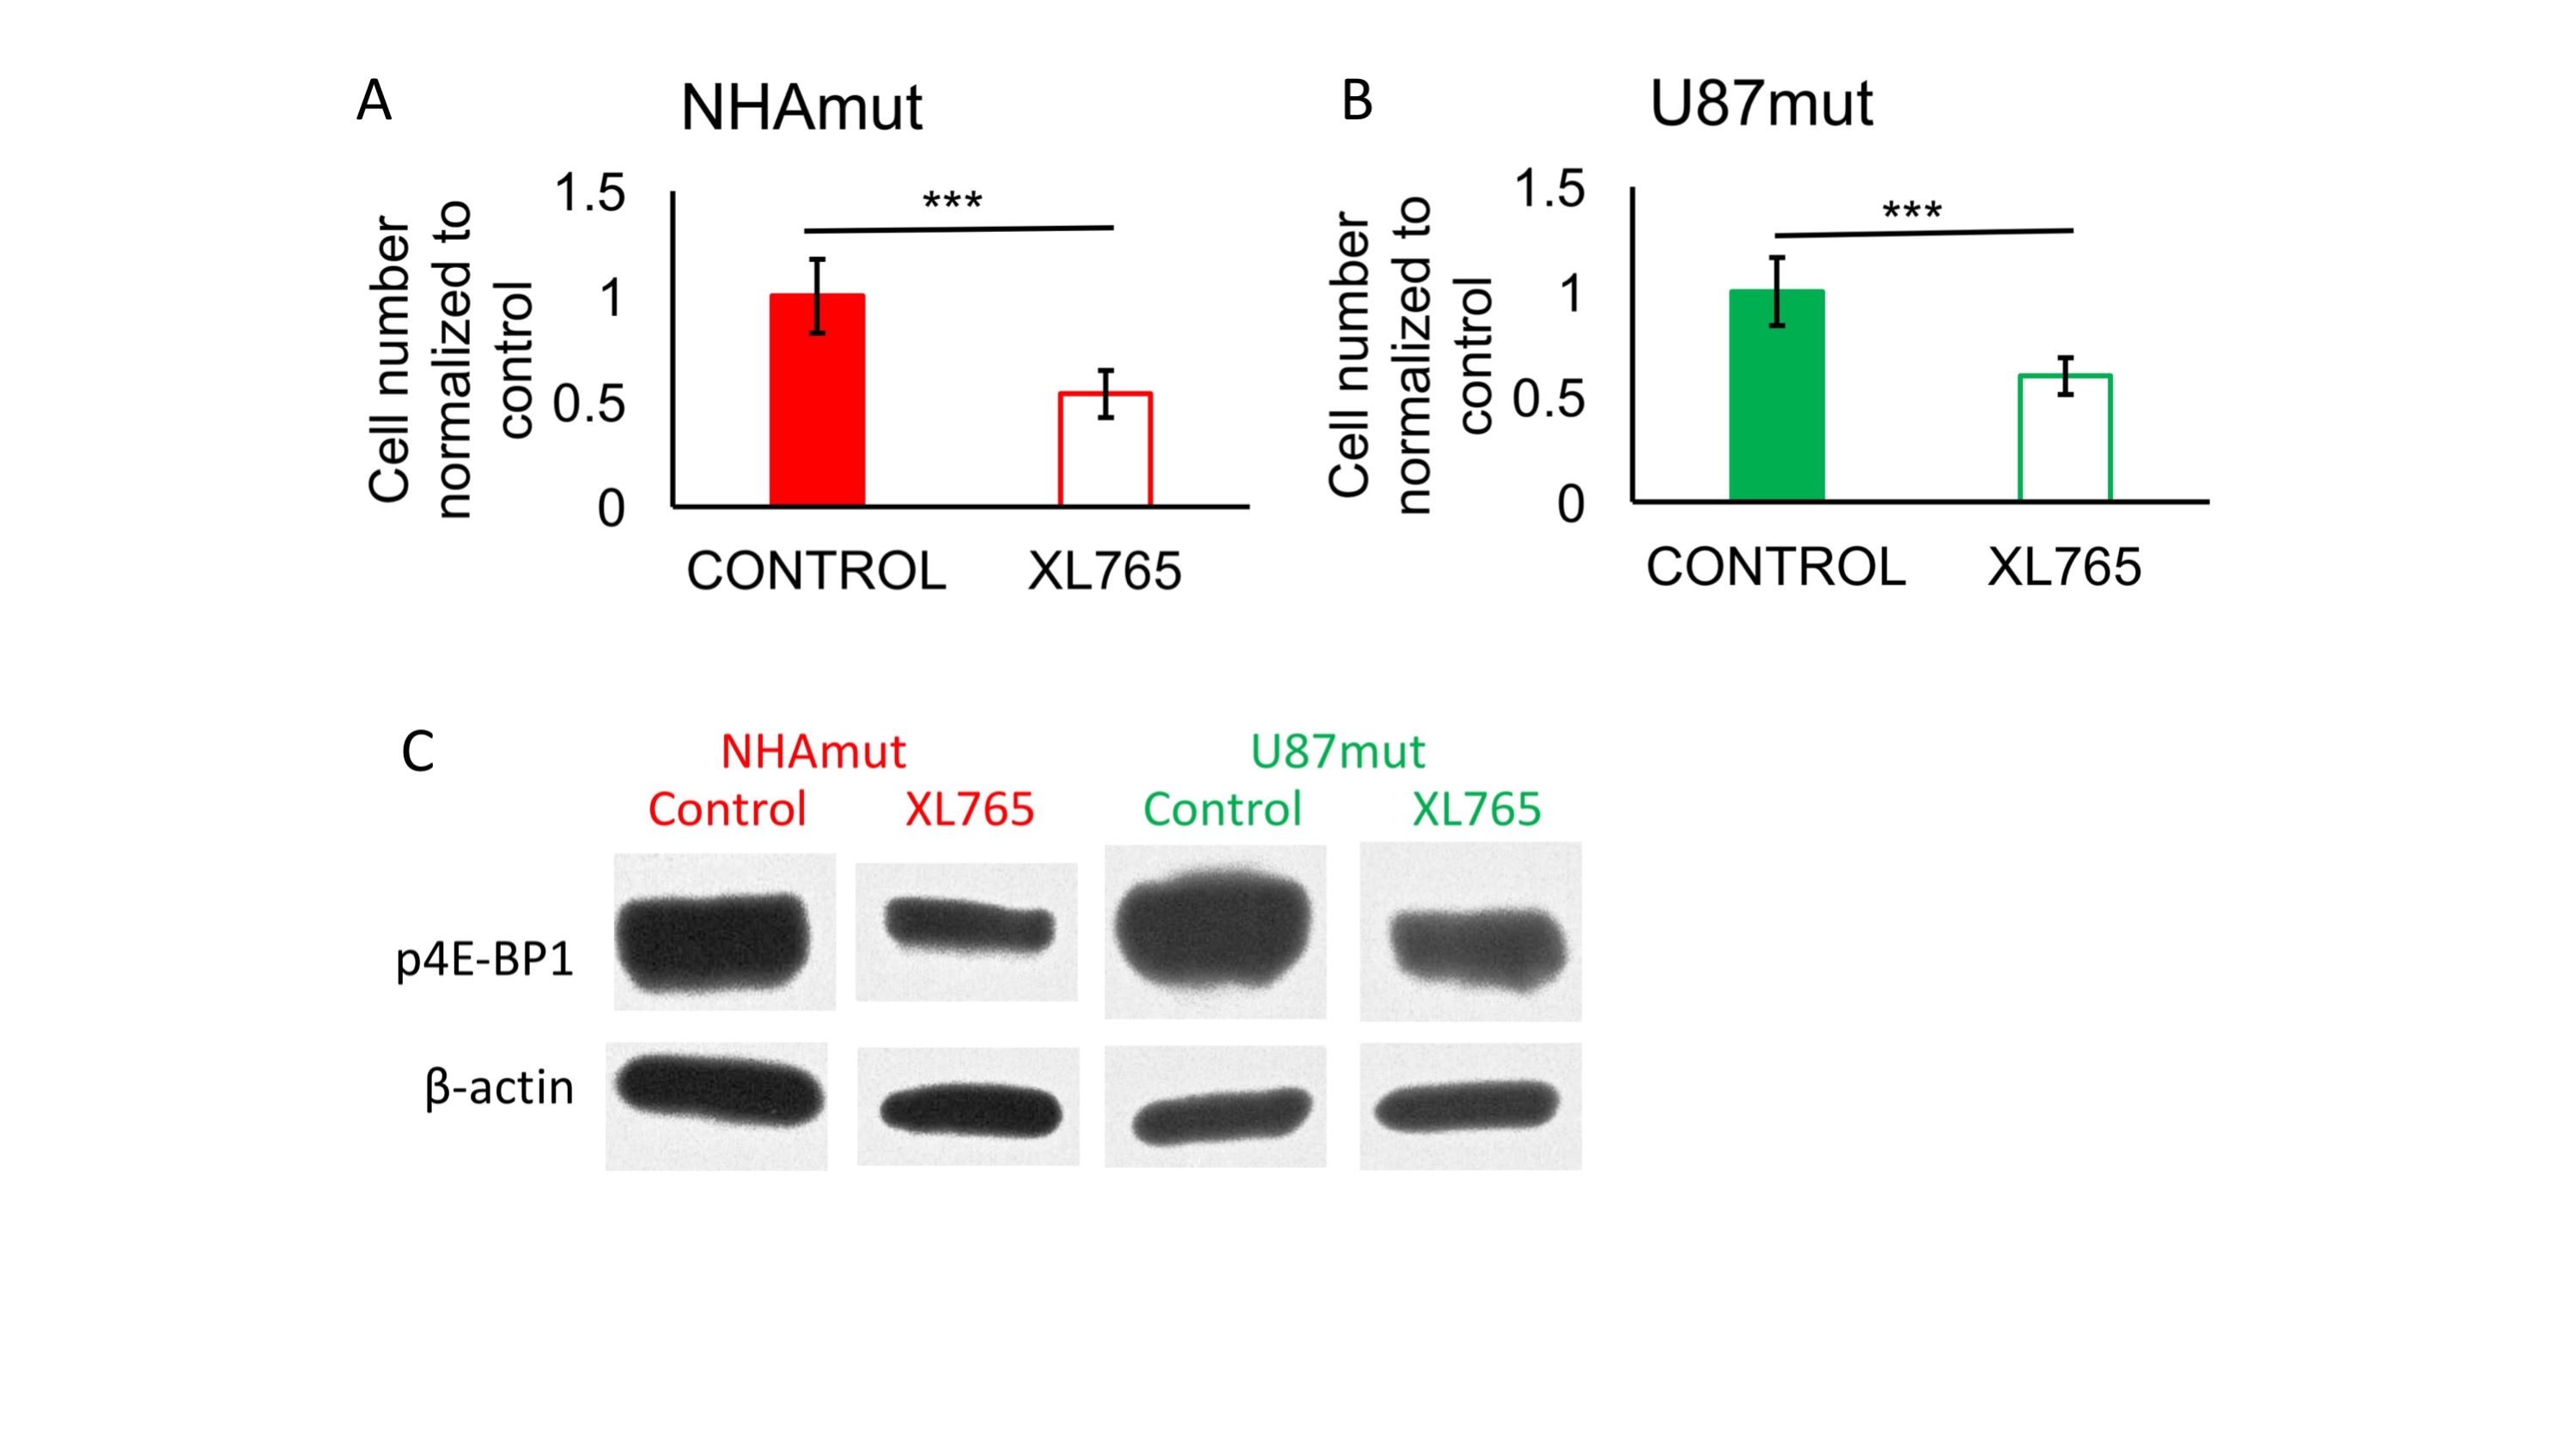
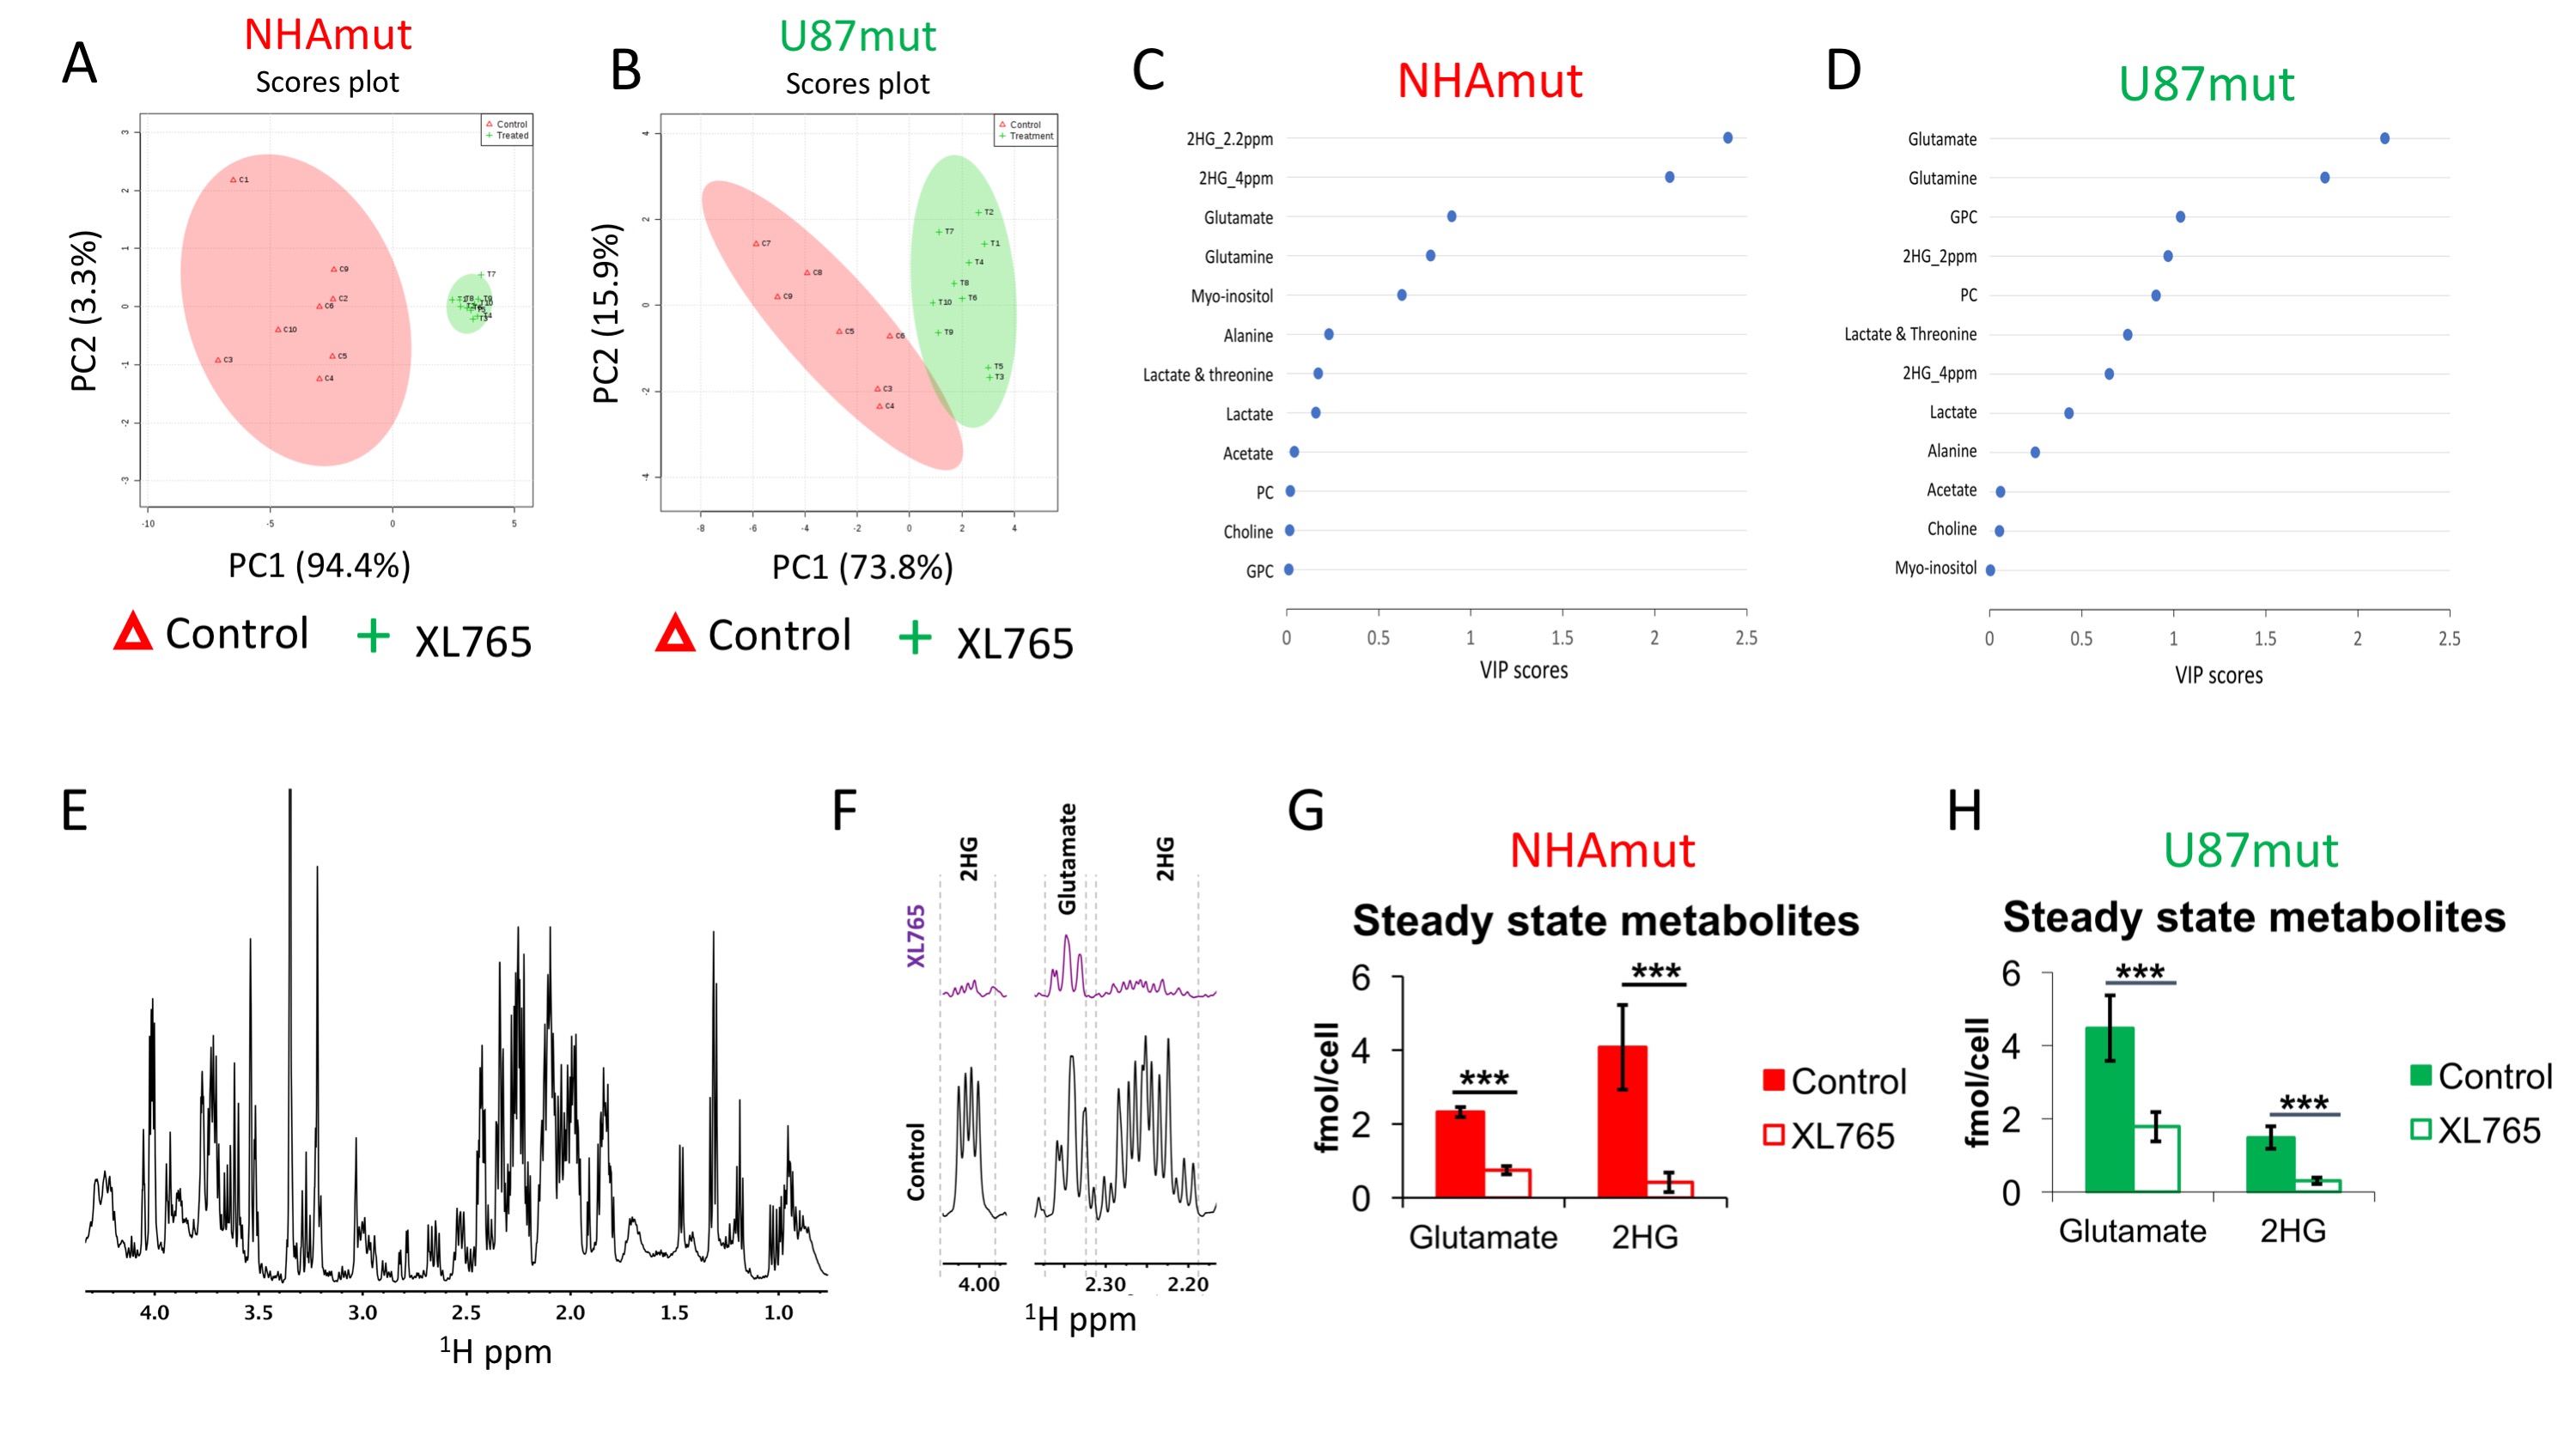
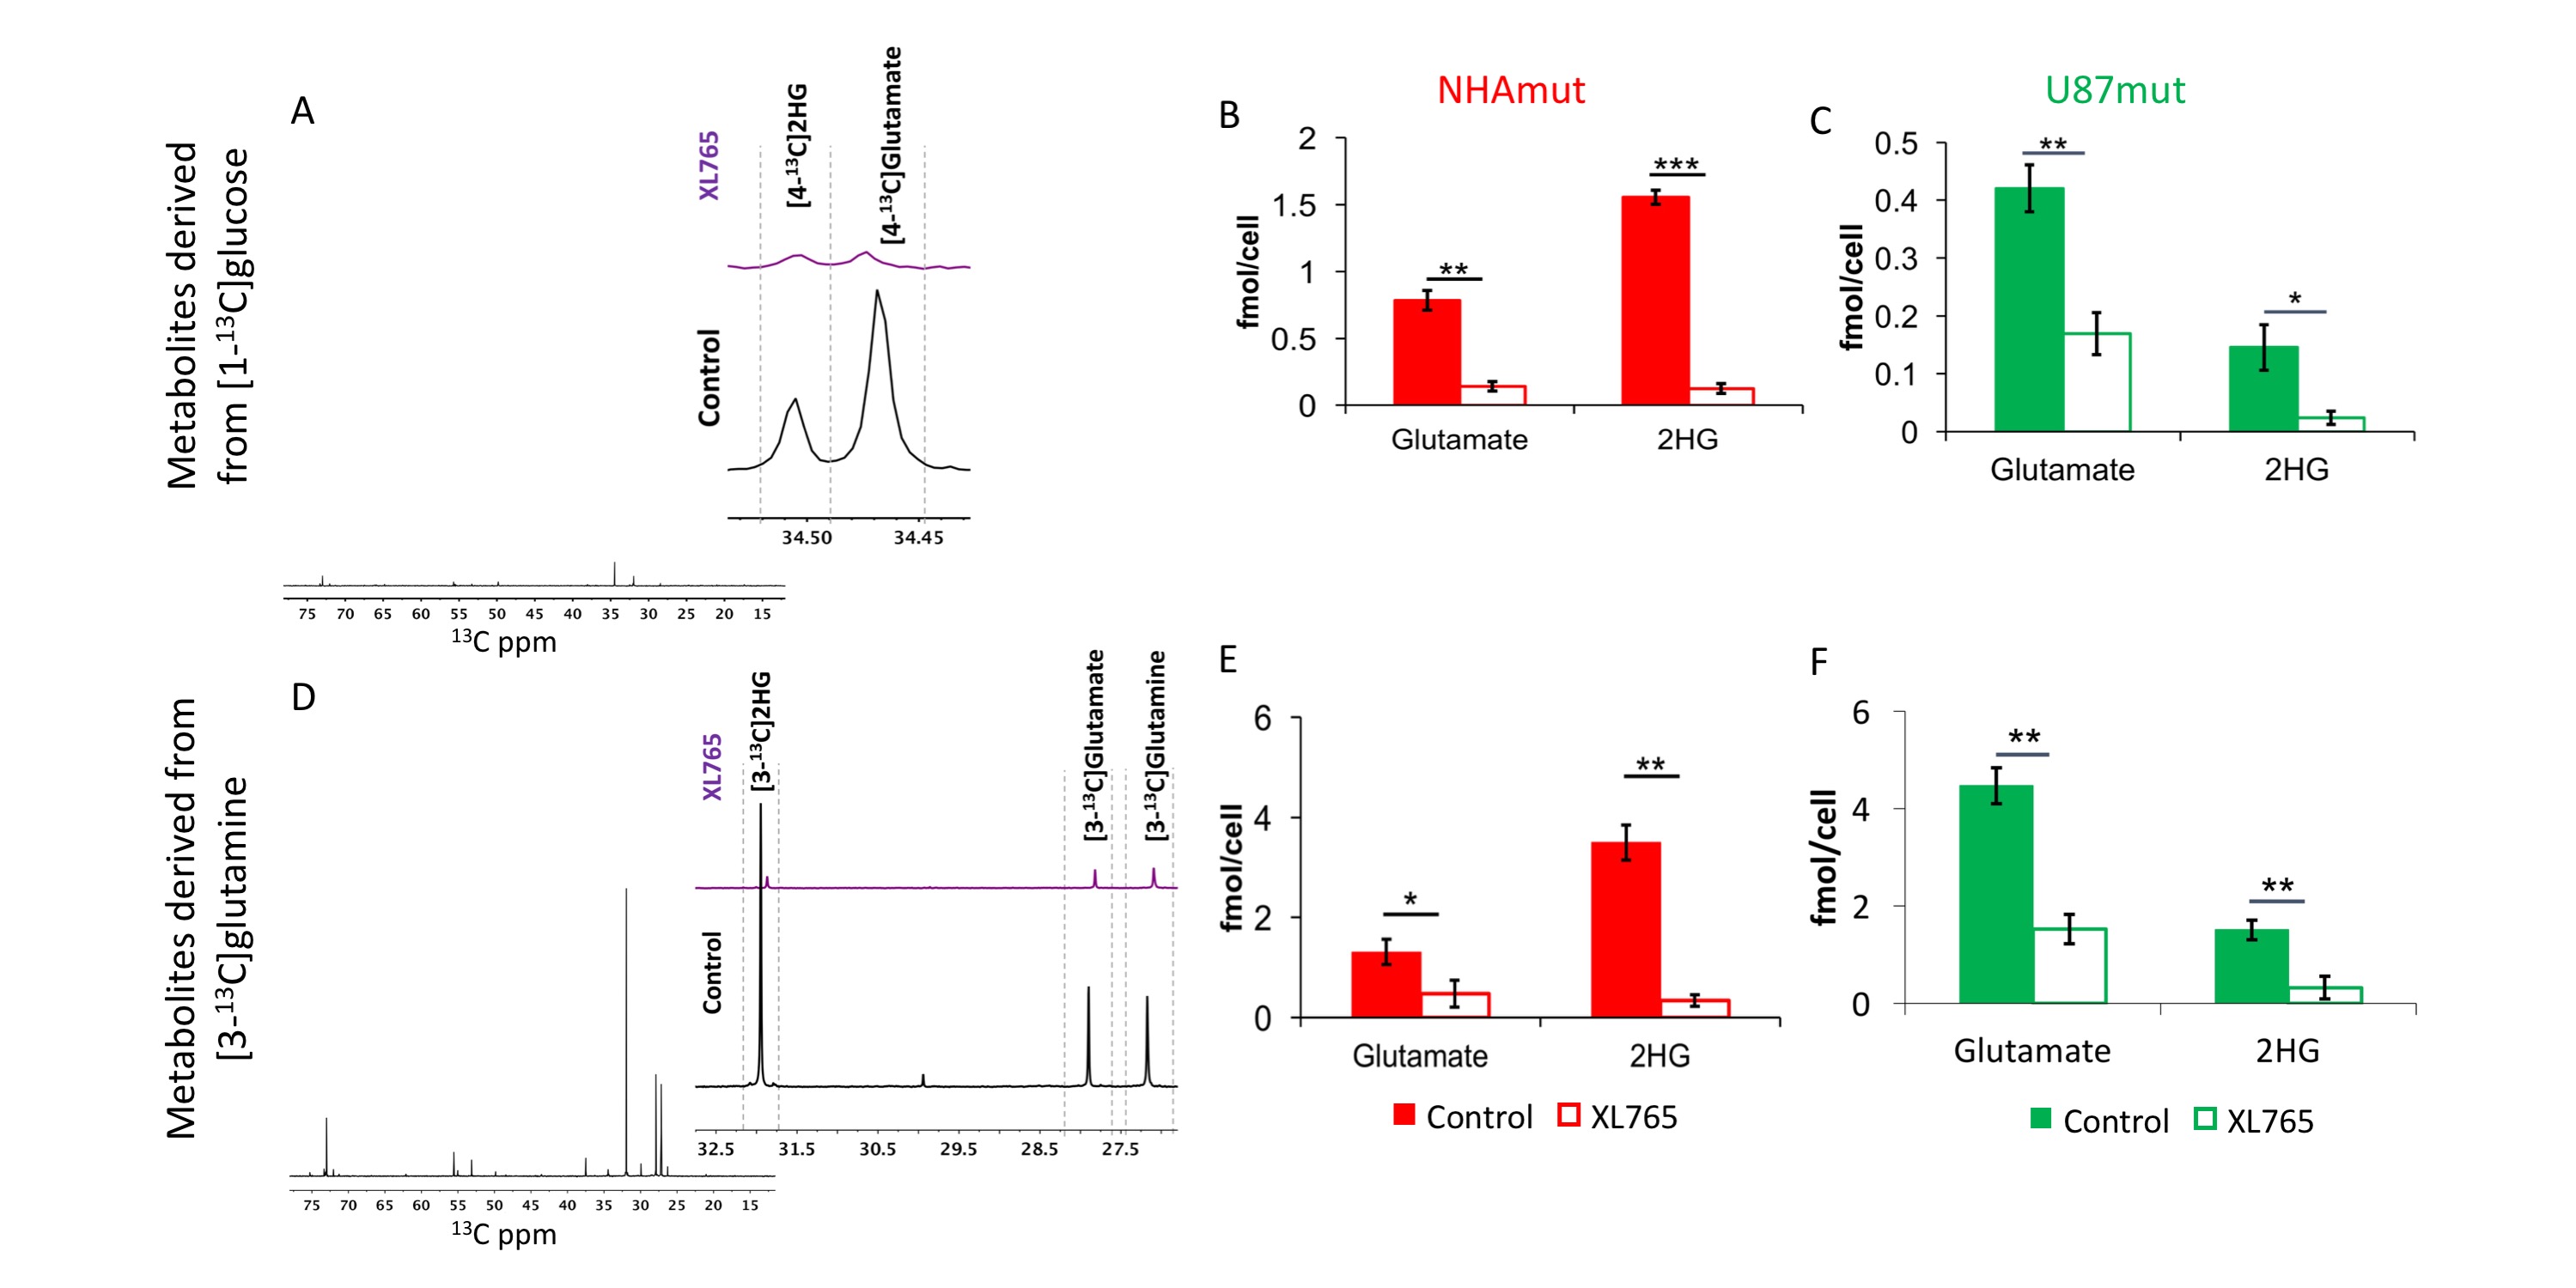
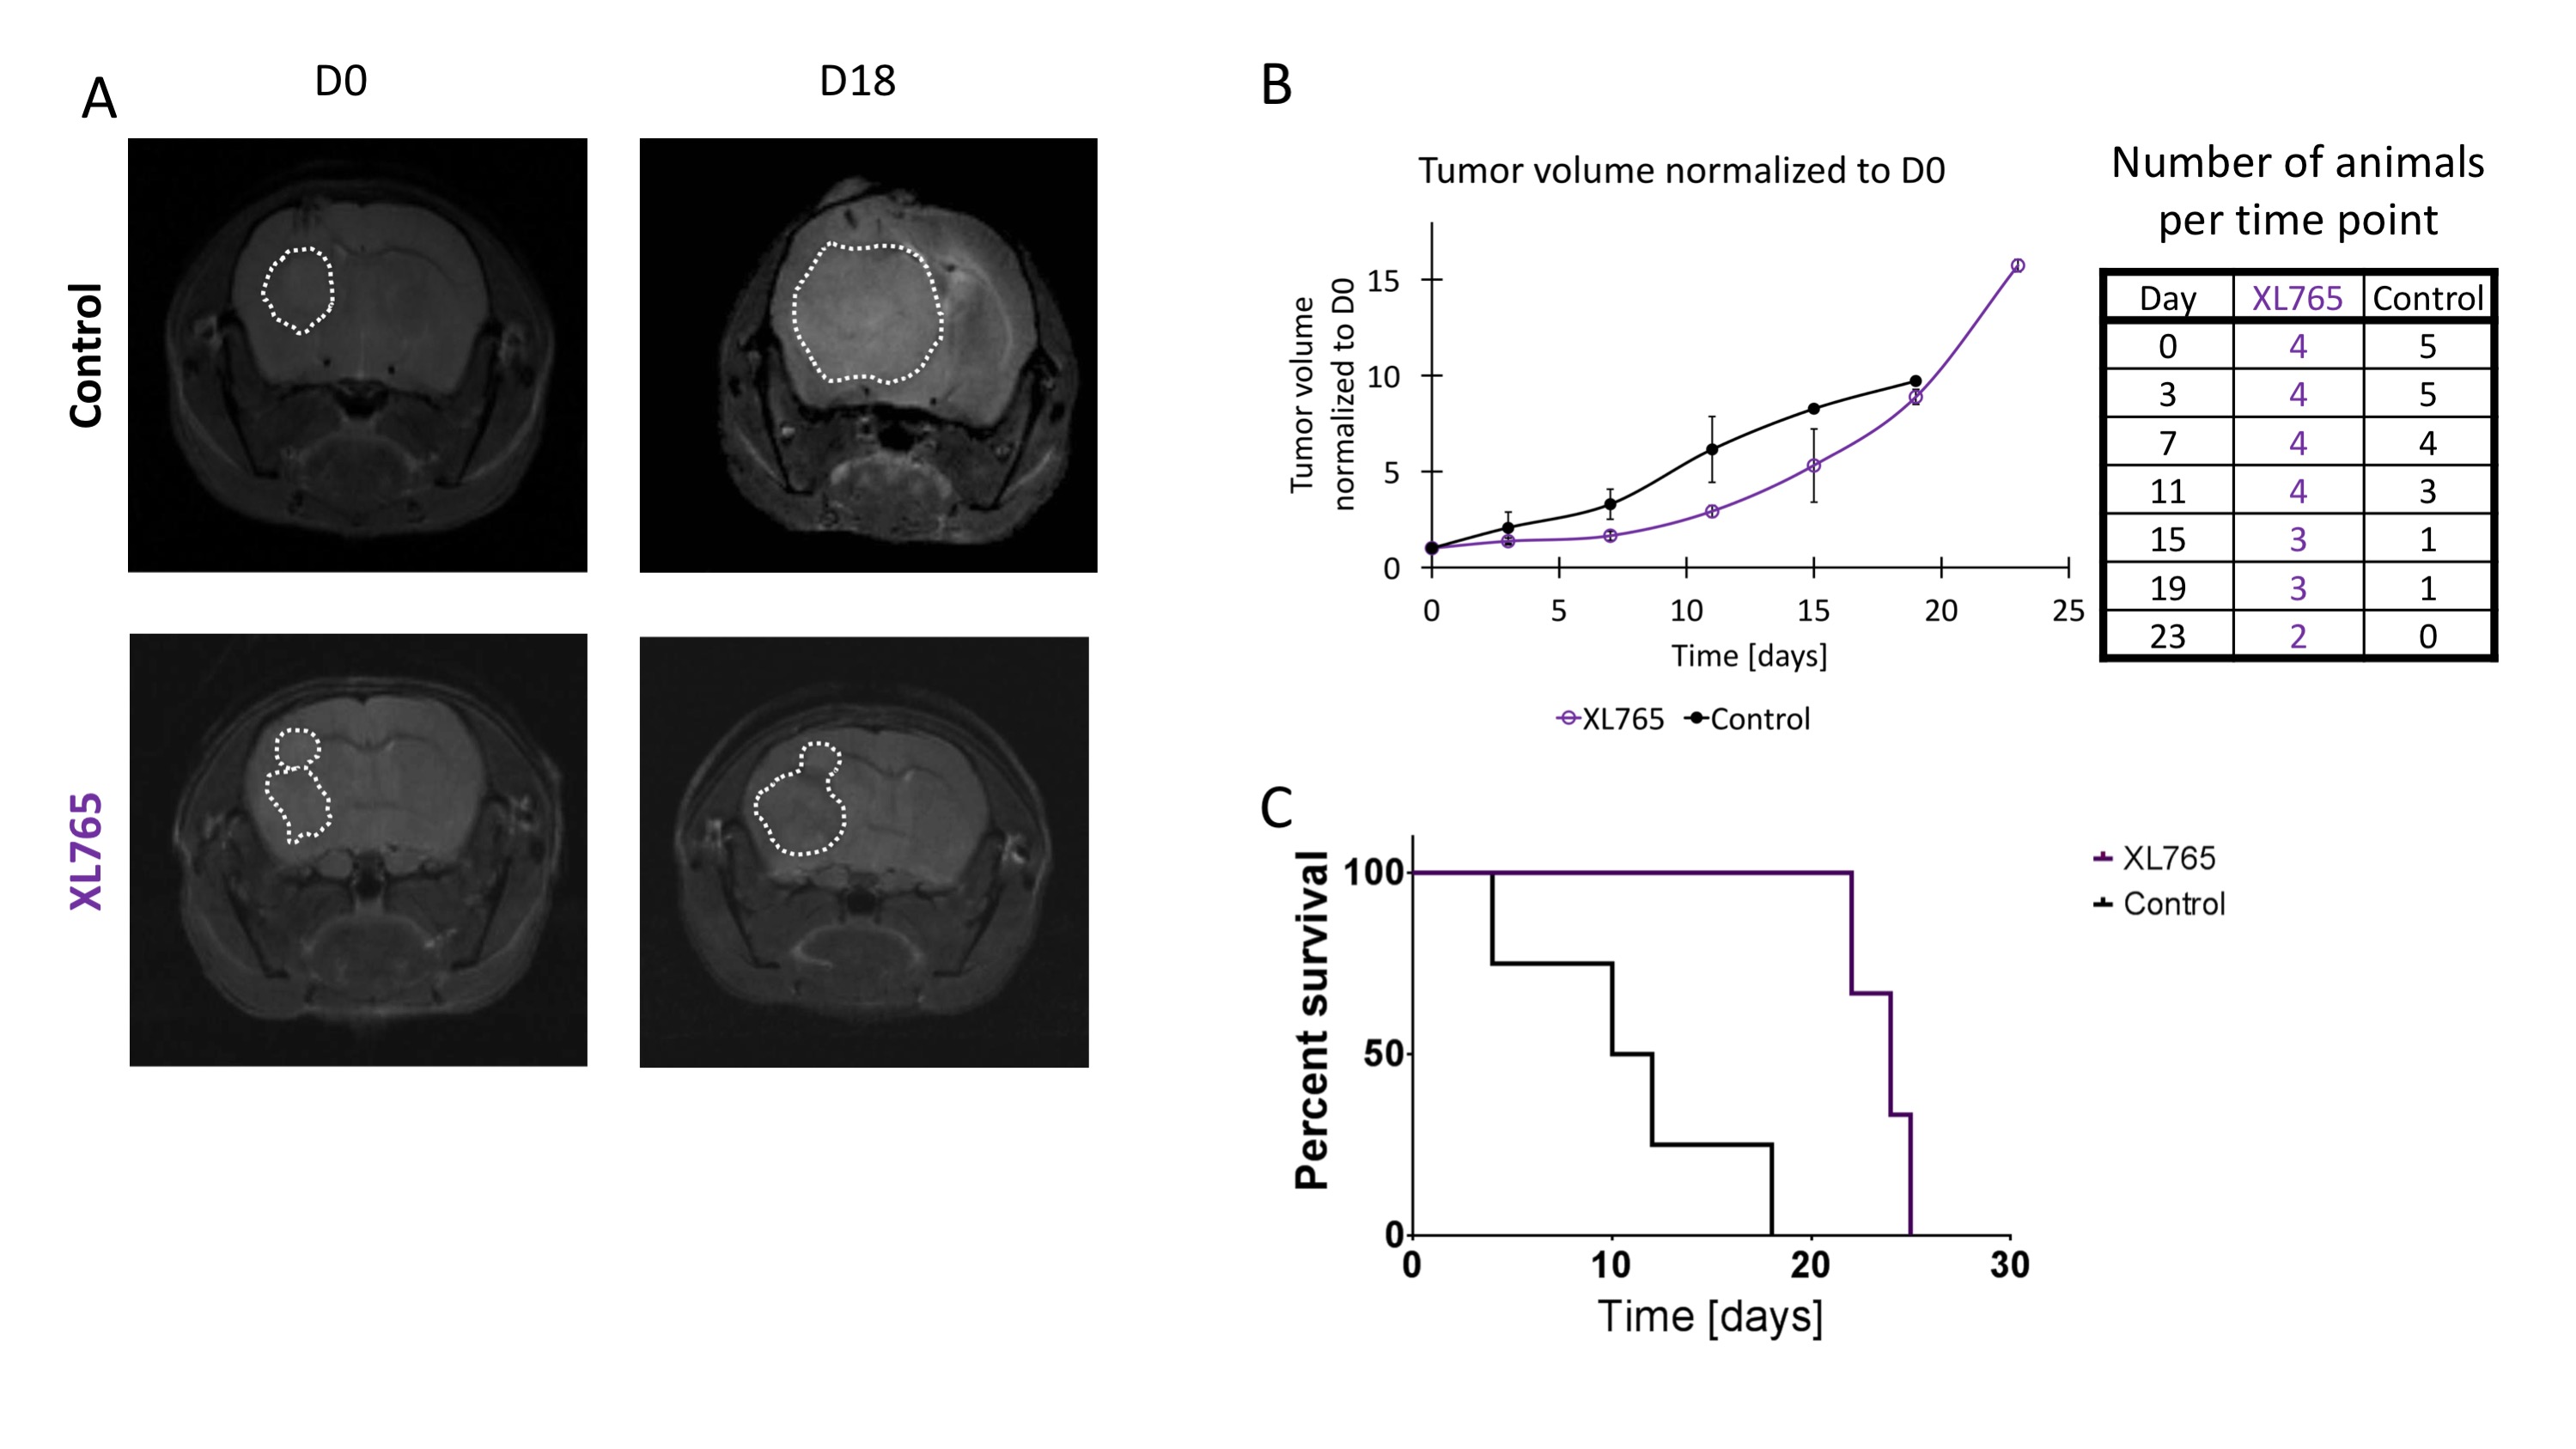
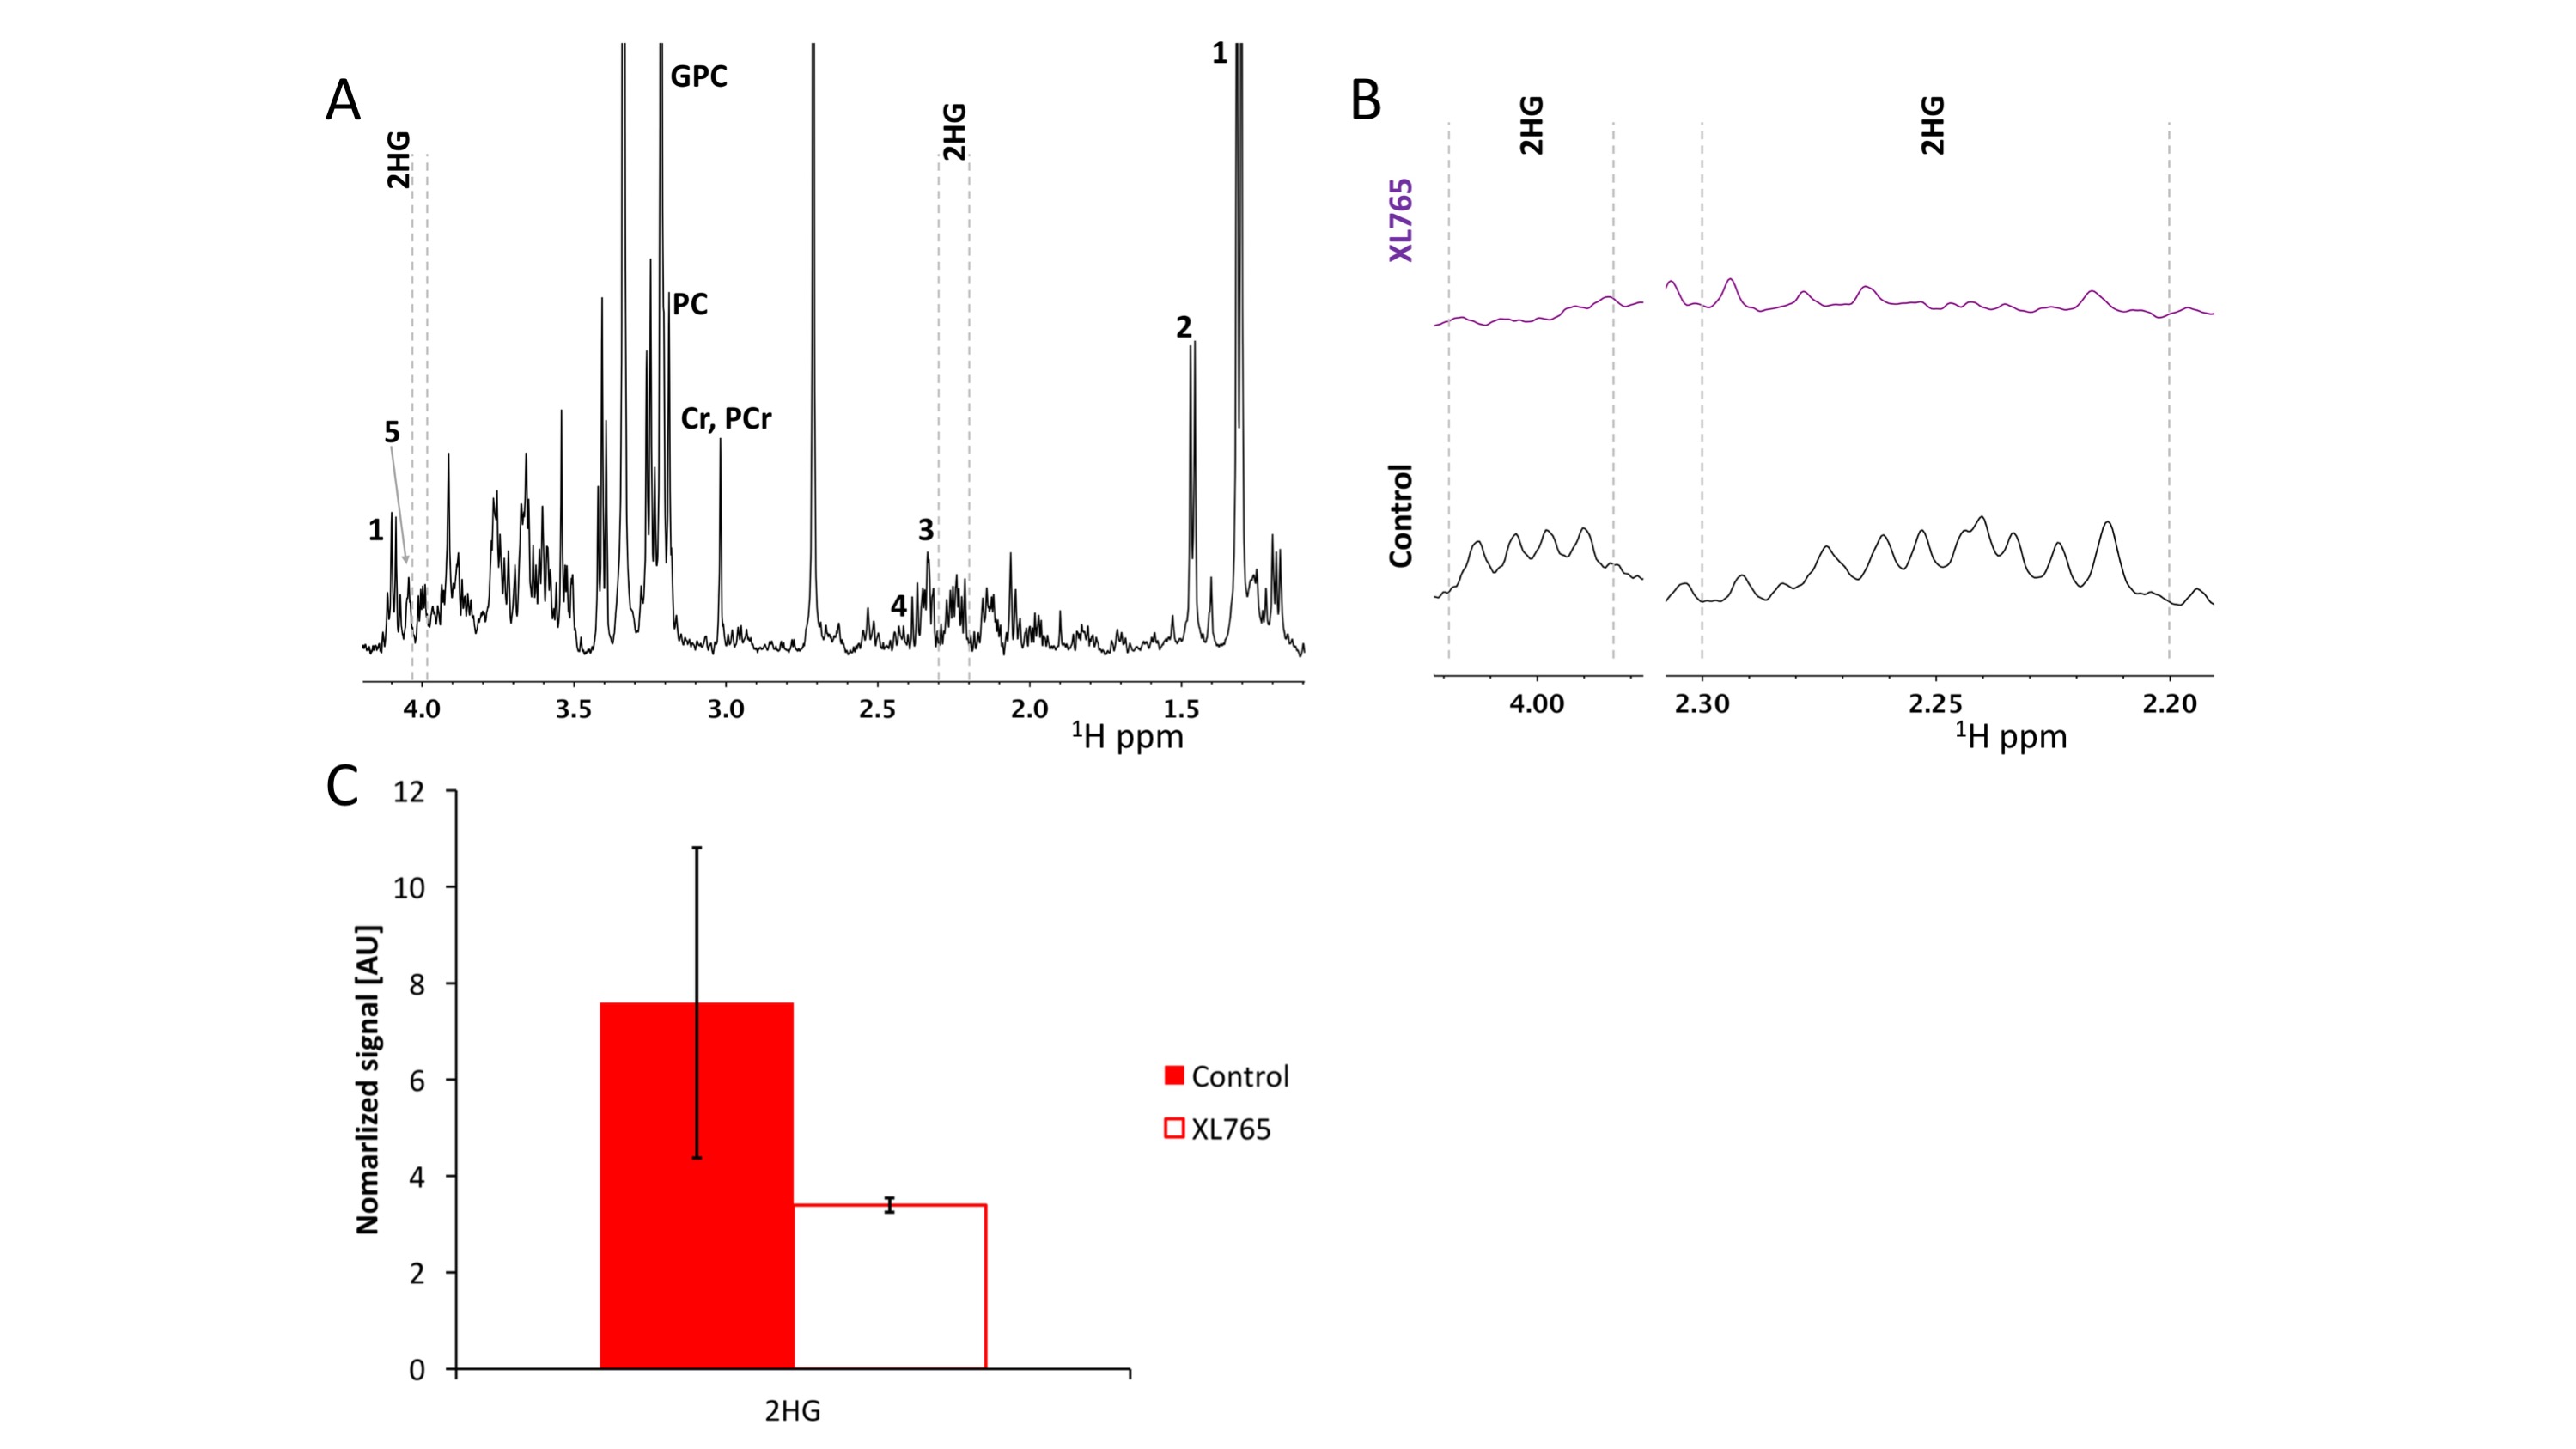
As expected, XL765 inhibited cell proliferation to 50±13% (Fig.1A&B) and induced a reduction in p4E-BP1, which is controlled by PI3K/mTOR signaling, in both cell lines (Fig.1C), confirming inhibition of the PI3K/mTOR pathway. The PCA scores plots (Fig.2A&B) provided clear discrimination between XL765 and control groups for both models. 2HG and glutamate were identified from the VIP scores as the most important metabolites in the discrimination between control and treated cells (Fig.2C&D), with metabolite quantification showing a significant reduction in their steady-state levels in both NHAmut (Fig.2E-G) and U87mut treated cells (Fig.2H). The flux of glucose and glutamine, which both contribute to 2HG and glutamate production, were investigated using 13C-labelled compounds. Using 13C-MRS (Fig.3A), we observed a reduction in flux from [1-13C]glucose to [4-13C]2HG and to [4-13C]glutamate (Fig.3B&C), as well as from [3-13C]glutamine to [3-13C]2HG and [3-13C]glutamate in the treatment group (Fig.3D-F) identifying the reason for the drop in steady-state 2HG and glutamate. Finally, XL765-treatment of U87mut tumor-bearing mice led to an apparent slower tumor growth (Fig.4A-B), which was associated with significantly increased animal survival (Fig.4C) and a trend to lower 2HG levels in the 1H spectra of tumor extracts (Fig.5).Conclusion
Our results indicate that response to PI3K/mTOR inhibitor-treatment in an IDH1mut glioma model is accompanied by inhibition in 2HG and glutamate synthesis. Importantly, both 2HG and glutamate/glutamine are detectable in vivo by MRS9 and results from a recent clinical study with a PI3K/mTOR inhibitor were very promising10. Our studies thus identify a possible translatable metabolic biomarker of response to PI3K/mTOR inhibitors in IDH1mut glioma.Acknowledgements
Work supported by NIH R01CA197254 and P41EB01359.References
1. Chaumeil et al, Hyperpolarized 13C MR spectroscopic imaging can be used to monitor Everolimus treatment in vivo in an orthotopic rodent model of glioblastoma. Neuroimage. (2012) 2;59(1):193-201
2. Ward et al, Noninvasive detection of target modulation following phosphatidylinositol 3-kinase inhibition using hyperpolarized 13C magnetic resonance spectroscopy. Cancer Res. (2010) 15;70(4):1296-305
3. Radoul et al, MR Studies of Glioblastoma Models Treated with Dual PI3K/mTOR Inhibitor and Temozolomide: Metabolic Changes Are Associated with Enhanced Survival. Mol Cancer Ther. (2016) 15(5):1113-22
4. Chesnelong et al, Lactate dehydrogenase A silencing in IDH mutant gliomas. Neuro Oncol. (2014) 16(5):686-95
5. Izquierdo-Garcia et al., Metabolic Reprogramming in Mutant IDH1 Glioma Cells. PLOS ONE (2015) 10:e011878
6. Nelson SJ. Analysis of volume MRI and MR spectroscopic imaging data for the evaluation of patients with brain tumors. Magn Reson Med (2001) 46:228–39
7. Ronen et al, Magnetic resonance detects changes in phosphocholine associated with Ras activation and inhibition in NIH 3T3 cells. Br J Cancer. (2001) 2;84(5):691-6
8. Xia, J. and Wishart, D.S. Using MetaboAnalyst 3.0 for Comprehensive Metabolomics Data Analysis. Current Protocols in Bioinformatics (2016) 55:14.10.1-14.10.91
9. Leather et al, Magnetic Resonance Spectroscopy for Detection of 2-Hydroxyglutarate as a Biomarker for IDH Mutation in Gliomas. Metabolites (2017) 19;7(2)
10. Wahl et al, Probing the phosphatidylinositol 3-kinase/mammalian target of rapamycin pathway in gliomas: A phase 2 study of everolimus for recurrent adult low-grade gliomas. Cancer (2017)
Figures