0634
Mapping of Glioma Metabolism Using In Vivo Deuterium Metabolic Imaging (DMI)1Department of Radiology and Biomedical Imaging, Yale University, New Haven, CT, United States, 2Department of Psychiatry, Yale University, New Haven, CT, United States, 3Department of Biomedical Engineering, Yale University, New Haven, CT, United States
Synopsis
Deuterium Metabolic Imaging (DMI) is a novel approach providing high 3D spatial resolution metabolic data from both animal models and human subjects. DMI relies on 2H MRSI in combination with administration of 2H-labeled substrates. In a rat glioma model we show how DMI combined with administration of [6,6’-2H2]-glucose and [2H3]-acetate allowed spatial mapping of differences in metabolism between normal brain and glioma. DMI data after infusion of 2H-labeled glucose revealed high glucose uptake and lactate production but limited glucose oxidation in glioma. Furthermore, DMI revealed acute therapeutic effects of a drug (dichloroacetate) targeting glucose oxidation.
Introduction
Noninvasive imaging of brain tumor metabolism could be beneficial for diagnosis, evaluation of disease progression and therapeutic response. Currently 2-18F-fluoro-2-deoxy-D-glucose positron emission tomography (FDG-PET) is the only metabolic imaging method readily available to clinicians that captures active metabolism. However, FDG-PET provides mostly a measure of glucose uptake, generates insufficient contrast due to high glucose uptake in normal brain, and is therefore not frequently used in neuro-oncology. Thus, there is a need for an easy-to-perform, MR-based imaging technique that can comprehensively map metabolism in glioma beyond the uptake of glucose. Here we show that Deuterium Metabolic Imaging (DMI), which combines 2H MRSI with administration of 2H-labeled substrates, can provide metabolic maps of both glycolytic and oxidative metabolism of [6,6’-2H2]-glucose in glioma and normal-appearing brain. We also show that DMI detected acute metabolic changes induced by anti-cancer drugs, and that DMI can be used with 2H-labeled acetate.Methods
Animal studies were performed on an 11.7T magnet interfaced to a Bruker spectrometer. RF transmission and reception for proton MRI and shimming was performed with two orthogonal 20mm surface coils driven in quadrature and tuned to 499.8MHz. Deuterium RF transmission and reception was achieved with a 14mm diameter surface coil tuned to 76.7MHz and integrated with the proton RF coil. Acquisition of anatomical MR images was followed by 3D B0 mapping and shimming, resulting in circa 25–30Hz FWHM of the water peak across a 7x5x10mm3=750µL volume. T1-weighted images were acquired after an intravenous (IV) bolus of Gd-DTPA to visualize the tumor lesion. 2H MR signal acquisition was achieved with a pulse-acquire sequence extended with 3D phase-encoding gradients. Steady state DMI data were acquired at a 2x2x2mm3=8µL nominal spatial resolution in circa 35 min (TR=400 ms, 8 averages). All 1H MRI and 2H DMI data were processed in NMRWizard, a home-written graphical user interface in Matlab 8.3. DMI processing included linear prediction of missing time domain points due to the phase encoding gradients and 5 Hz line broadening followed by 4D Fourier transformation. The resulting 2H MR spectra were quantified with linear least-squares fitting of up to four Lorentzian lines and a linear baseline. Deuterium-enriched metabolite levels were overlaid with anatomical MR images as amplitude colormaps following spatial convolution with a Gaussian kernel. Fischer344 rats (n=7) were injected with RG2 glioma cells as described previously (1). Glioma-bearing rats were infused with [6,6’-2H2]-glucose (1M, 1.5g/kg) or [2H3]-acetate (2M, 1.5g/kg) via an IV or intraperitoneal (IP) infusion, with DMI data acquisition starting after ~60 minutes. Dichloroacetate (DCA, 200mg/kg) was administered via IV infusion 60 mins before the start of [6,6’-2H2]-glucose infusion.Results
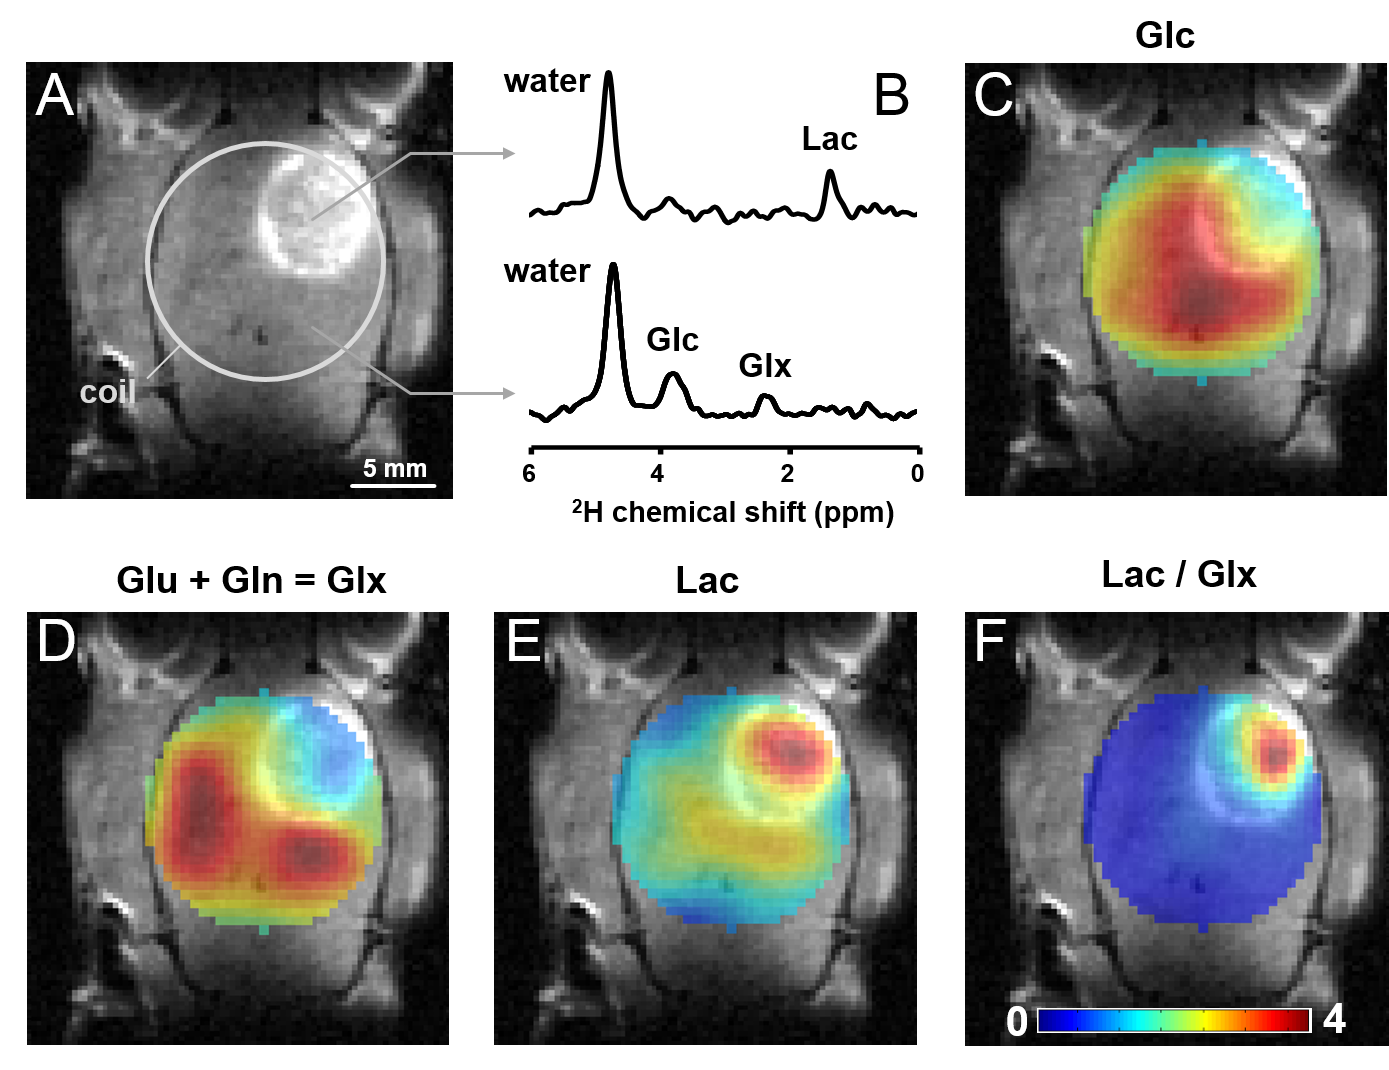
DMI data acquired after [6,6’-2H2]-glucose infusion illustrate regional difference in levels of 2H-labeled metabolites between normal-appearing brain and glioma (Fig. 1). Treatment with DCA led to an increase in labeled glutamate+glutamine and a decrease in 2H-labeled lactate (Fig. 2).
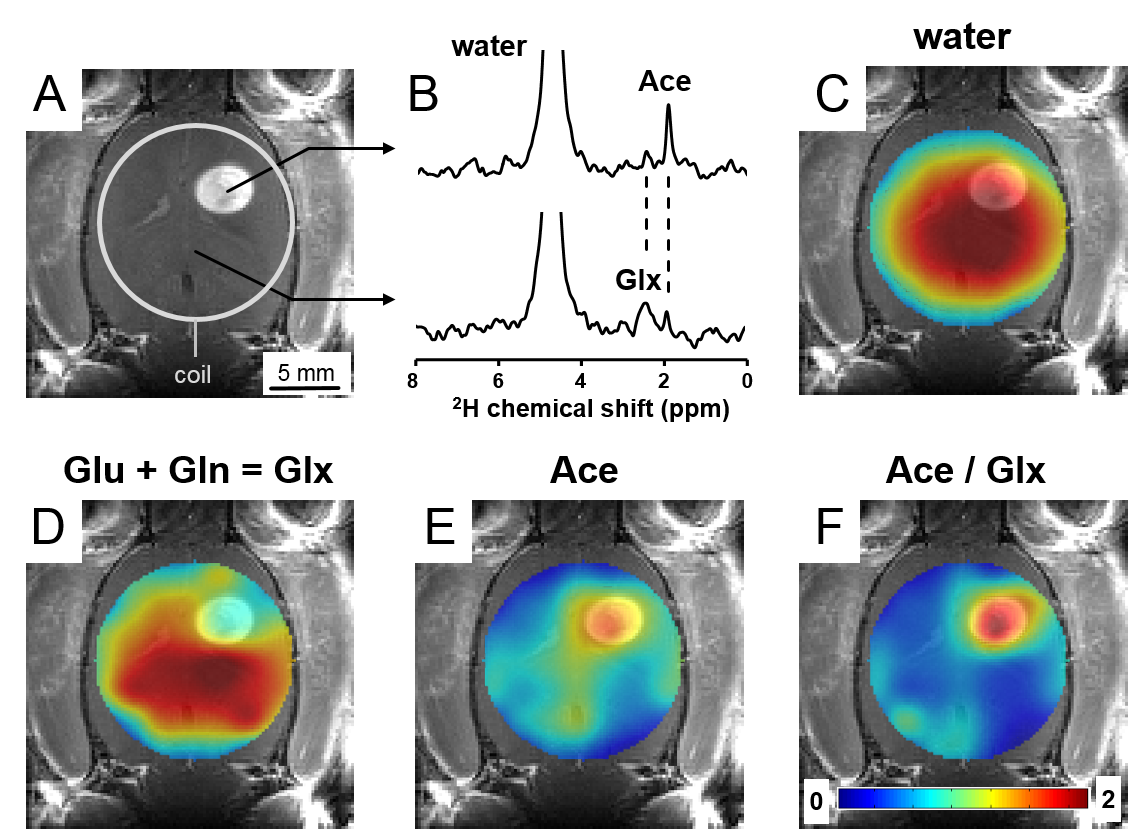
Labeled acetate is metabolized predominantly by astrocytes in animal and human brain (2,3). DMI combined with [2H3]-acetate infusion showed higher levels of labeled acetate and lower levels of labeled glutamate+glutamine in glioma compared to normal-appearing brain (Fig. 3).
Discussion
Deuterium-labeling in brain metabolites has been shown to provide equivalent metabolic information as detection of 13C-labeled substrates with 13C MRS (4). Upon infusion of labeled glucose or acetate, exchange with the TCA-cycle intermediate a-ketoglutarate results in labeling of glutamate+glutamine, which therefore is an indicator of oxidative metabolism of either substrate. Similarly, labeling of lactate after administration of labeled glucose reflects glycolytic activity. The observed 2H-labeling in rat glioma is consistent with high glucose uptake and high rate of glycolysis, producing lactate instead of oxidizing the glucose-derived pyruvate. This metabolic phenotype is named the Warburg effect, and heat maps of the ratio, lactate/(glutamate+glutamine), illustrates its distribution. The “Warburg heat map” showed a clear hotspot in the region of the tumor lesion. The Warburg effect can be inhibited by DCA, which was reflected in the DMI data of Figure 2. DMI also revealed greater uptake but lower oxidation of acetate in glioma compared to normal brain, resulting in high DMI contrast for glioma over normal brain. Further studies are underway to validate absolute concentrations of the 2H-labeled metabolites against their 13C-labeled counterparts.Conclusion
DMI revealed differences in metabolism of [6,6’-2H2]-glucose and [2H3]-acetate between normal brain and tumor, which were partially reversed by treatment with dichloroacetate. Given the versatility of DMI and the range of available 2H-labeled substrates, DMI has the potential to become an easily applicable, widespread MRI modality for metabolic imaging.Acknowledgements
We thank Bei Wang and Xiaxian Ma for help with animal surgeries, and Scott McIntyre and Terry Nixon for continuous technical support and maintenance of the MR scanners.References
1. De Feyter HM, Behar KL, Rao JU, Madden-Hennessey K, Ip KL, Hyder F, Drewes LR, Geschwind J-F, Graaf RA de, Rothman DL. A ketogenic diet increases transport and oxidation of ketone bodies in RG2 and 9L gliomas without affecting tumor growth. Neuro-Oncol. 2016;18:1079–1087. doi: 10.1093/neuonc/now088.
2. Lebon V, Petersen KF, Cline GW, Shen J, Mason GF, Dufour S, Behar KL, Shulman GI, Rothman DL. Astroglial Contribution to Brain Energy Metabolism in Humans Revealed by 13C Nuclear Magnetic Resonance Spectroscopy: Elucidation of the Dominant Pathway for Neurotransmitter Glutamate Repletion and Measurement of Astrocytic Oxidative Metabolism. J. Neurosci. 2002;22:1523–1531.
3. Gulanski BI, De Feyter HM, Page KA, Belfort-DeAguiar R, Mason GF, Rothman DL, Sherwin RS. Increased Brain Transport and Metabolism of Acetate in Hypoglycemia Unawareness. J. Clin. Endocrinol. Metab. 2013;98:3811–3820. doi: 10.1210/jc.2013-1701.
4. Lu M, Zhu X-H, Zhang Y, Mateescu G, Chen W. Quantitative assessment of brain glucose metabolic rates using in vivo deuterium magnetic resonance spectroscopy. J. Cereb. Blood Flow Metab. 2017:0271678X17706444. doi: 10.1177/0271678X17706444.
Figures