0632
Assessing Tumor Hypoxia Based on Hypoxic Gas Breathing1Radiology, UT Southwestern Medical Center, Dallas, TX, United States
Synopsis
Tumor response to hypoxic gas breathing challenge was explored using oxygen-sensitive MRI in rat 13762NF breast tumors and compared with the more conventional hyperoxic gas breathing challenge. In viable tumor regions, blood oxygenation decreased with 16% O2 breathing (demonstrated by an increase in R2*). A unique “on-and-off” pattern in T1-weighted signal intensity, which was closely related to tumor hypoxia level, was triggered by 16% O2 breathing but not 100% O2 breathing. When combined with hypoxic gas breathing, oxygen-sensitive MRI may reveal tumor hypoxia threshold, which is important for assessing the efficacy of hypoxia-activated prodrugs.
Introduction
Hypoxia-activated prodrugs are designed to release therapeutic effects in tumor regions that are below a certain hypoxia threshold.1 The preclinical development of these prodrugs demands imaging biomarkers that can reveal hypoxia threshold(s) in a given tumor model. Oxygen-sensitive MRI has been extensively used in studying tumor response to hyperoxic gas breathing.2-5 On the other hand, tumor response to hypoxic gas breathing is less explored, but may be more relevant in assessing the efficacy of hypoxia-activated prodrugs in a preclinical setting. Herein, we analyze the unique pattern in BOLD (blood-oxygen-level-dependent) and TOLD (tissue-oxygen-level-dependent) parameters triggered by hypoxic gas breathing in a breast tumor model to test its application in tumor hypoxia thresholding.Methods
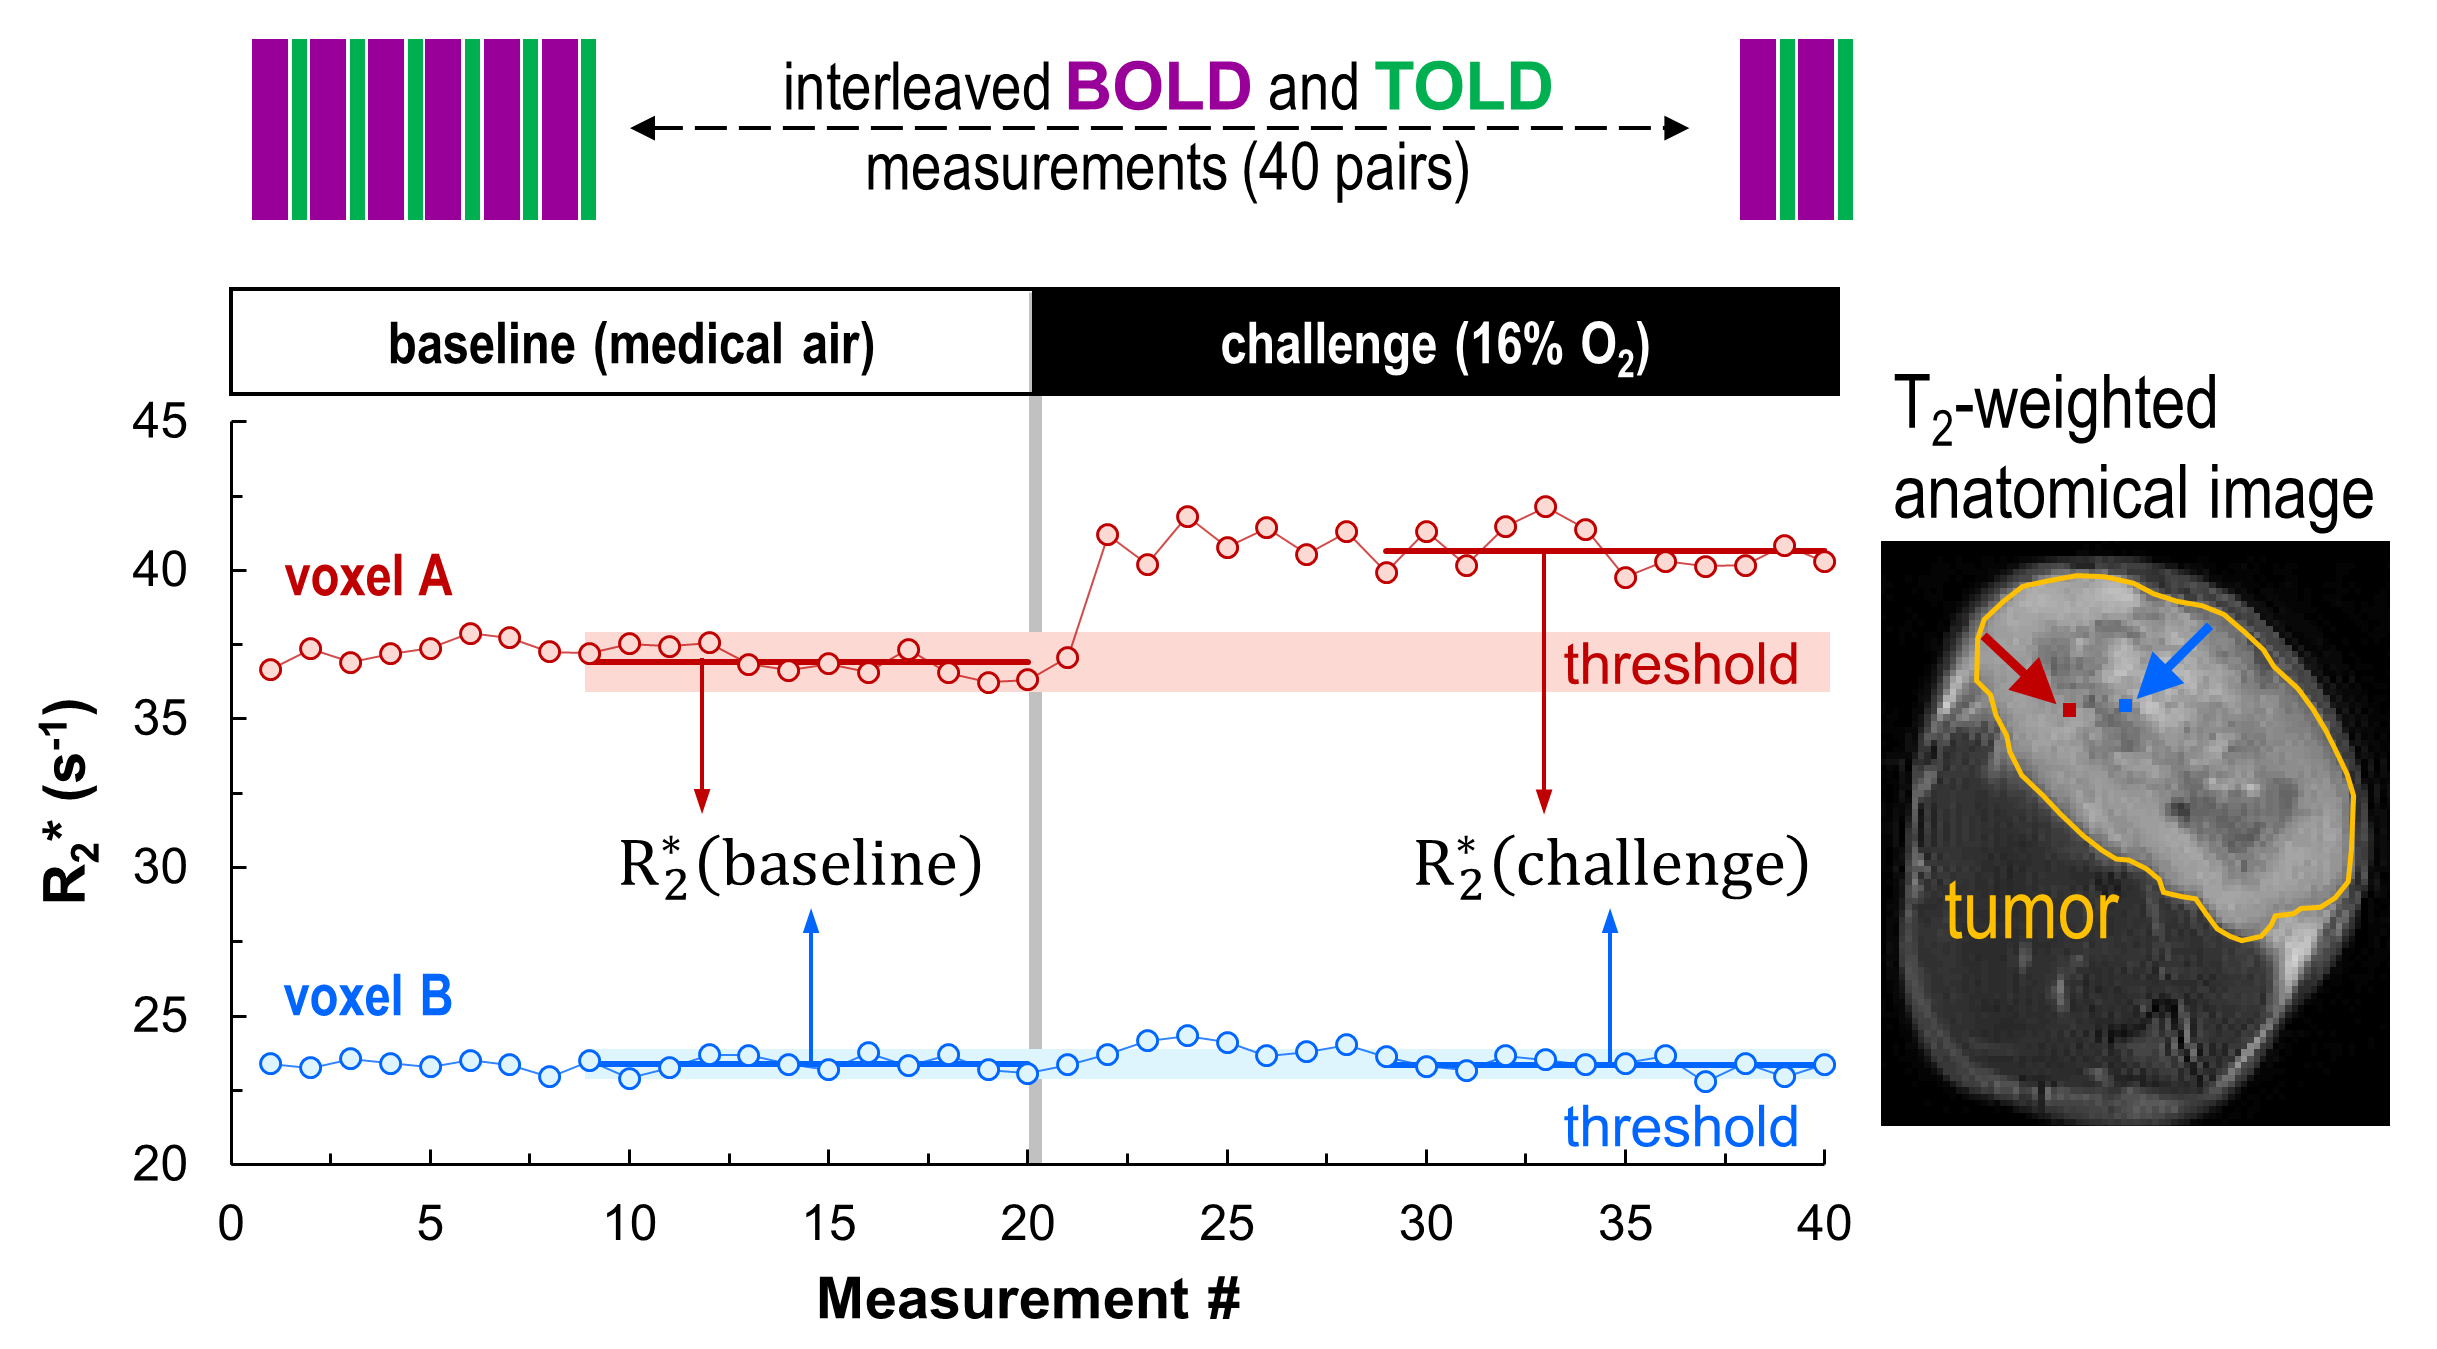
Rat 13762NF tumors (subcutaneous in the thigh of Fischer rats) were allowed to grow to small (< 2 cm3; n = 8) and large (> 2 cm3; n = 7) volumes. Interleaved BOLD (multi-gradient-echo R2* mapping) and TOLD (T1-weighted, gradient-echo imaging) measurements at 4.7 T were performed with gas breathing challenge using 16% O2 (gbc16; Fig. 1). For six randomly selected tumors, the same MRI experiment was performed with gas breathing challenge using 100% O2 (gbc100) on the day before conducting the gbc16 experiment. The image plane was located at the tumor center (2-mm thickness; 0.2 x 0.2 mm2/pixel resolution; 128 x 128 pixels). In each voxel, the baseline temporal standard deviation in R2* and T1-weighted signal intensity (T1w SI), respectively, was used as the criterion to classify the tumor response to a respiratory challenge (Fig. 1). T1w SI was corrected for T2*-weighted signal decay using the voxel-wise R2* determined at each time point.Results
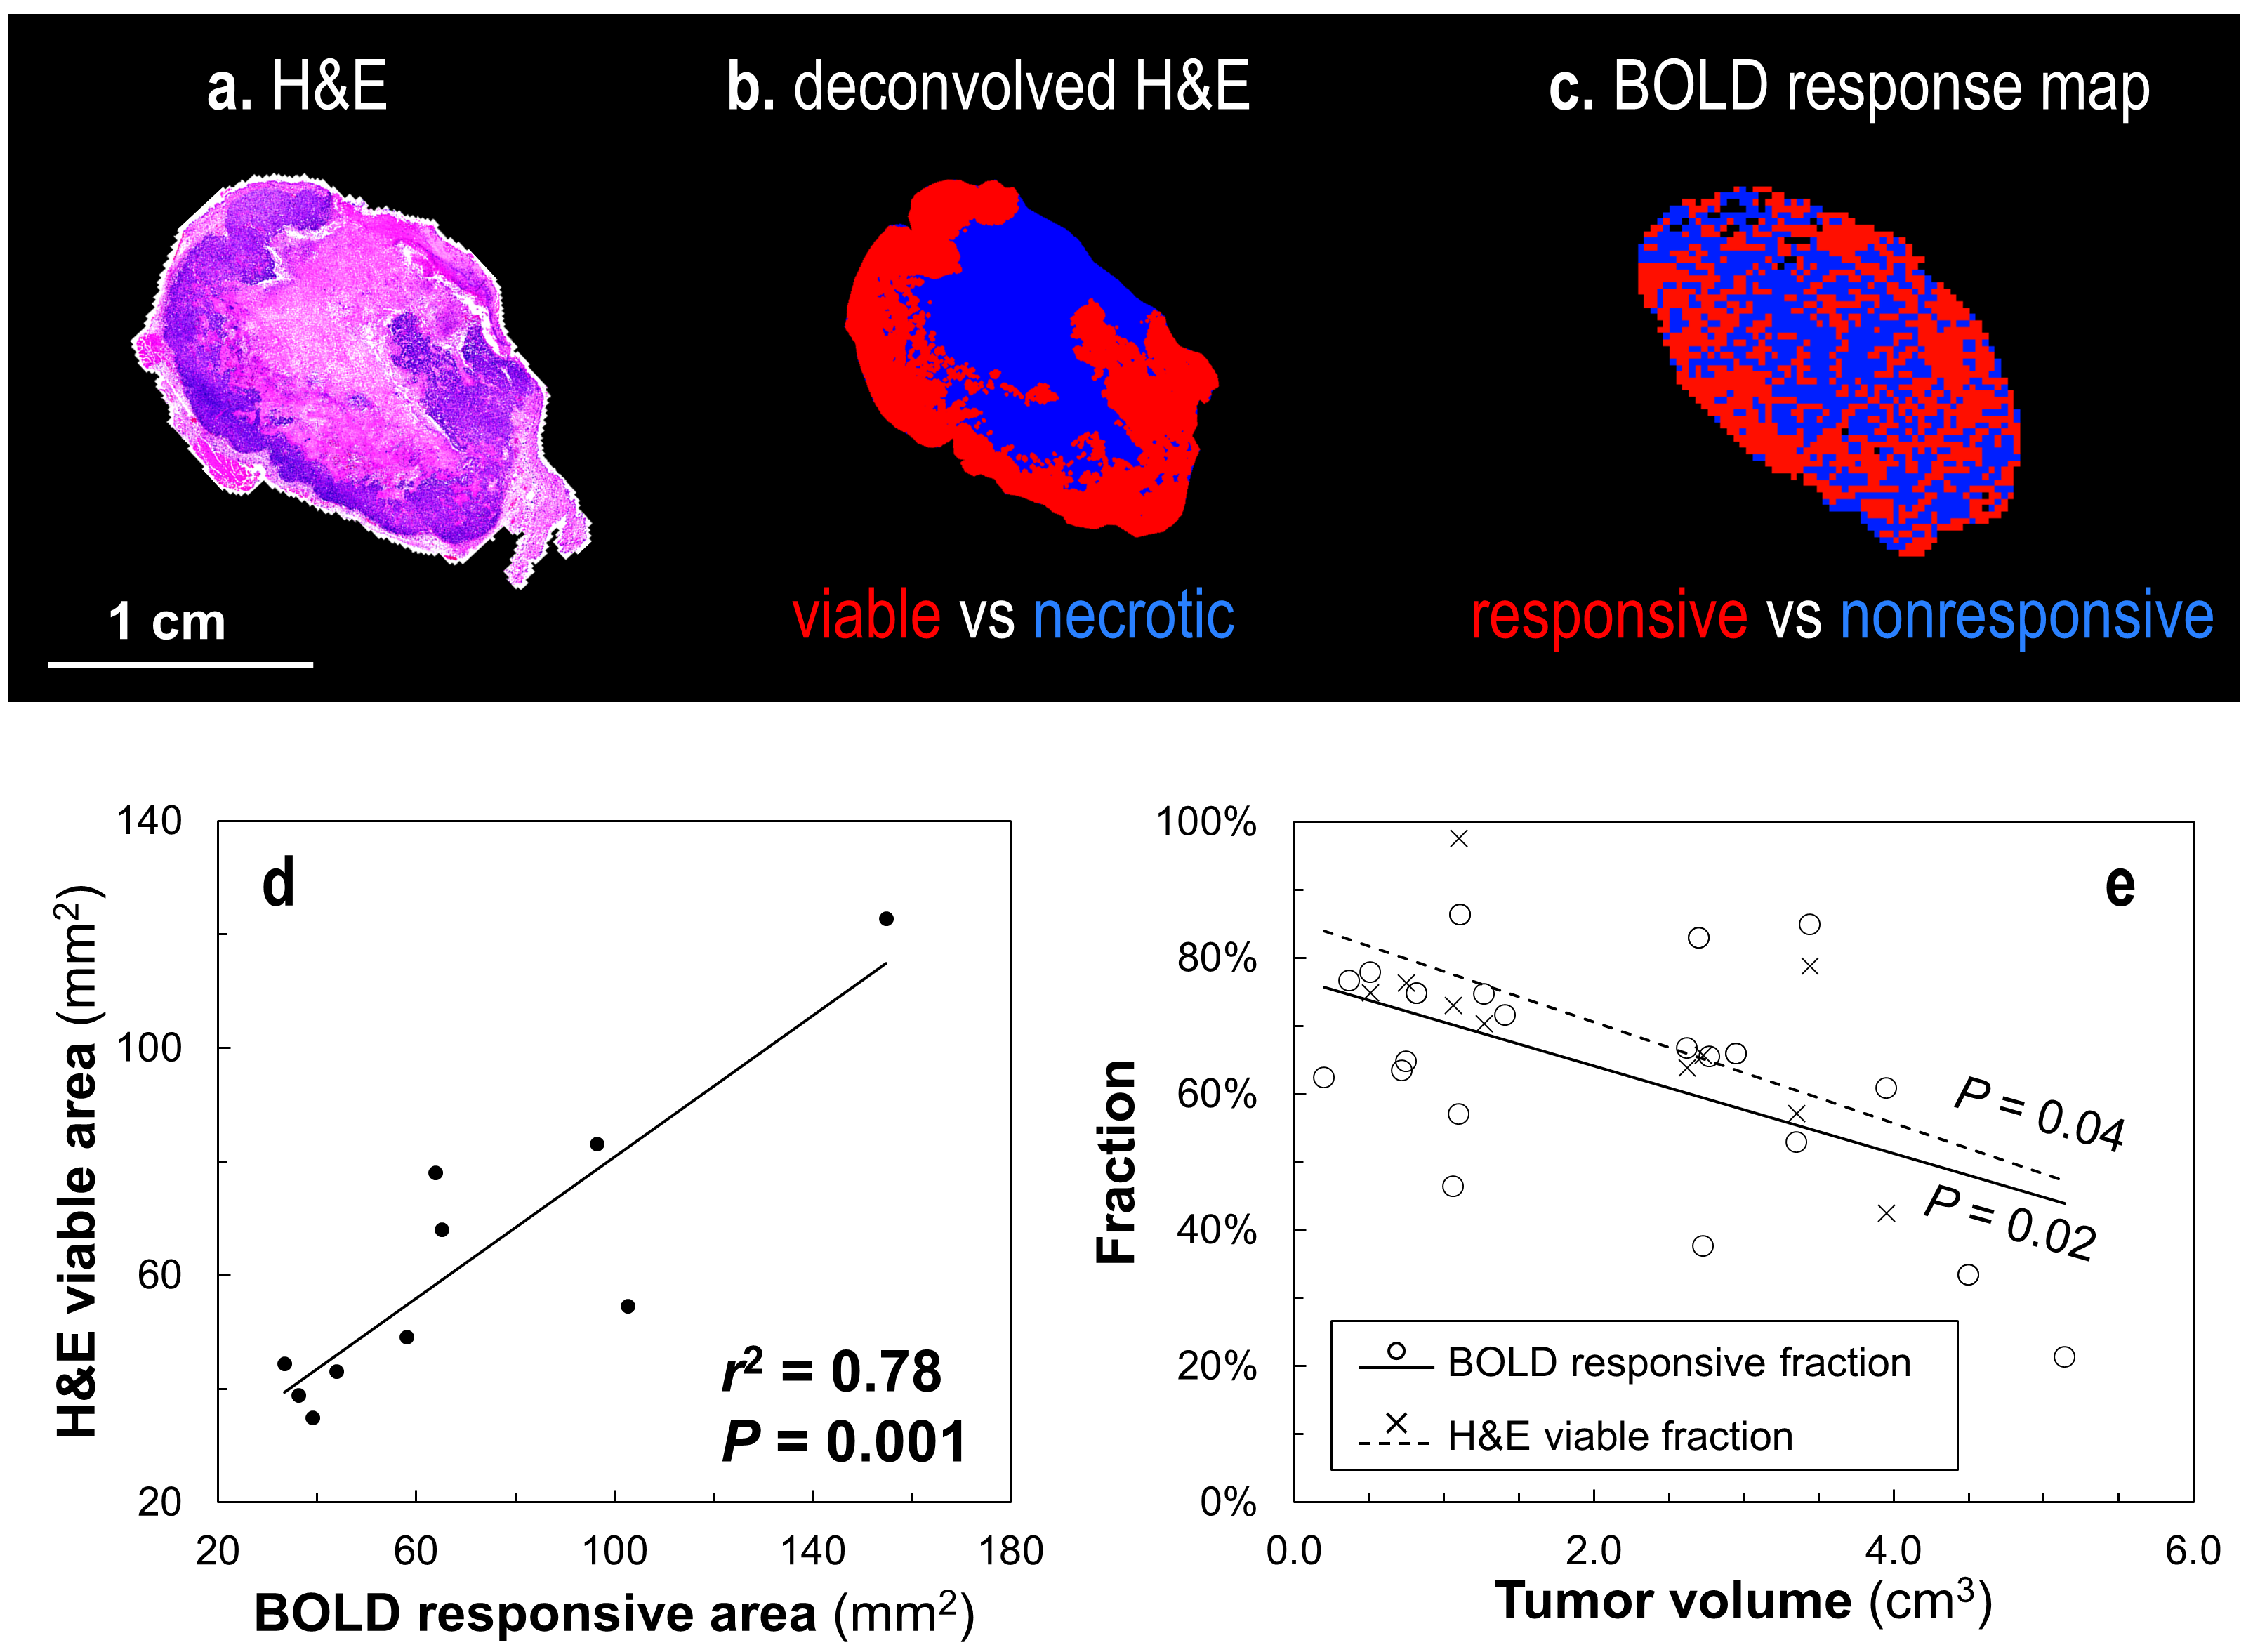
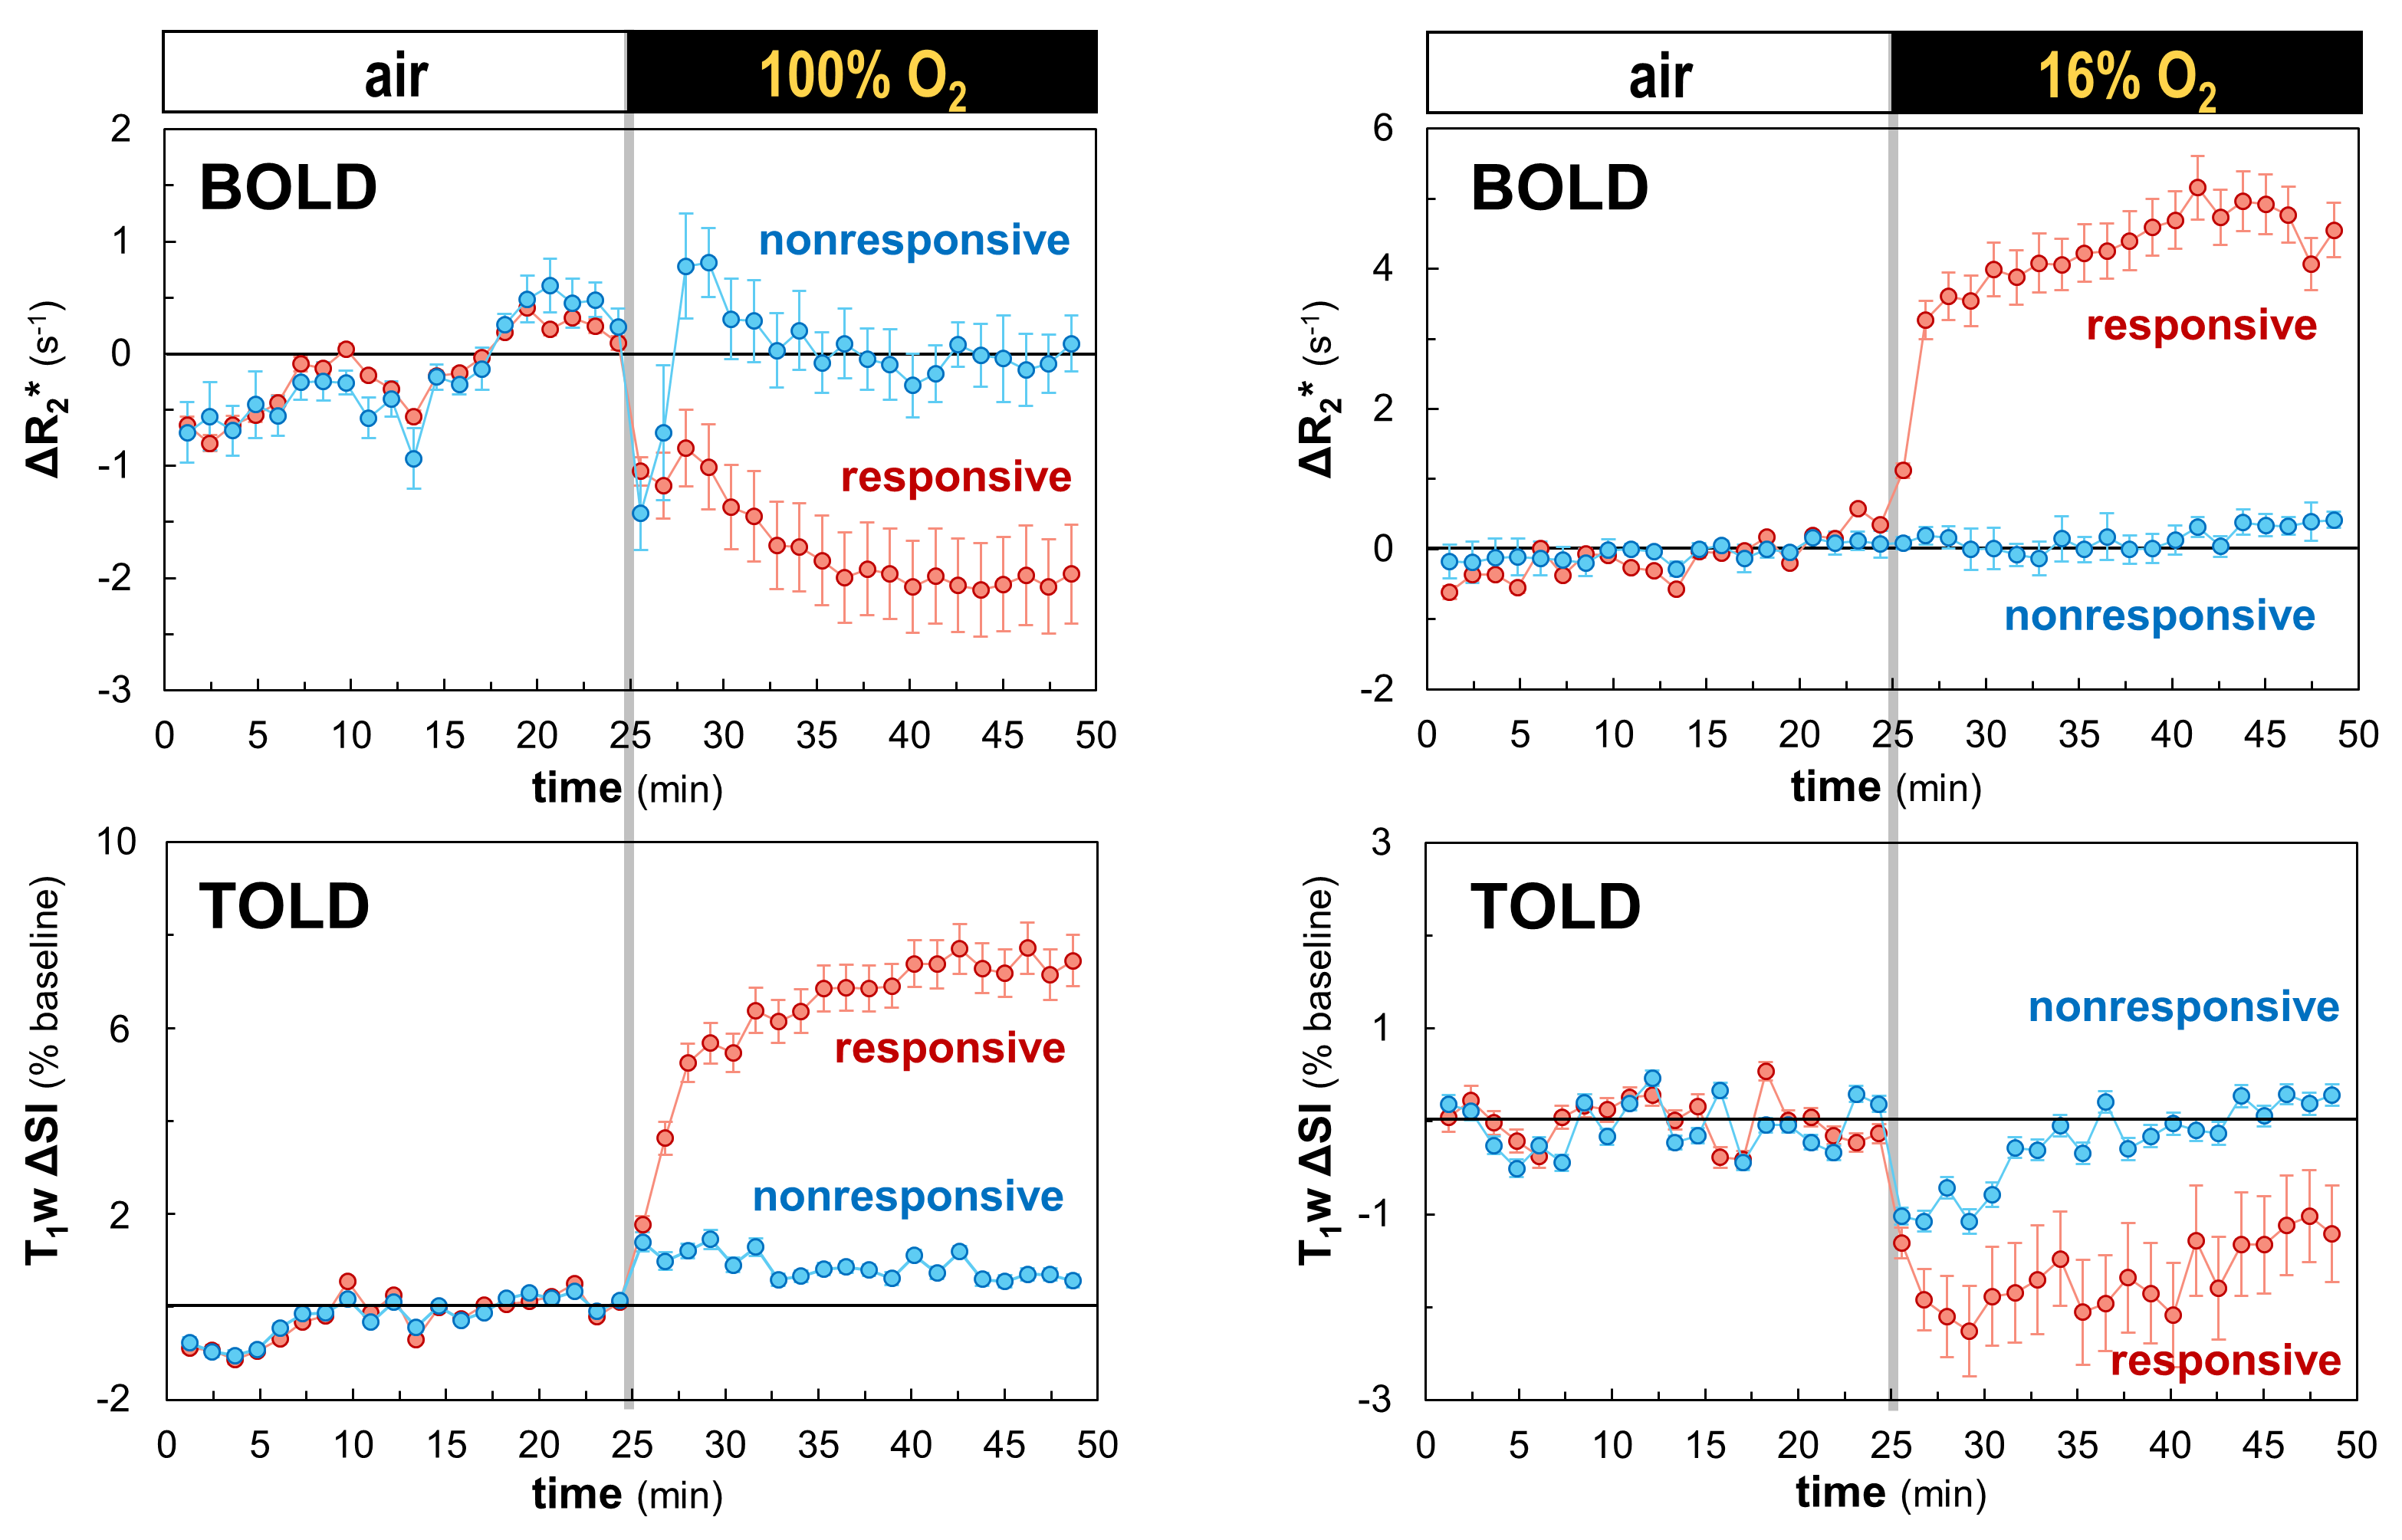
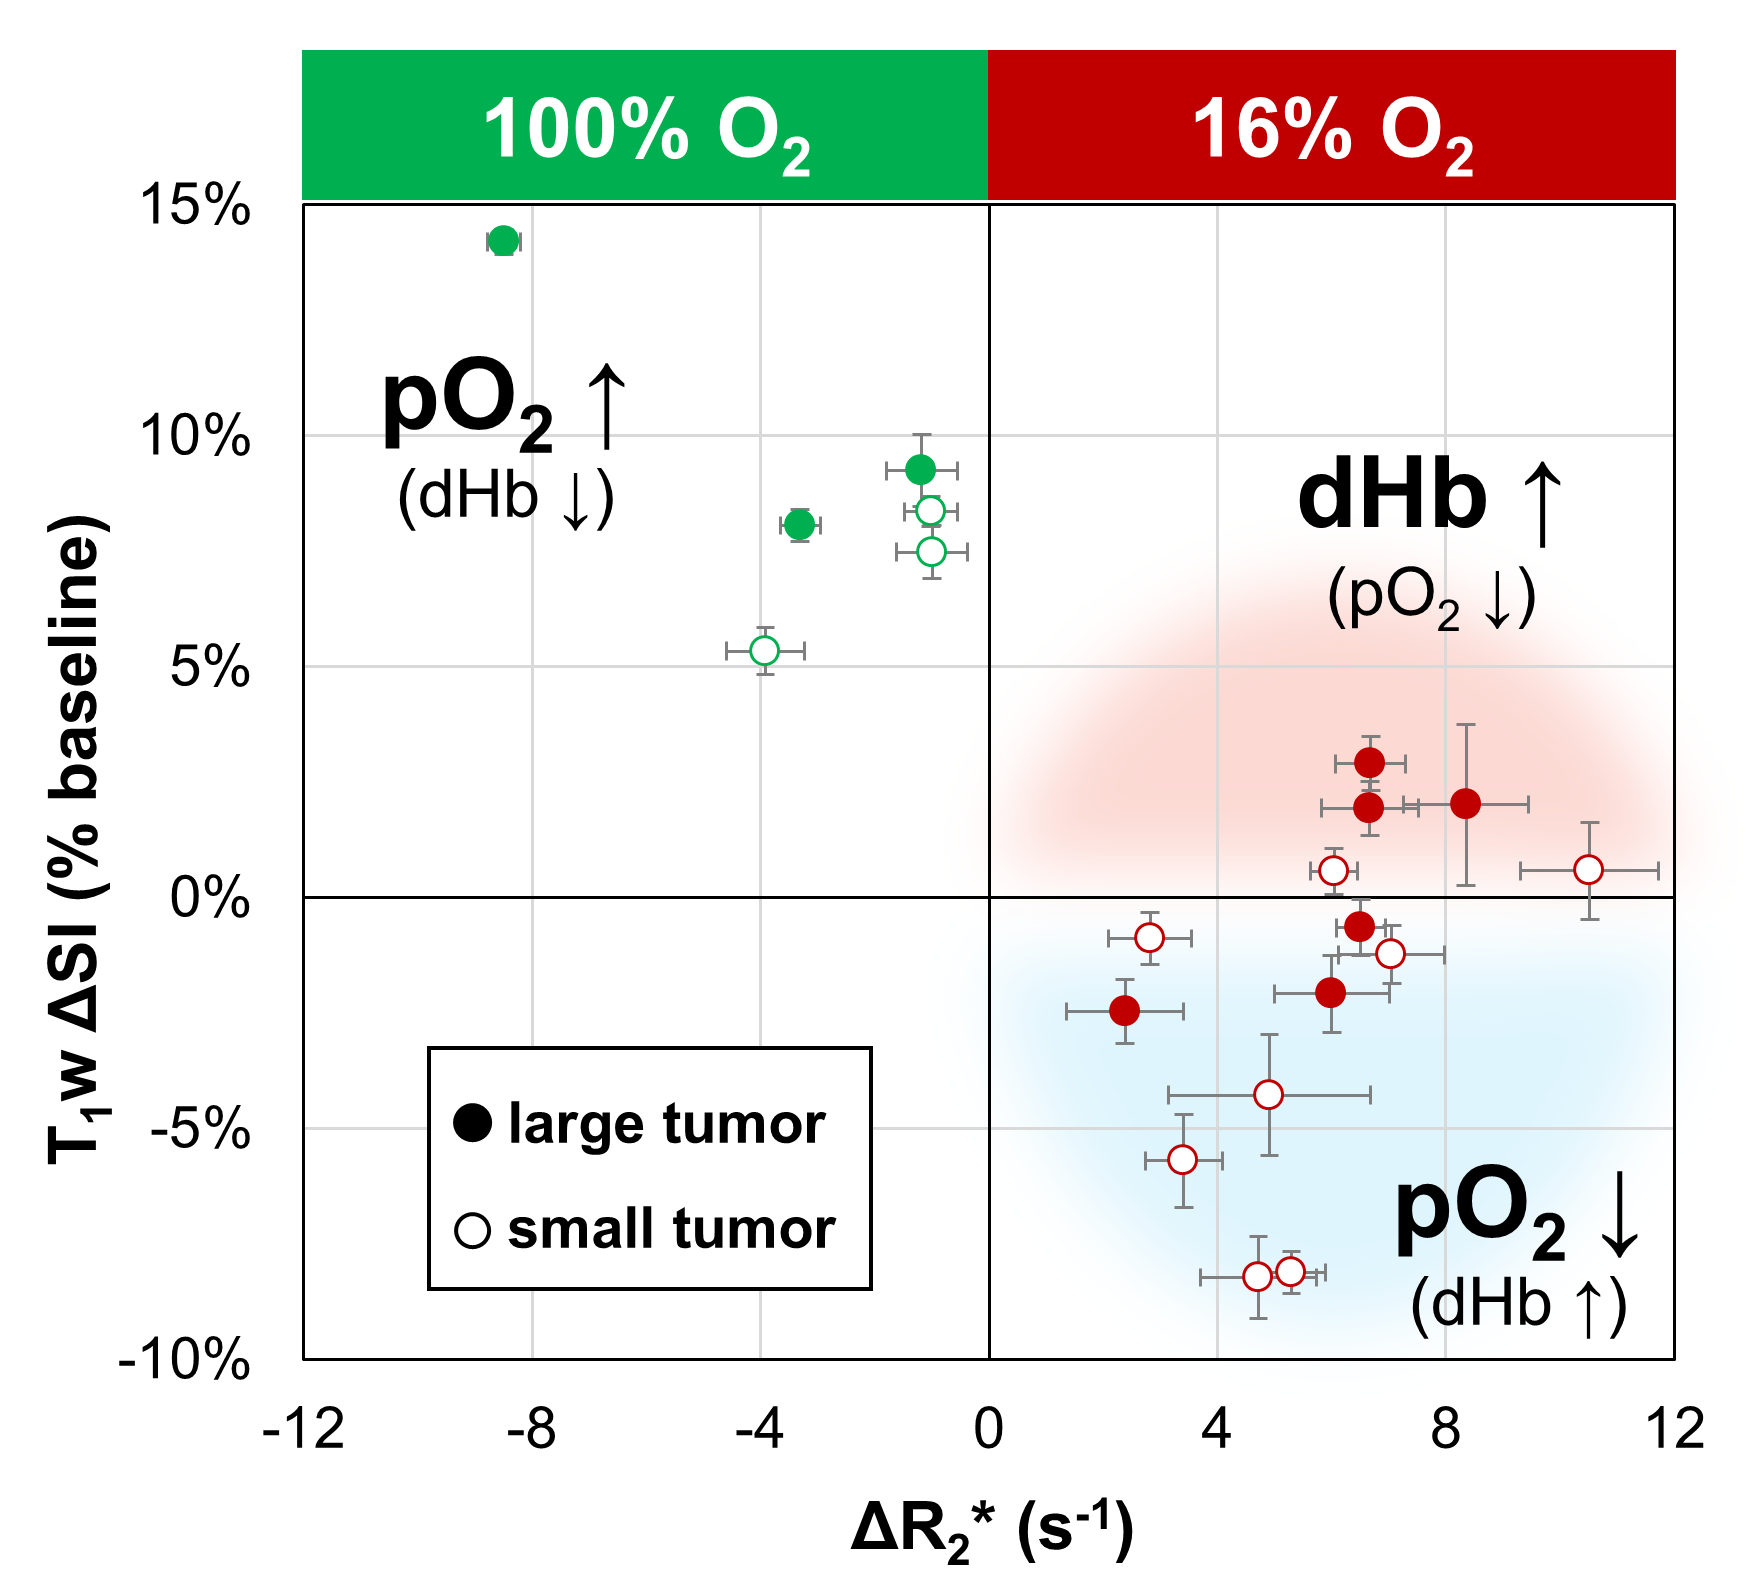
The tumor subregions that were responsive to gbc16 (based on R2* time course) corresponded with the viable tumor area determined by H&E staining (Fig. 2a–d). Both the BOLD responsive fraction (R2*-based) and H&E-based viable tumor fraction decreased with increasing tumor volume (Fig. 2e). Representative time courses for BOLD and TOLD parameters during gbc16 and gbc100, respectively, are shown in Fig. 3. In the BOLD-TOLD dual responsive area, R2* increased for gbc16 and decreased for gbc100 (Fig. 4a; Fig.5); T1w SI increased for gbc100, but decreased for gbc16 only in the group of small tumors (Fig. 4b). Tumor response with gbc16 along the T1w SI dimension was binary and dependent on tumor size (Fig. 5). Pimonidazole staining indicates that the tumor hypoxic fraction increased by approximately 20% following 16% O2 breathing.Discussion
The analysis of intratumoral heterogeneity is important for effective tumor characterization.6 Herein, BOLD responsive area was identified by a substantial R2* change triggered by the challenge gas (Fig. 1), which indicates sufficient vascular perfusion in the area. The correlation between this R2*-based responsive area and the histology-based viable tumor area (Fig. 2d) highlights the connection between intratumoral functional and structural heterogeneity. Under typical conditions, tumor TOLD (T1w SI) response is dominated by the change in local pO2 (balanced by blood oxygen supply and metabolic consumption).2 However, in a severely hypoxic region, deoxyhemoglobin in the blood may also contribute significantly to T1w SI, while the contribution of pO2 is suppressed due to the limited amount of molecular O2 present. This condition may be intensified with hypoxic gas breathing. In the tumor responsive area, breathing 100% O2 increased blood and tissue oxygenation, resulting in a commonly observed pattern in BOLD and TOLD parameters.2-5 For 16% O2 breathing, however, TOLD response was binary and tumor volume dependent (Fig. 4). A previous report of 19F oximetry in the same tumor model and similar volume range showed that tumor (baseline) pO2 decreased with increasing tumor volume.7 Therefore, for large tumors with hypoxic gas breathing, the lack of T1w SI decrease (and even the presence of T1w SI increase; Fig. 5) may signal an R1 relaxation “regime turnover” under severely hypoxic condition: the increase in blood deoxyhemoglobin (indicated by increased R2*) outweighed the limited decrease in the intrinsically low pO2. The direction and degree of T1w SI change following hypoxic gas breathing can be used as threshold(s) for differentiating normoxic / moderate hypoxic tumors from severely hypoxic tumors. Importantly, this thresholding potential was not observed in the hyperoxic gas breathing challenge, demonstrating the unique role of hypoxic gas breathing in the preclinical evaluation of tumor hypoxia.Conclusion
Hypoxic gas breathing activates unique and important characteristics in BOLD and TOLD parameters with regard to tumor hypoxia. The combination of oxygen-sensitive MRI and hypoxic gas breathing challenge outlines a framework for detecting tumor hypoxia threshold(s) and evaluating the therapeutic efficacy of hypoxia-level-sensitive prodrugs.Acknowledgements
Supported in part by CPRIT RP140399, NIH 1P30-CA142543 and P41-EB015908.
References
1. Hunter, F. W.; Wouters, B. G.; Wilson, W. R., Hypoxia-activated prodrugs: paths forward in the era of personalised medicine. Brit J Cancer 2016, 114 (10), 1071-1077.
2. Remmele, S.; Mason, R. P.; O’Connor, J. P. B., MRI hypoxia measurements. In Functional Imaging in Oncology, Springer Berlin Heidelberg: 2014.
3. Hallac, R. R.; Zhou, H. L.; Pidikiti, R.; Song, K.; Stojadinovic, S.; Zhao, D. W.; Solberg, T.; Peschke, P.; Mason, R. P., Correlations of noninvasive BOLD and TOLD MRI with pO2 and relevance to tumor radiation response. Magnet Reson Med 2014, 71 (5), 1863-1873.
4. Zhao, D. W.; Pacheco-Torres, J.; Hallac, R. R.; White, D.; Peschke, P.; Cerdan, S.; Mason, R. P., Dynamic oxygen challenge evaluated by NMR T1 and T2* - insights into tumor oxygenation. NMR Biomed 2015, 28 (8), 937-947.
5. White, D. A.; Zhang, Z.; Li, L.; Gerberich, J.; Stojadinovic, S.; Peschke, P.; Mason, R. P., Developing oxygen-enhanced magnetic resonance imaging as a prognostic biomarker of radiation response. Cancer Lett 2016, 380 (1), 69-77.
6. O'Connor, J. P. B.; Rose, C. J.; Waterton, J. C.; Carano, R. A. D.; Parker, G. J. M.; Jackson, A., Imaging intratumor heterogeneity: role in therapy response, resistance, and clinical outcome. Clin Cancer Res 2015, 21 (2), 249-257.
7. Song, Y. L.; Constantinescu, A.; Mason, R. P., Dynamic breast tumor oximetry: the development of prognostic radiology. Technol Cancer Res T 2002, 1 (6), 471-478.
Figures