0631
Imaging the Interplay of Tumor Vascularity, Hypoxia, pHe, and Lactate1Memorial Sloan Kettering Cancer Center, New York, NY, United States, 2Ulsan National Institute of Science and Technology, Ulsan, Republic of Korea, 3Sylverster Comprehensive Cancer Center, Miller School of Medicine University of Miami, Miami, FL, United States
Synopsis
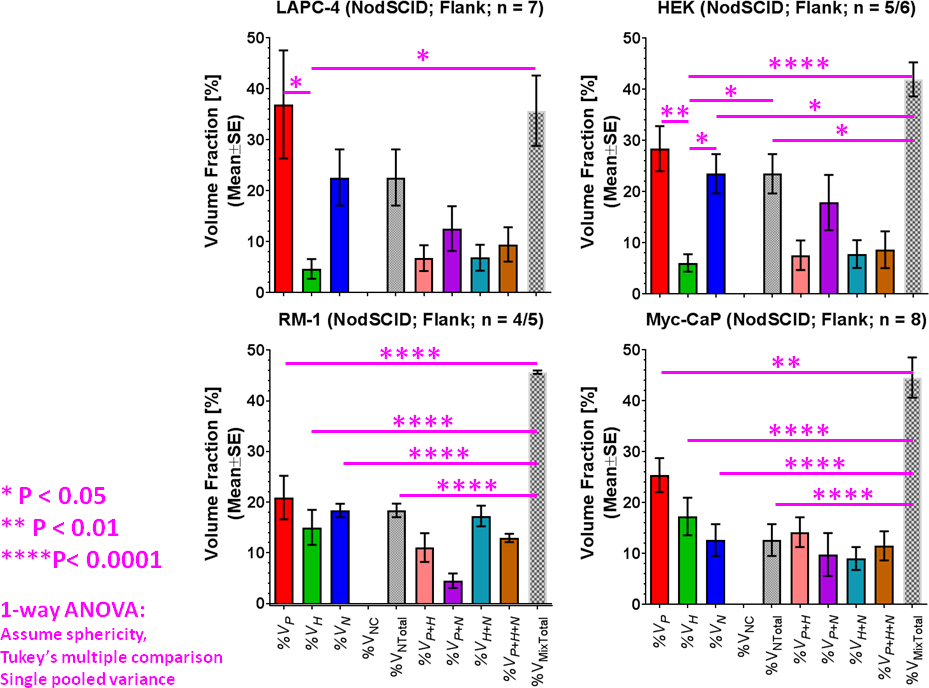
We characterized tumor vascularity, extracellular pH (pHe), and tumor lactate in various tumor models, focusing on prostate cancer. Spatial mapping demonstrated that vascular blood flow and permeability varied significantly in well-vascularized regions across tumor models and that the fraction of tumor necrosis was higher in the human than the murine models. The spatially most heterogeneous tumor type was characterized by the lowest lactate, a pHe of ~7.1 in well-vascularized regions, with lower pHe in less vascularized regions, and increasing lactate with decreasing vascular blood flow and permeability.
Purpose
We imaged in various tumor models tumor vascularity, extracellular pH (pHe), and whole-tumor and localized lactate to characterize tumor microenvironments that have been proposed as markers to identify aggressive, treatment-resistant tumors1, with high tumor lactate proposed to contribute to a suppressed T-cell immune response2.Methods
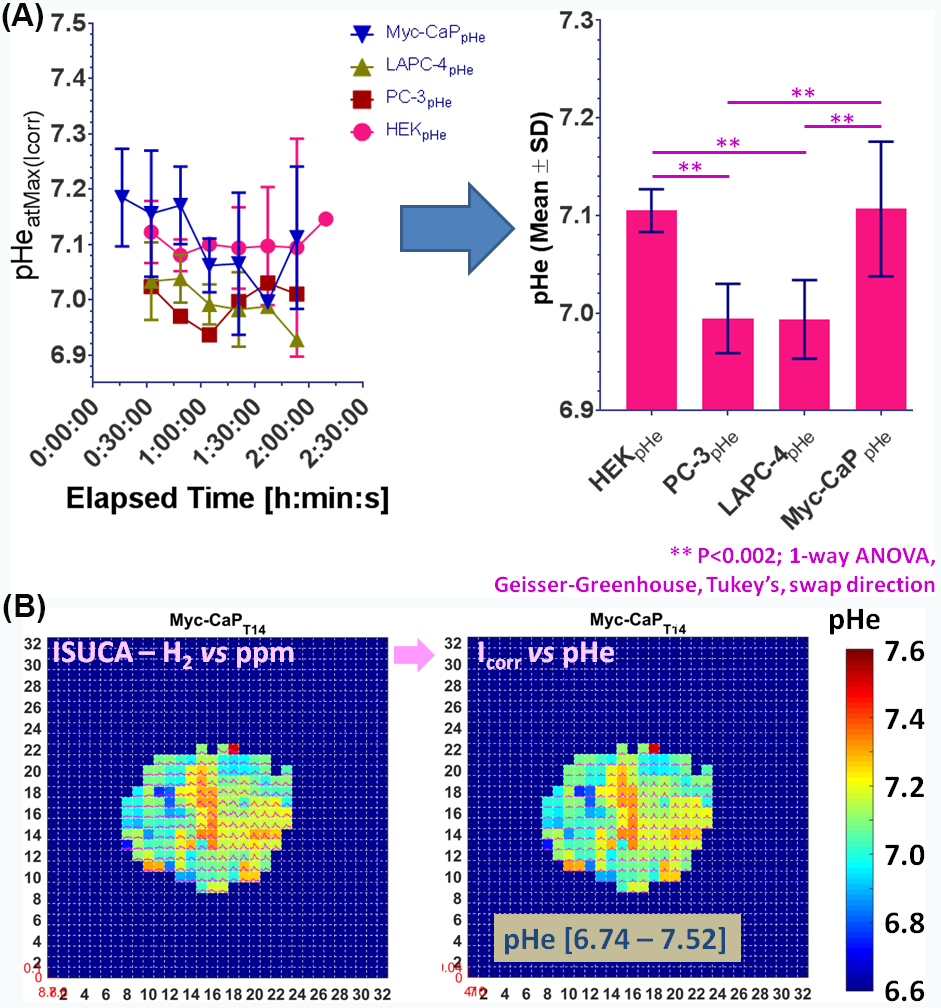
All in vivo MR experiments were performed as described previously3, 4, in accordance with institutional animal care and use committee protocols. Briefly, the tumorigenic human embryonic kidney (HEK) cell line, 2 human prostate cancer (CaP) cell lines LAPC-4 (human advanced prostate adenocarcinoma, kindly provided by Dr. Sawyer5) and PC-3 (bone metastasis of human grade IV prostate adenocarcinoma6), as well as the 2 murine CaP cell lines MycCaP (spontaneously immortalized cells from C-Myc transgenic mouse with CaP, androgen naïve7) and RM-1 (CaP of Ras+Myc-transformed C57BL/6 mouse8) were implanted subcutaneously in the flank of immune-compromised, male Nod/SCID mice. Using a custom-built, solenoid 1H MR coil in a horizontal-bore 7T MR spectrometer (Bruker Biospin) and after tumor positioning of the anesthetized, catheterized mouse, the MR coil was tuned and matched to 1H frequency and the water line width shimmed to ~30-70 Hz full-width-half-maximum. The mouse temperature and breathing rate were maintained at 34-37°C and 50-90 breaths/min, respectively during the experiment. Tumor lactate (Single-slice, Localized with 2 mm x 2 mm in-plane resolution) was acquired using SelMQC9, with slice thickness varied to cover entire tumor. Lactate spectra were processed and fitted in XsOsNMR and lactate quantified by substitution method10-12, as described previously3, 13. Tumor vascularity was assessed after lactate MRS by dynamic contrast-enhanced (DCE)-MRI with the contrast agent gadopentetate dimeglumine (Gd-DTPA)14 at 117.2 µm x 117.2 µm in-plane resolution and 5-7 1-mm-thick slices. Spatial vascular heterogeneity with associated tumor microenvironments was quantified using unsupervised pattern recognition15, 16. Vascular blood flow and permeability (Akep) were quantified from signal-time curves using the Hoffman17 model. Extracellular pH (pHe) was measured as described4, 18 by infusion of the pHe marker ISUCA at 0.6 mmol/kg for 20 min, followed by 0.4 mmol/kg for 90 min. Accumulation of ISUCA and pHe distributions in a well-vascularized tumor area were measured by serial single-voxel 1H MR PRESS4, 18. In selected tumors with significant, detectable ISUCA, pHe maps were acquired by CSI PRESS4, 18. After data processing with XsOsNMR and MNova, a home-built Matlab program was used to convert the chemical shift δ of the ISUCA-H2 resonance (with reference to total choline at 3.2 ppm) to pHe using the ISUCA-specific Henderson Hasselbalch equation: pHe = 7.07 + log[(8.7459-δ)/(δ-7.679)]4, 18, including signal intensity correction to account for the non-linearity of the ppm-to-pH conversion19.Results & Discussion
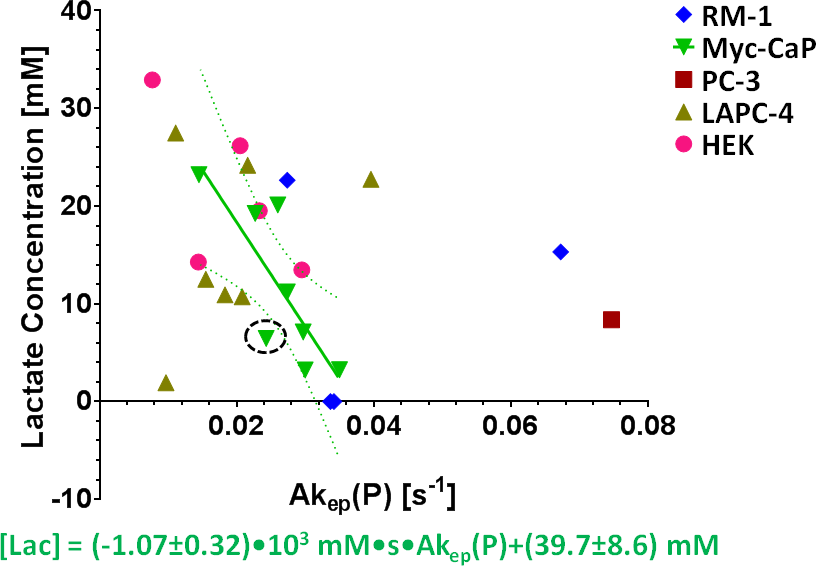
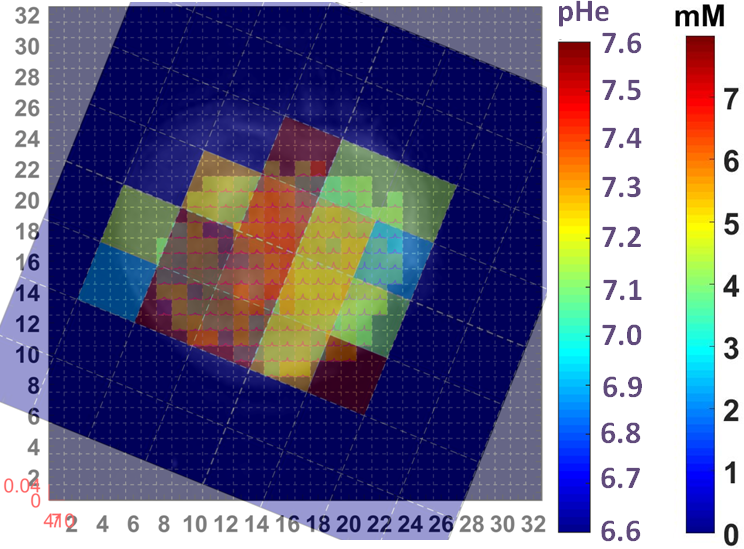
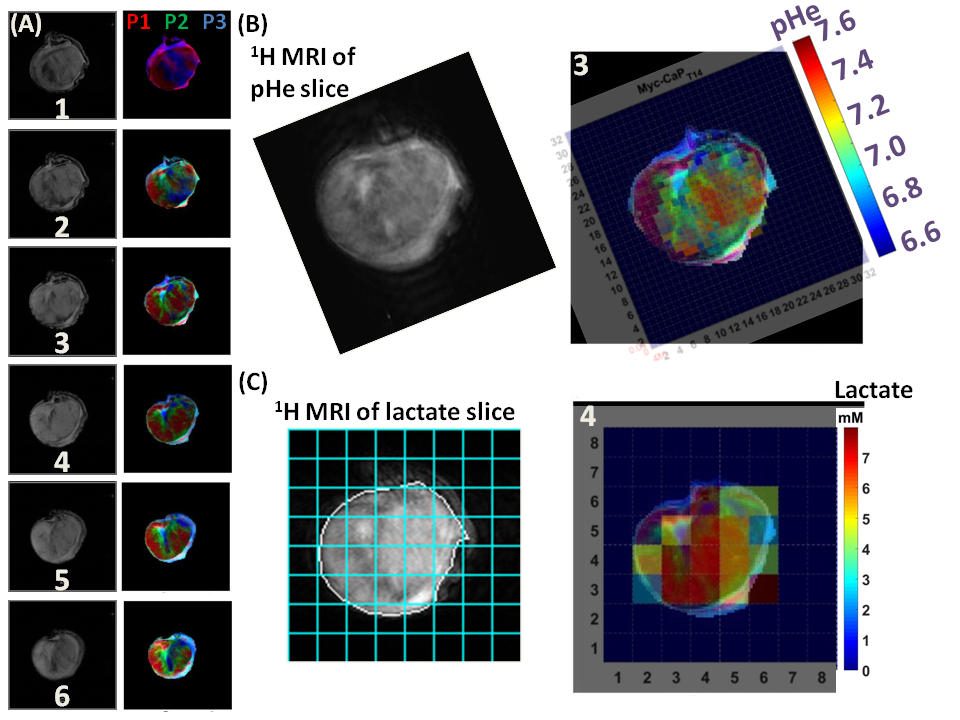
By using signal enhancement less than 4x the standard deviation of the pre-contrast signal15, instead of less than 25% of maximum signal enhancement16 to identify non-enhancing pixels, low-contrast pixels are now included in the spatial characterization of tumor vascularity (Figure 1, PC-3 (n=2) not shown). The human tumor models have higher necrotic and lower hypoxic fractions than the murine models (Figure 1). As before3, Akep in necrotic areas is less than in hypoxic areas which is less than in well-vascularized areas (data not shown). While Akep of necrotic and hypoxic areas is similar across tumor types, Akep of well-vascularized regions varies significantly between tumor types (data not shown). The pHe in well-vascularized tumor voxels remained stable over the infusion time (Figure 2A). The average pHe in vascularized tumor regions is significantly higher in HEK and Myc-CaP than in PC-3 and LAPC-4 tumors (Figure 2A). However, pHe values across a tumor may vary widely (Figure 2B). No reliable pHe data could be obtained for RM-1 tumors, in line with the caveat that ISUCA could only be detected in tumors with sufficient functional vasculature (12 tumors of 19 attempted tumors and 10 tumors not attempted based on qualitative DCE-MRI results = 41% success rate). For Myc-CaP tumors, the lactate concentration is linearly related to Akep of well-vascularized tumor areas (Figure 3). No direct relationship between mapped pHe and lactate could be observed qualitatively (Figure 4). Comparing qualitatively mapped pHe and lactate with vascular maps, it appears that less perfused/hypoxic areas have lower pHe and that lactate decreases with increased perfusion (Figure 5), consistent with the data shown in Figure 3.Conclusions
We demonstrated the ability and advantage of mapping tumor vascularity, lactate and pHe to assess their interplay. In the spatially most heterogeneous tumor model, we found: (i) lactate decreased with increased vascular blood flow and permeability; (ii) as seen by spatial mapping, pHe appeared not to directly relate to lactate, while being lower in less perfused/hypoxic tumor regions.Acknowledgements
Supported by NIH / NCI grants R01 CA163980 (RGB, VP), R01 CA172846 (RGB, JAK), R24 CA083084 (SAI Core), and P30 CA008748 (Cancer Center Support Grant).
We like to thank Dr. Sebastian Cerdan for his advice on pHe MRS with ISUCA, Dr. Rui V Simões for his contribution to the coil building, as well as Dr. Dikoma C. Shungu and Ms. X. Mao for providing the XsOsNMR software.
References
- Vaupel P. Tumor microenvironmental physiology and its implications for radiation oncology. Semin Radiat Oncol. 2004. Jul; 14(3):198-206.
- Calcinotto A, Filipazzi P, Grioni M, Iero M, De Milito A, Ricupito A, Cova A, Canese R, Jachetti E, Rossetti M, Huber V, Parmiani G, Generoso L, Santinami M, Borghi M, Fais S, Bellone M, Rivoltini L. Modulation of microenvironment acidity reverses anergy in human and murine tumor-infiltrating T lymphocytes. Cancer Res. 2012. Jun 1; 72(11):2746-56.
- Ackerstaff E, Kruchevsky N, Moroz E, LeKaye HC, Zakian KL, Han S, Cho H, Stoyanova RS, Ramamonjisoa N, Serganova IS, Blasberg RG, Koutcher JA. Imaging of the Tumor Type-specific Microenvironment in Preclinical Cancer Models of Varying Malignancy. #307. 25th Annual Meeting of the International Society for Magnetic Resonance in Medicine; 22-27 April, 2017; Honolulu, Hawai'i.
- Ackerstaff E, Kruchevsky N, Moroz E, Ramamonjisoa N, Simões RV, Lekaye HC, Zakian KL, Lee H, Cho H, Stoyanova R, Serganova IS, Blasberg RG, Koutcher JA. Assessment of the Tumor Type-Specific Microenvironment – Lactate, Vascularity, Hypoxia, Extracellular pH. #45. 22th Scientific Meeting & Exhibition of the International Society for Magnetic Resonance in Medicine; May 10 – 16, 2014; Milano, Italy.
- Craft N, Shostak Y, Carey M, Sawyers CL. A mechanism for hormone-independent prostate cancer through modulation of androgen receptor signaling by the HER-2/neu tyrosine kinase [see comments]. Nat Med. 1999; 5(3):280-5.
- Webber MM, Bello D, Quader S. Immortalized and tumorigenic adult human prostatic epithelial cell lines: characteristics and applications. Part I. Cell markers and immortalized nontumorigenic cell lines. Prostate. 1996. Dec; 29(6):386-94.
- Watson PA, Ellwood-Yen K, King JC, Wongvipat J, Lebeau MM, Sawyers CL. Context-dependent hormone-refractory progression revealed through characterization of a novel murine prostate cancer cell line. Cancer Res. 2005. Dec 15; 65(24):11565-71.
- Baley PA, Yoshida K, Qian W, Sehgal I, Thompson TC. Progression to androgen insensitivity in a novel in vitro mouse model for prostate cancer. J Steroid Biochem Mol Biol. 1995. May; 52(5):403-13.
- He Q, Shungu DC, van Zijl PC, Bhujwalla ZM, Glickson JD. Single-scan in vivo lactate editing with complete lipid and water suppression by selective multiple-quantum-coherence transfer (Sel-MQC) with application to tumors. J Magn Reson B. 1995. Mar; 106(3):203-11.
- Serganova I, Rizwan A, Ni X, Thakur SB, Vider J, Russell J, Blasberg R, Koutcher JA. Metabolic imaging: a link between lactate dehydrogenase A, lactate, and tumor phenotype. Clin Cancer Res. 2011. Oct 1; 17(19):6250-61.
- Danielsen ER, Michaelis T, Ross BD. Three methods of calibration in quantitative proton MR spectroscopy. J Magn Reson B. 1995. Mar; 106(3):287-91.
- Soher BJ, van Zijl PC, Duyn JH, Barker PB. Quantitative proton MR spectroscopic imaging of the human brain. Magn Reson Med. 1996. Mar; 35(3):356-63.
- Ackerstaff E, Ramamonjisoa N, Lekaye HC, Zakian KL, Moroz E, Serganova IS, Blasberg RG, Koutcher JA. Similarity of in vivo lactate T1 and T2 relaxation times in different preclinical cancer models facilitates absolute quantification of lactate. #2782. 24th Scientific Meeting & Exhibition of the International Society for Magnetic Resonance in Medicine; May 07 – 13, 2016; Singapore, Singapore.
- Cho H, Ackerstaff E, Carlin S, Lupu ME, Wang Y, Rizwan A, O'Donoghue J, Ling CC, Humm JL, Zanzonico PB, Koutcher JA. Noninvasive multimodality imaging of the tumor microenvironment: registered dynamic magnetic resonance imaging and positron emission tomography studies of a preclinical tumor model of tumor hypoxia. Neoplasia. 2009. Mar; 11(3):247-59, 2p following 259.
- Han S, Stoyanova R, Lee H, Carlin SD, Koutcher JA, Cho H, Ackerstaff E. Automation of pattern recognition analysis of dynamic contrast-enhanced MRI data to characterize intratumoral vascular heterogeneity. Magn Reson Med. 2017. Jul 20.
- Stoyanova R, Huang K, Sandler K, Cho H, Carlin S, Zanzonico PB, Koutcher JA, Ackerstaff E. Mapping Tumor Hypoxia In Vivo Using Pattern Recognition of Dynamic Contrast-enhanced MRI Data. Transl Oncol. 2012. Dec; 5(6):437-47.
- Hoffmann U, Brix G, Knopp MV, Hess T, Lorenz WJ. Pharmacokinetic mapping of the breast: a new method for dynamic MR mammography. Magn Reson Med. 1995. Apr; 33(4):506-14.
- Provent P, Benito M, Hiba B, Farion R, Lopez-Larrubia P, Ballesteros P, Remy C, Segebarth C, Cerdan S, Coles JA, Garcia-Martin ML. Serial in vivo spectroscopic nuclear magnetic resonance imaging of lactate and extracellular pH in rat gliomas shows redistribution of protons away from sites of glycolysis. Cancer Res. 2007. Aug 15; 67(16):7638-45.
- Raghunand N. Tissue pH measurement by magnetic resonance spectroscopy and imaging. Methods Mol Med. 2006; 124:347-64.
Figures