0626
In vivo investigation of lithium brain distribution in bipolar patients using 7Li MRI1NeuroSpin, CEA, Gif-sur-Yvette, France, 2Hôpital Fernand Widal, Paris, France, 3Hôpital Albert Chenevrier, Créteil, France, 4Siemens Healthineers, Saint-Denis, France, 5Neurology, RWTH Aachen University Hospital, Aachen, Germany, 6INSERM UMRS-1144, Paris, France
Synopsis
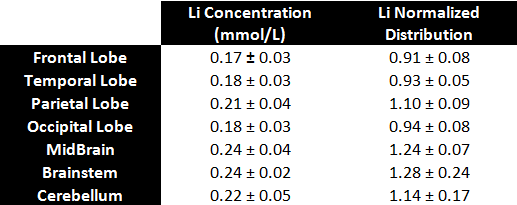
As an effective but poorly understood treatment for the prevalent bipolar disorder, studies focused on investigating the cerebral distribution of lithium are of important clinical interest. Here, we report our preliminary results obtained from 5 euthymic bipolar patients using 7Li MRI at 7T. Using a 3D SSFP sequence with ultra-short TE and Twisted Projection Imaging k-space sampling, we can confirm the heterogeneity of lithium brain distribution, as demonstrated by the individual and average concentration values in seven large regions-of-interest.
Introduction
Lithium (Li) is the first-line mood stabilizer to treat bipolar disorder (BD) patients [1]. However, its mechanisms of action and transport across the blood-brain barrier remain poorly understood. 7Li MRI is the only non-invasive method to determine brain Li concentrations and regional distribution [2-6]. In this preliminary study, we aimed at mapping the cerebral Li distribution in euthymicBD patients treated with Li (with or without co-medication) for more than two years. Acquisitions were performed at 7 Tesla using a 3D SSFP sequence and a phantom replacement approach for quantification accounting for global T1 and T2 relaxation effects [7-8].Methods
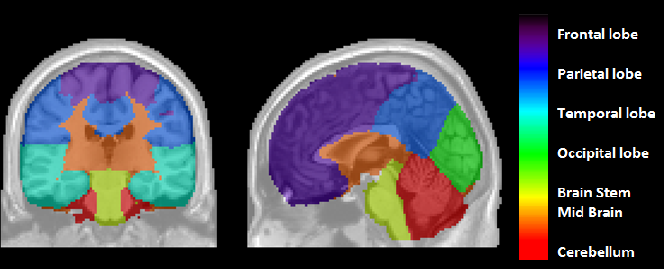
Five euthymic BD patients, three men and two women (42 +/- 11 years old) were recruited from the Paris “Centre Expert Bipolaire”. All were diagnosed with BD, either type I or II, but with varying responses to the Lithium treatment. After providing written and informed consent, and in agreement with the local ethic committee (CPP Ile de France VI), BD patients were scanned at 9 am around 12 hours after their last lithium intake (Li2CO3 dosage ranging from 800 to 1400 mg/day). 7Li MR acquisitions were performed on a 7T Magnetom scanner (Siemens Healthineers, Germany) with a dual-resonance 1H/7Li RF birdcage coil (Rapid Biomedical, Germany). After B0 shimming and acquisition of reference anatomical images, 7Li MRI were acquired in 24 minutes using a 3D UTE SSFP Twisted Projection Imaging (TPI) sequence [9] (TE/TR = 0.3/200ms, FA=20°, 1769 projections, linear fraction of 50%, 352 points per spoke, 10.6 ms readout duration). Global T1 and T2 relaxation times were estimated from non-localized MR spectra acquired from our two first BD patients using the progressive saturation technique [10] (TR ranging from 0.4 to 20s) and by varying the echo-time (TE ranging from 30 to 120 ms). Non-Cartesian reconstruction was made using a homemade Python gridding algorithm [11] and then smoothed to reduce noise using a Non Local Mean Filter [12]. Based on 7Li MR data acquired identically from a 50 mmol/L LiCl phantom, a phantom replacement approach was used to scale our 7Li images and correct for the differential T1/T2 weighting using the SSFP signal equation [13]. After Li concentration maps were aligned with their T1w anatomical reference, all images were interpolated and co-registered into the MNI-152 space provided by SPM [14] to evaluate the average concentrations over seven regions-of-interest (ROI): the frontal, parietal, temporal and occipital lobe, the brainstem, the midbrain region and the cerebellum. Those masks were defined with a combination of probabilistic atlases provided by FSL [15], in particular the MNI and Harvard-Oxford atlases. Additionally, individual normalized Li distributions were calculated (mean concentration being set at 1.0) before averaging across the cohort.Results & Discussion
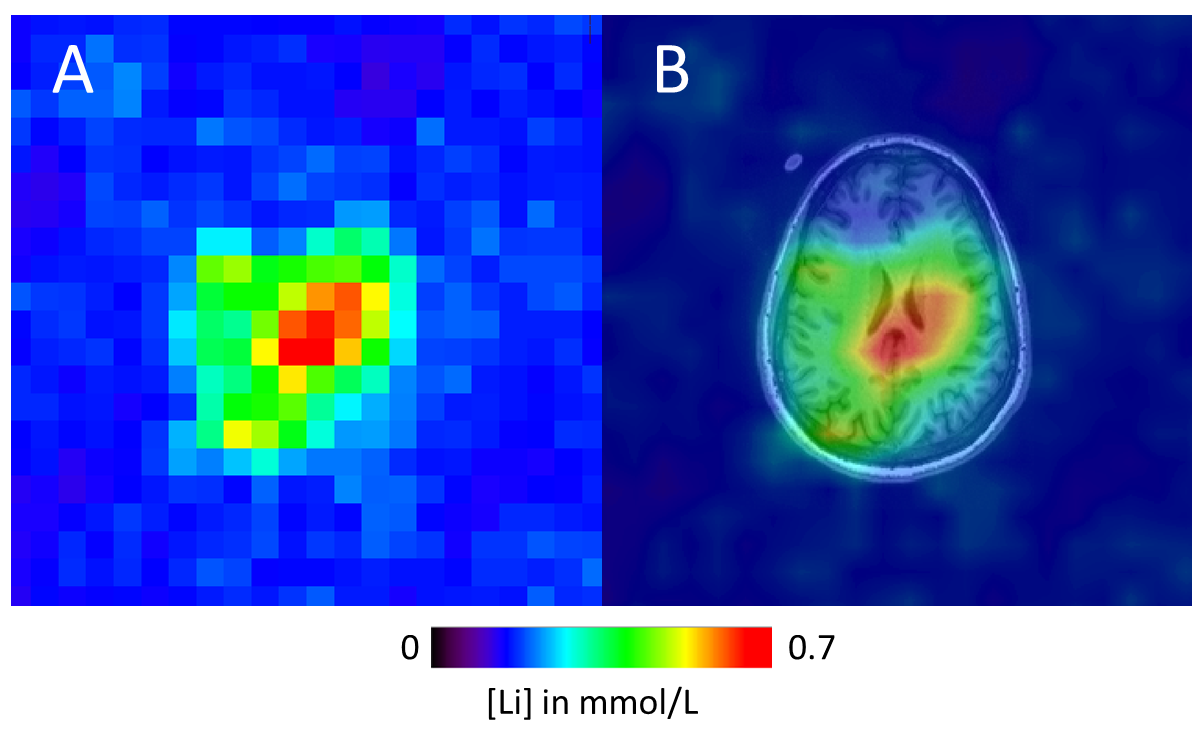
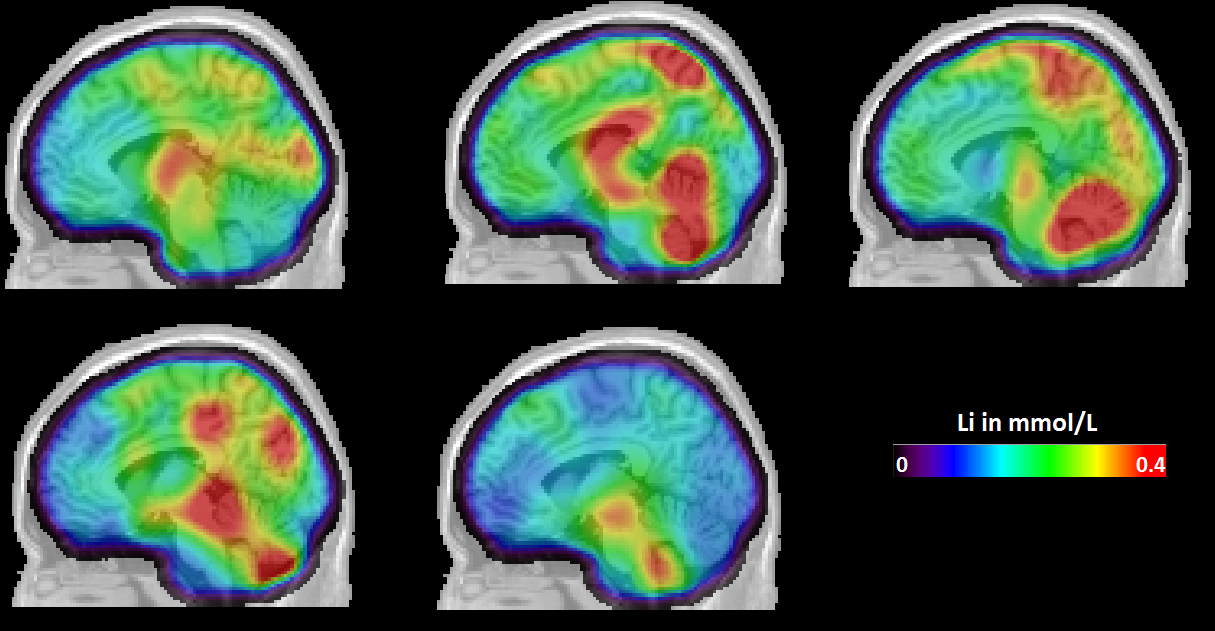
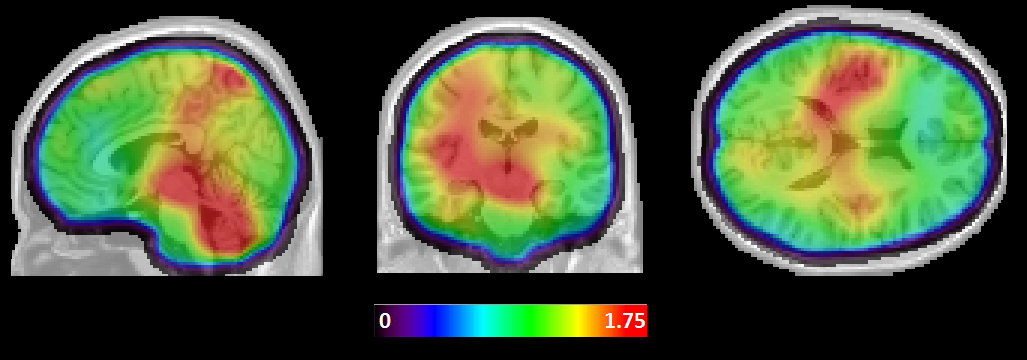
As illustrated by Figure 1, our 7Li MRI were of good quality with a normalized SNR (SNR= nSNR * Voxel * [Li] * Time1/2) evaluated at 3.0 × 10⁶ mol−1 min–1/2 , leading to a sensitivity threshold of about 0.02 mmol/L. According to previous studies using TPI [16], the point-spread-function would be close to optimal, with an effective spatial resolution of about 17 mm isotropic. The T1, T2f and T2s were estimated to be at 3009ms, 15ms and 66ms respectively, which is consistent with previous estimations on rat brains [17]. As illustrated by Figure 2, the Li brain distribution was quite heterogeneous for each patient with significant differences in absolute concentrations amidst our five BP patients. Despite those differences, one can appreciate some similarities with the brainstem, cerebellum and mid-brain regions (Figure 3) exhibiting the highest Li content (Figure 5). Among the cortical areas, a higher Li content was found in the parietal lobe while the lowest values were observed systematically in the frontal lobe.
Conclusion
This study confirms the feasibility of mapping Li brain content using 7Li MRI and hints at the trove of information that could be exploited to better understand the action of Lithium in Bipolar patients.Acknowledgements
No acknowledgement found.References
1. Baldessarini et al., Decreased risk of suicides and attempts during long‐term lithium treatment: a meta‐analytic review; Bipolar Disorders, 2006
2. Komoroski, Biomedical applications of 7Li NMR; NMR Biomed, 2005
3. Machado-Vieira et al., The role of lithium in the treatment of bipolar disorder: convergent evidence for neurotrophic effects as a unifying hypothesis; Acta Psychiatrica Scand, 2016
4. Renshaw et al., In vivo measurement of lithium in humans by nuclear magnetic resonance spectroscopy; Man Reson Imaging, 1988
5. Komoroski et al., Lithium compartmentation in brain by 7Li MRS: effect of total lithium concentration; NMR Biomed, 2013
6. Ramaprasad et al., Pharmacokinetics of lithium in rat brain regions by spectroscopic imaging; Magnetic Reson Imag, 2005
7. Hanak et al., Study of blood and brain lithium pharmacokinetics in the rat according to three different modalities of poisoning; Toxicol Sci, 2014
8. Soher et al., Quantitative proton MR spectroscopic imaging of the human brain; Man Reson Med, 1996
9. Boada et al., Fast three dimensional sodium imaging; Man Reson Med, 1997
10. Freeman et al., Fourier transform study of NMR spin–lattice relaxation by “progressive saturation”; Chem Physics, 1971
11. Jackson et al., Selection of a convolution function for Fourier inversion using gridding (computerised tomography application); IEEE Trans on Med Imaging Vol 10, 1991
12. Rousseau et al., BTK: An open-source toolkit for fetal brain MR image processing; CM & Programs in Biomed, 2013
13. Bernstein et al., Handbook of MRI, 2004
14. http://www.fil.ion.ucl.ac.uk/spm/
15. http://web.mit.edu/fsl_v5.0.8/fsl/doc/wiki/Atlases.html
16. Romanzetti et al., Mapping tissue sodium concentration in the human brain: a comparison of MR sequences at 9.4 Tesla; NeuroImage, 2014
17. Komoroski et al, Mapping tissue sodium concentration in the human brain: a comparison of MR sequences at 9.4 Tesla; Man Reson Med, 2004
Figures