0621
Reproducibility of cardiac 31P MRS at 7 T1OCMR, RDM Cardiovascular Medicine, University of Oxford, Oxford, United Kingdom, 2Department of Imaging Methods, Institute of Measurement Science, Slovak Academy of Sciences, Bratislava, Slovakia, 3Wellcome Centre for Intergrative Neuroimaging, University of Oxford, Oxford, United Kingdom, 4Wolfson Brain Imaging Centre, Department of Clinical Neurosciences, University of Cambridge, Cambridge, United Kingdom
Synopsis
Cardiac PCr/ATP ratios measured by 31P MRS change in cardiovascular disease giving them value as a biomarker. We scanned 13 healthy volunteers at 7T, assessing their PCr/ATP with 6 ½ min 31P CSI scans. These data have better reproducibility than a 30min 3T protocol previously published by our centre. Repeated PCr/ATP measurements from subjects in this study were not significantly (P=0.83) different. Measurements were significantly different (P<0.001) from DCM patient data acquired in a previous 7T study using the same coil and pulse sequence. This data will allow us to plan future 7T 31P-MRS clinical studies.
Purpose
In most major heart diseases the ratio of phosphocreatine (PCr) to adenosine triphosphate (ATP) concentrations (“PCr/ATP”) changes, making PCr/ATP a useful indicator of energetic state of the heart.1,2
However, 31P MRS has historically been limited by its intrinsically low SNR. Work by Rodgers et al3 showed an increase in SNR by 2.3x at 7T compared to 3T. Additionally, the SNR of 7T 31P spectra can be further increased with per-subject B0 shimming.4 The purpose of this work was to:
(i) assess the reproducibility of PCr/ATP measurements using 7T 31P MRS in the human heart; and
(i) confirm that the observed improved spectral quality using the optimised “custom” B0 shimming does not incur a penalty in the reproducibility of measurements.
This will provide data needed for power calculations to design clinical studies.
Methods
Data acquisition: 13 healthy volunteers (11M/2F, age 29±8yrs, BMI 22.1±3.0 kg/m2) were recruited according to local regulations. Scans were performed on a Magnetom 7T MRI scanner (Siemens). Localiser images were acquired using a 10cm loop coil (Rapid Biomedical) and 31P spectra were acquired with a 16-element 31P array5 (Rapid Biomedical). Subjects were scanned supine to facilitate coil swapping and for comfort.
Scan protocol: After localisation, two iterations of optimised B0 shimming (starting from the vendor’s default, ”tune-up”, shim) were performed as described previously.4 3 sets of 31P spectra were then acquired in 6 ½ min each with a 3D UTE-CSI sequence, 8x16x8 matrix and WSVD coil combination.10 The first and third data-sets used our optimised "custom" B0 shim; the second used the vendor’s default “tune up” shim. Subjects were then removed from the magnet. This constituted ‘session 1’. For 6 subjects (4M/2F), the above was repeated (‘session 2’) after a short (~5min) break. The other 7 subjects only did ‘session 1’. Data-sets were labelled A-F (see fig. 1 for description).
Data analysis Data were fitted using the Oxford Spectroscopy Analysis (OXSA) toolbox.6 Prior knowledge specified 11 Lorentzian peaks, fixed amplitude ratios, and literature values for the scalar couplings for the multiplets. Blood contamination and partial saturation was then corrected using literature T1 values.3,7
Assessment of reproducibility
Inter-session variability was assessed by comparison of PCr/ATP ratios from equivalent data-sets in both sessions for each subject. i.e. by comparing data-set B with E, and comparing data-set C with F.
Inter-subject variability was assessed by the mean and standard deviation of PCr/ATP ratios within the same data-sets across all subjects.
Intra-session variability was assessed by comparison of PCr/ATP ratios from equivalent data-sets within the same session. i.e. by comparison of data-set A with C and data-set D with F.
The coefficient of repeatability (CR) was calculated according to Bland and Altman.8 We compared to our previous results from a 28 min protocol with the same hardware in 25 DCM patients.9
Results
The custom optimised shim sequence reduced the mean linewidth of the 2,3-DPG and γATP peaks (fig. 2). It also improved the repeatability of inter-session measurements (coefficient of repeatability was only 0.43 for custom shim vs. 0.70 for tune-up, fig 3).
There was no significance difference (P=0.83 for "tune-up" shim, P=0.54 for "custom shim") in PCr/ATP ratios in the same subjects between sessions. PCr/ATP ratios measured in this work were significantly different (P<0.001) to those measured in 25 DCM patients with the same hardware9 (fig. 4).
Discussion
Good reproducibility of cardiac 31P MRS has previously been reported at 3T.7 This 7T study acquired data-sets in approximately 1/5th of the time of that 3T study. The CR between inter-session measurements was reduced in this work (CR 0.43 7T vs 1.1 3T), suggesting spectra can be acquired quicker without cost to reproducibility. Ability to acquire 31P spectra quickly is important as it allows more detailed study of the response cardiac energetics to stressors, such as exercise or dobutamine infusion.
Intra-session variability shows the ‘best-case’ reproducibility – any differences in PCr/ATP are due to the 31P acquisition. The inter-session variability was not larger than the intra-session (CR 0.43 vs 0.80) – this means the differences between data-sets are not due to the ‘set-up’ of the san (e.g coil positioning, localisers).
PCr/ATP ratios were consistent with literature values3 , and – as expected – there was no significant difference in mean PCr/ATP measurements between sessions.
Conclusion
We acquired cardiac 31P MRS spectra at 7T with improved reproducibility to previously reported 3T measurements,7 and in 1/5th of the time. Optimised B0 shimming improved spectral quality without incurring a penalty on measurement reproducibility: it is therefore recommended for use in future cardiac studies.Acknowledgements
Funded by a Sir Henry Dale Fellowship from the Wellcome Trust and the Royal Society (Grant No. 098436/Z/12/Z). JE receives a DPhil (PhD) studentship from the Medical Research Council (UK).References
1. Neubauer, S. The failing heart--an engine out of fuel. N. Engl. J. Med. 356, 1140–51 (2007).
2. Bottomley, P. A., Bottomley & A., P. MRS Studies of Creatine Kinase Metabolism in Human Heart. in eMagRes 1183–1202 (John Wiley & Sons, Ltd, 2016). doi:10.1002/9780470034590.emrstm1488
3. Rodgers, C. T. et al. Human cardiac 31 P magnetic resonance spectroscopy at 7 tesla. Magn. Reson. Med. 72, 304–315 (2014).
4. Delabarre, L., Neubauer, S., Robson, M. D., Vaughan, J. T. & Rodgers, C. T. B 0 SHIMMING FURTHER IMPROVES HUMAN CARDIAC P-MRS AT 7 TESLA. in ISMRM 23rd Annual Meeting (2015).
5. Rodgers CT, Clarke WT, Berthel D, Neubauer S, R. M. A 16-element receive array for human cardiac 31P MR spectroscopy at 7T. In Proceedings of the 22th Annual Meeting of ISMRM. in 22nd Annual Meeting of ISMRM (2014).
6. Purvis, L. A. B. et al. OXSA: An open-source magnetic resonance spectroscopy analysis toolbox in MATLAB. PLoS One 12, e0185356 (2017).
7. Tyler, D. J. et al. Reproducibility of 31 P cardiac magnetic resonance spectroscopy at 3 T. NMR Biomed. 22, 405–413 (2009).
8. STATISTICAL METHODS FOR ASSESSING AGREEMENT BETWEEN TWO METHODS OF CLINICAL MEASUREMENT. Lancet 327, 307–310 (1986).
9. Stoll, V. M. et al. Dilated Cardiomyopathy: Phosphorus 31 MR Spectroscopy at 7 T. Radiology 281, 409–417 (2016).
10. Rodgers, C. T. & Robson, M. D. Receive array magnetic resonance spectroscopy: Whitened singular value decomposition (WSVD) gives optimal Bayesian solution. Magn. Reson. Med. 63, 881–891 (2010).
Figures
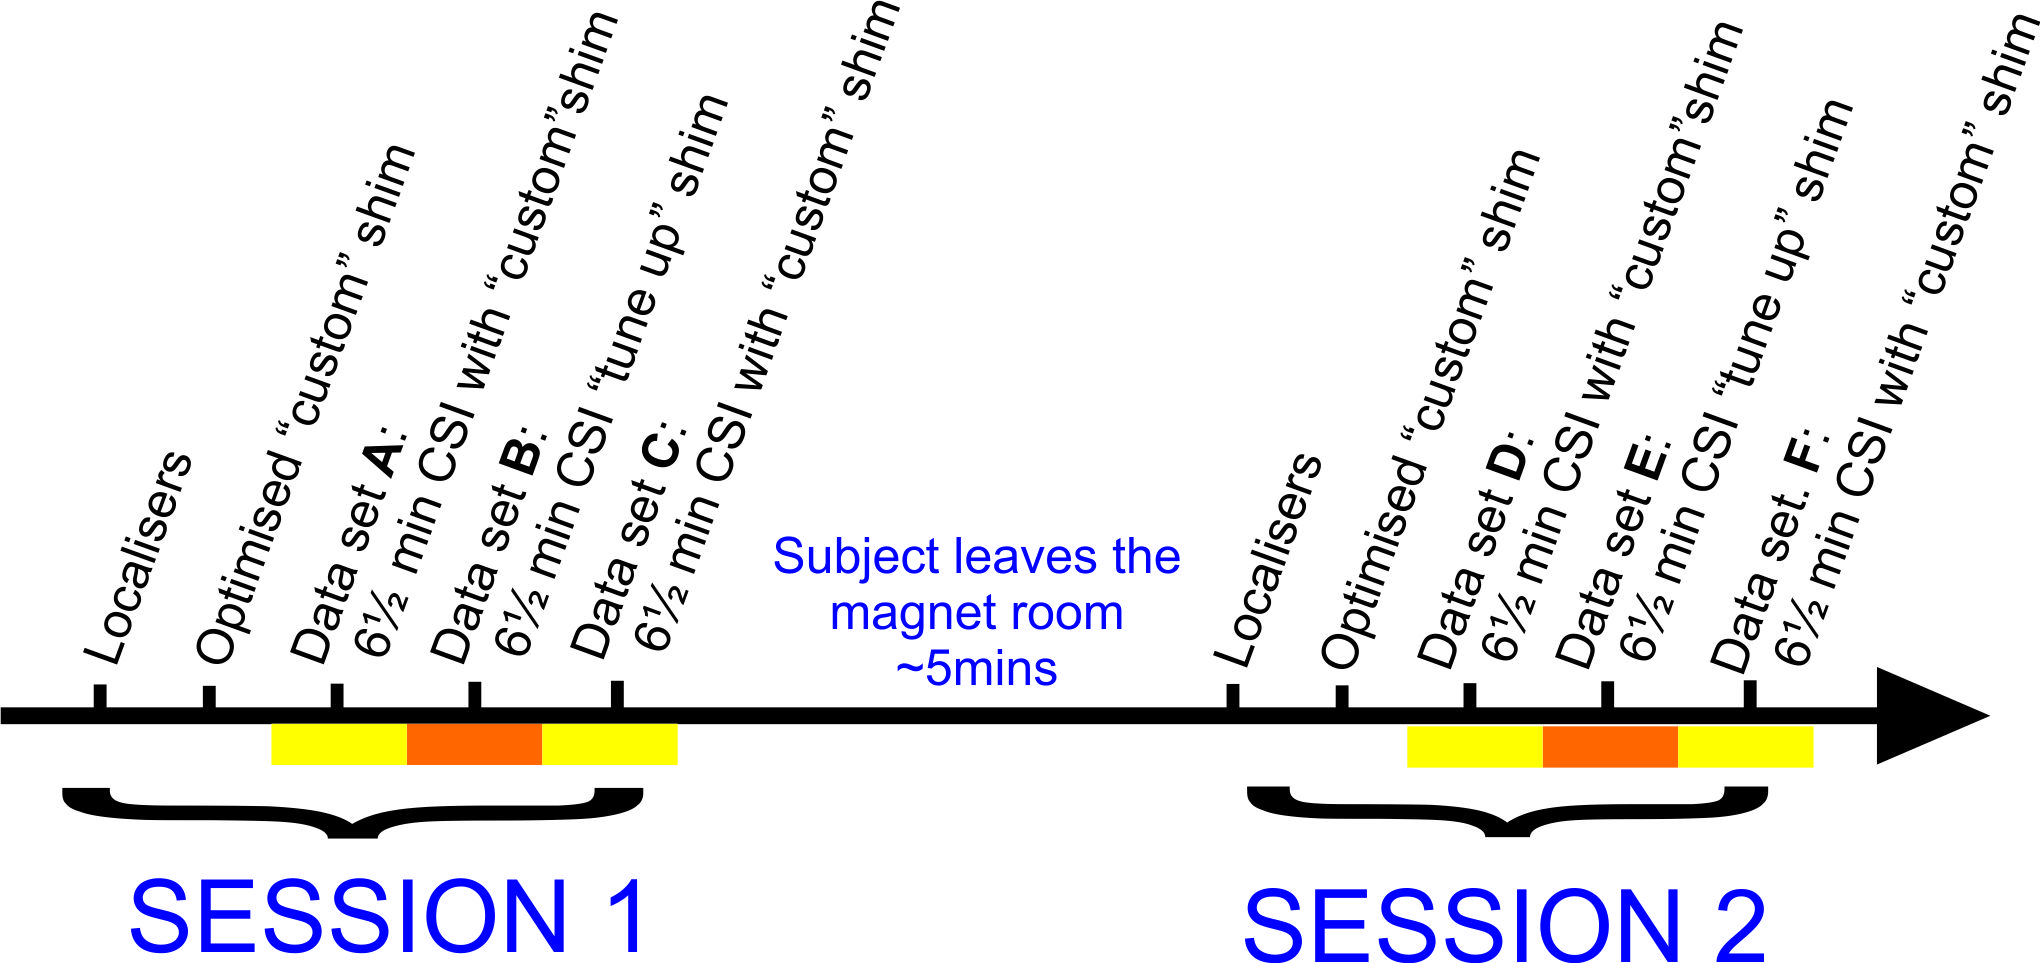
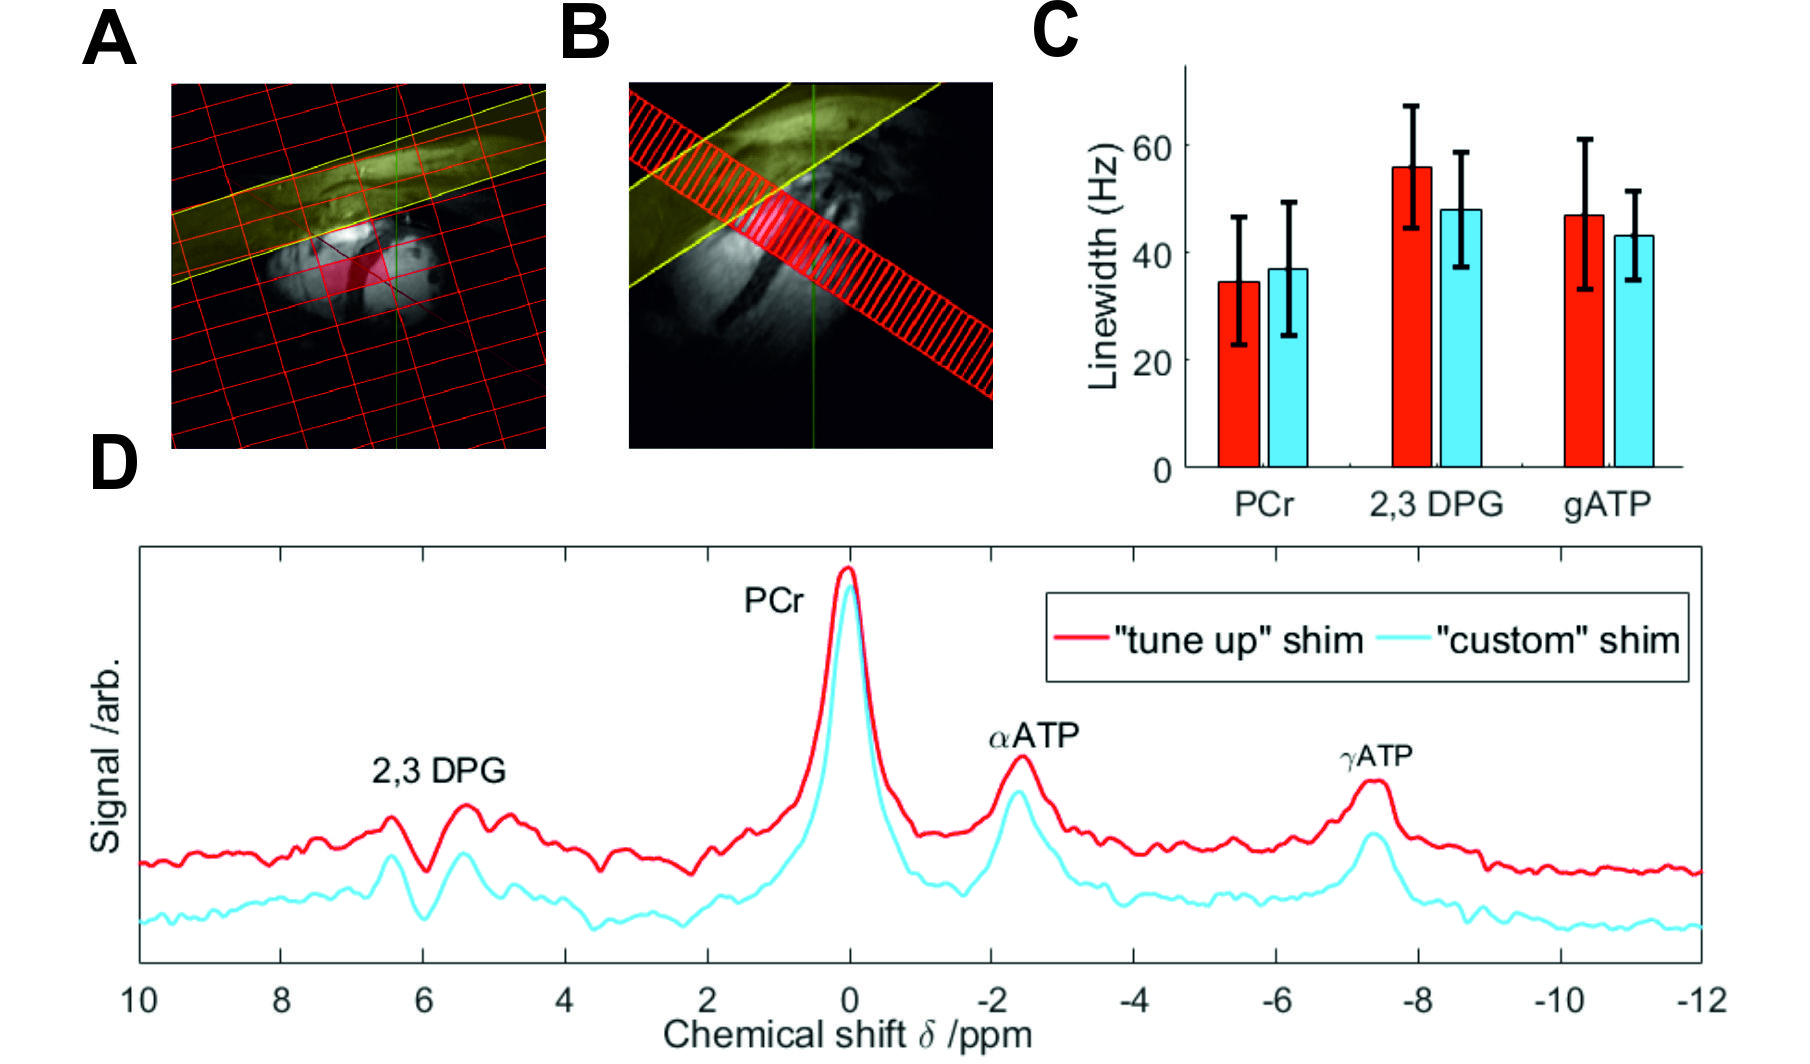
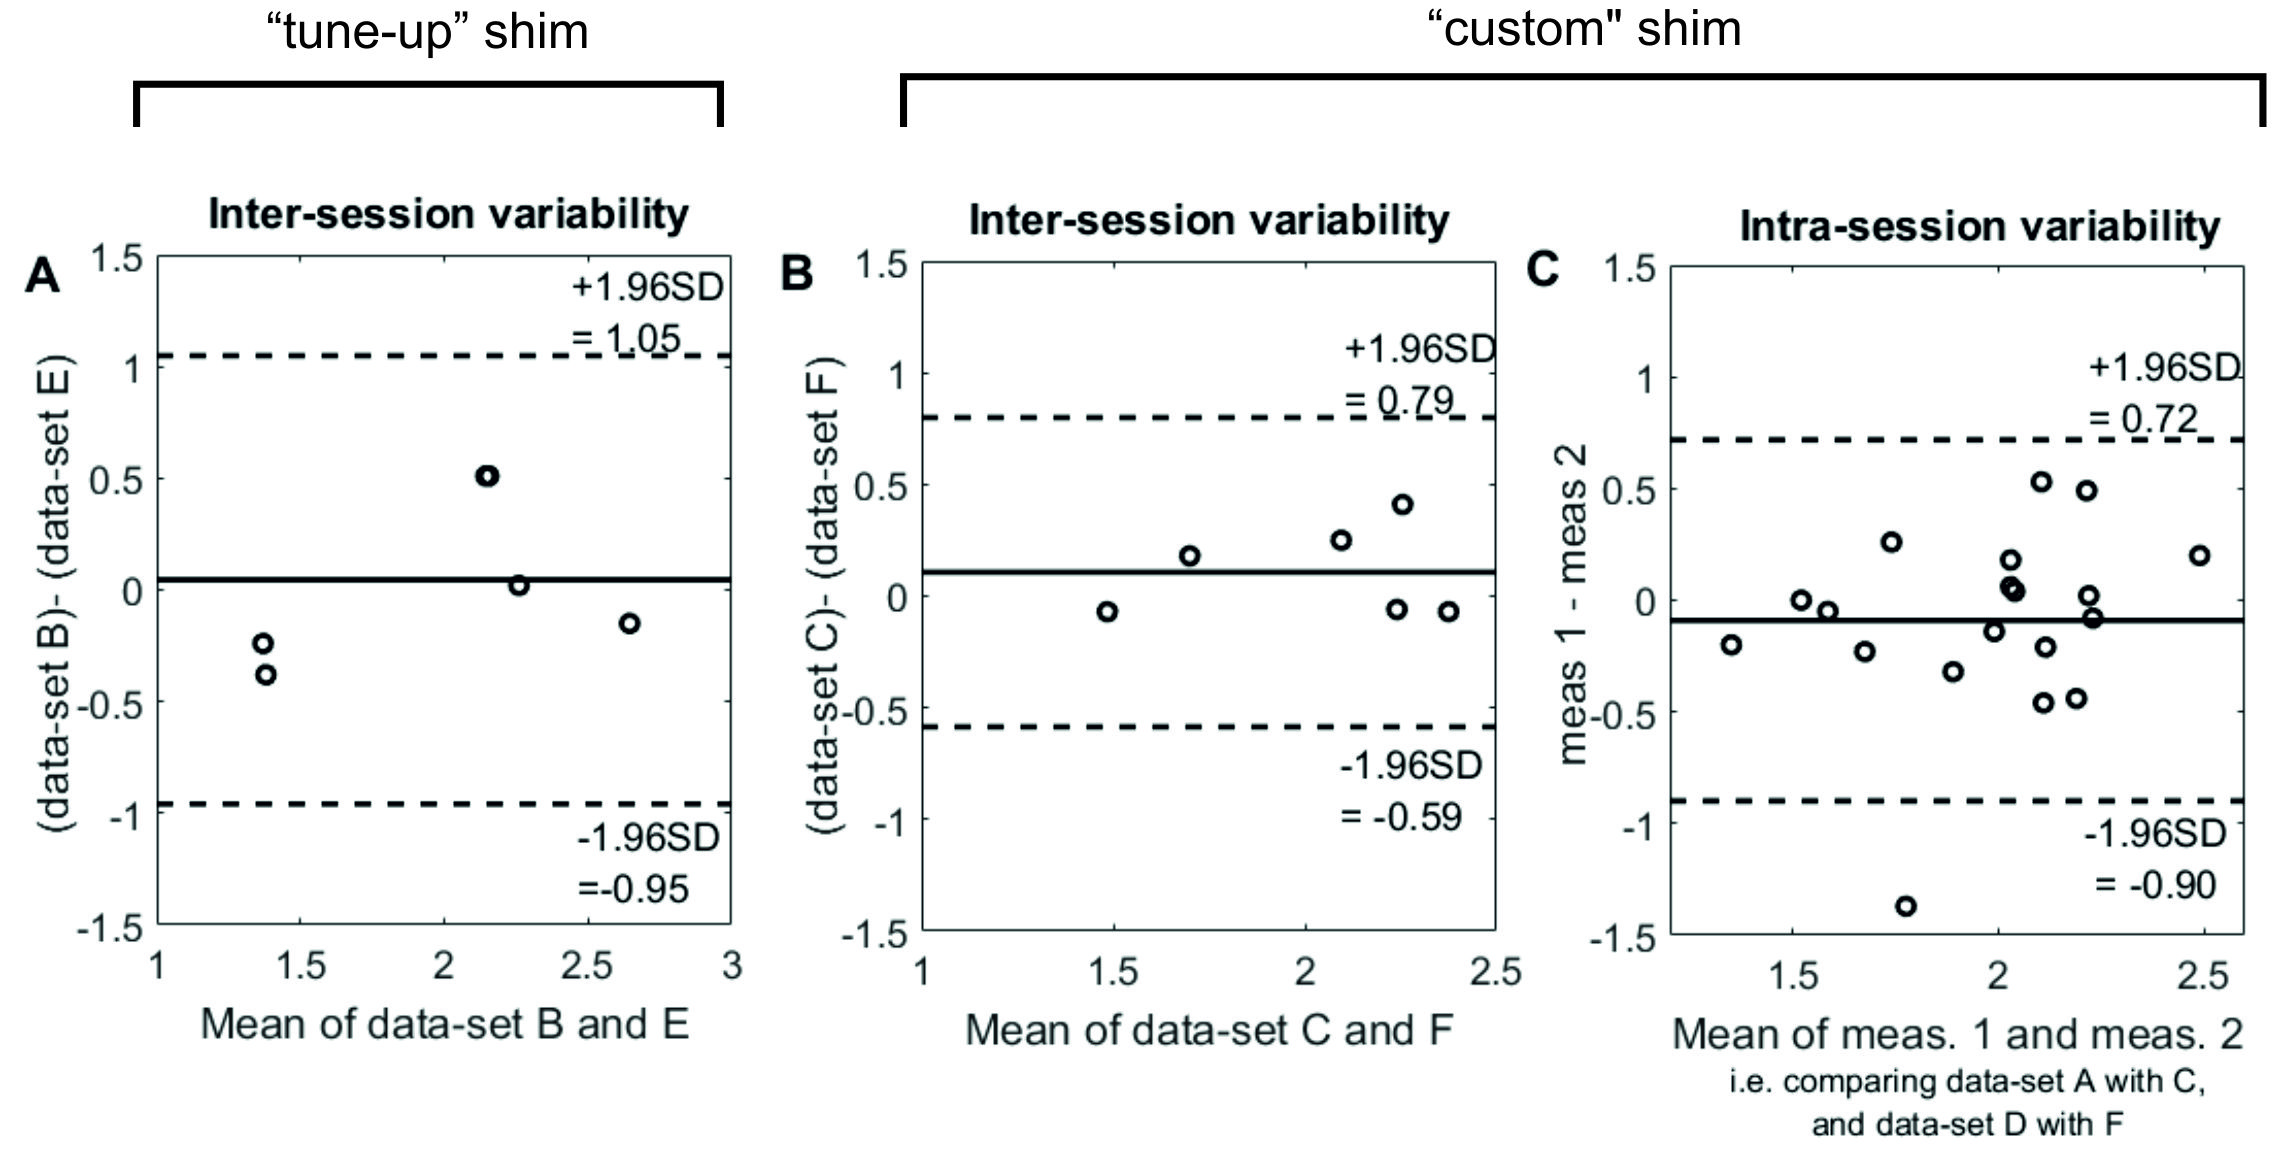
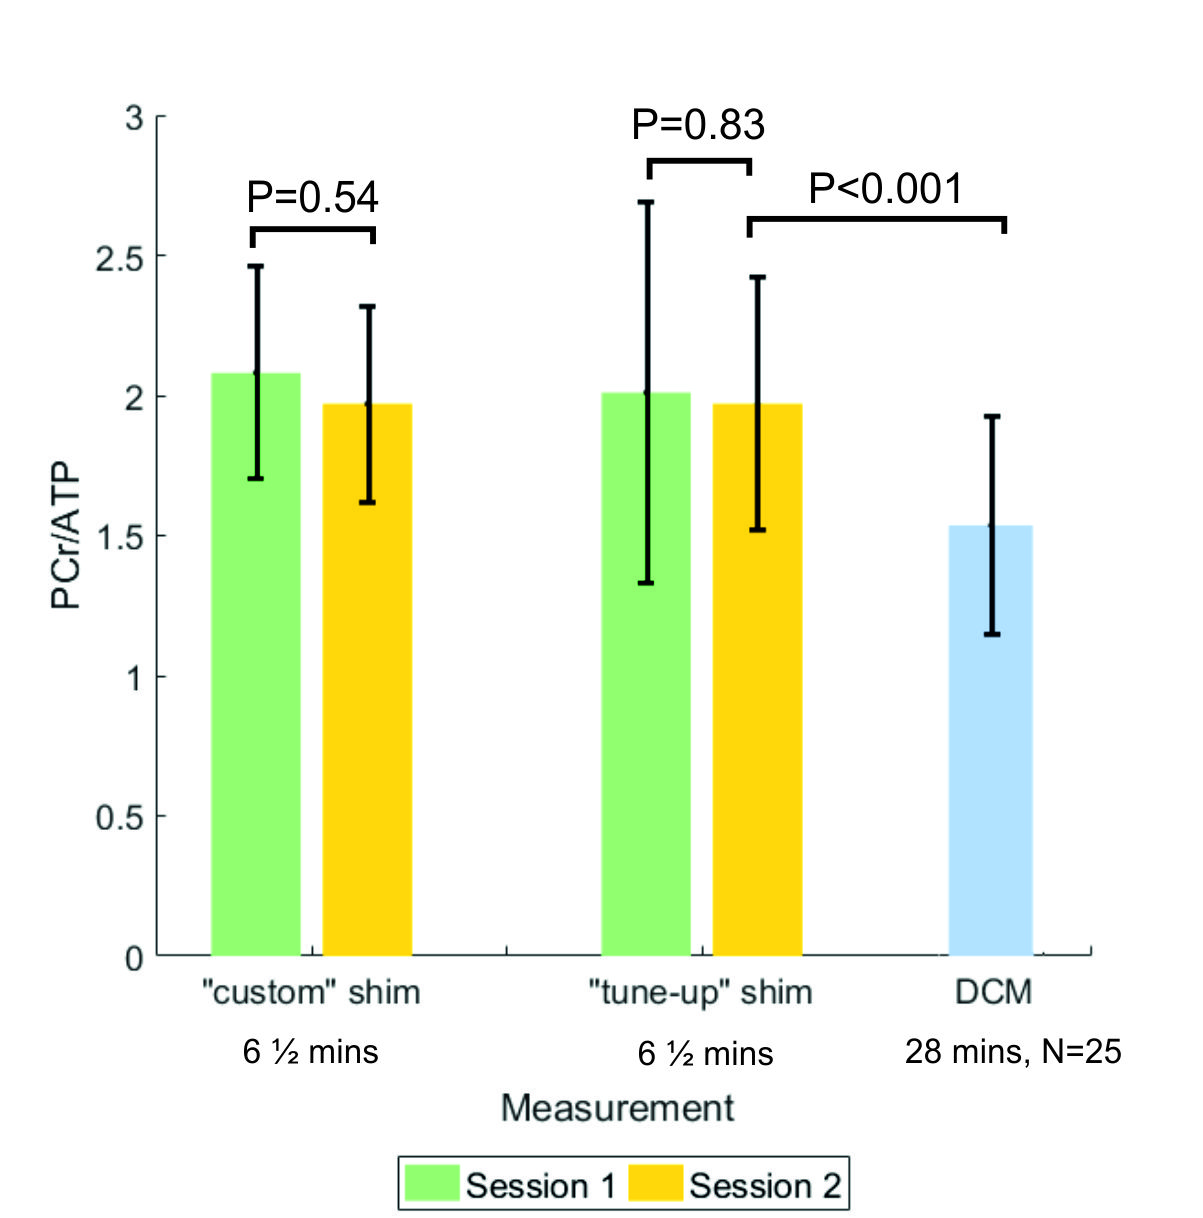
Figure 4 inter-subject
PCr/ATP (mean± SD) for both sessions using the custom and tune-up shims. Blue bar
shows mean±SD PCr/ATP for 25 DCM patients (DCM data are from ref. 9)