0619
Whole Brain High Resolution Metabolite Mapping Using 1H FID MRSI with Slice-wise B0 Shim Updating at 9.4T1Max Planck Institute for Biological Cybernetics, Tuebingen, Germany, 2IMPRS for Cognitive and Systems Neuroscience, Eberhard-Karls University of Tuebingen, Tuebingen, Germany, 3Institute of Physics, Ernst-Moritz-Arndt University Greifswald, Greifswald, Germany
Synopsis
In this work, we present high resolution whole-brain metabolite maps acquired at 9.4T for the first time. By combining a robust acceleration method with dynamic B0 slice-wise shim updating, we achieved high quality metabolite maps from 10 slices of the brain with a nominal voxel size of ~80μL in ~25 minutes.
Introduction
Whole-brain metabolite mapping with volumetric coverage is a valuable tool for the evaluation of metabolite levels across different regions in the human brain. Previously, several whole-brain 1H MRSI studies have been performed at 3T 1-3 using the EPSI sequence4, 5. However, so far, similar studies have not been done at higher field strengths despite the many advantages of higher fields for spectroscopy applications. The reason for this is two-fold: firstly, B0 inhomogeneity is a severe problem at ultra-high fields. This makes the use of 3D sequences very challenging, since without slice-wise B0 shim updating it is very difficult to achieve a reasonably homogenous B0 field across the entire brain6. Therefore, an available solution is to use 2D sequences such as multi-slice 1H FID MRSI6-8 which is compatible with dynamic B0 shim updating. Secondly, the duration of multi-slice MRSI scans increases rapidly with increasing number of slices. It is therefore crucial to use acceleration methods to make whole-brain metabolite mapping feasible. This means that there is a need for robust in-plane acceleration methods that would achieve sufficiently high acceleration factors.
In this study, for the first time we present whole-brain metabolite maps acquired with a high spatial resolution in the human brain at 9.4T. By combining a robust acceleration method with dynamic B0 shim updating, we achieve high quality metabolite maps from 10 slices of the brain in ~25 minutes.
Methods
All experiments were conducted on healthy volunteers with a 9.4 T whole-body human Siemens scanner with an in-house developed 18Tx/32Rx RF coil9. On each volunteer, 1H MRSI data were acquired from a total of 10 slices (of 8 mm thickness each) covering the entire Cerebrum. A multi-slice ultra-short TR and TE 1H FID MRSI sequence with no lipid or outer volume suppression with the following parameters was used for data acquisition: FOV = 205x205mm, TR = 300ms, TE = 1.5ms, in-plane matrix size = 64x64, slice thickness = 8mm, slices = 10, spectral bandwidth = 8 kHz. The MRSI acquisition was accelerated using a modified GRAPPA acceleration technique with an effective acceleration factor of R=7 (in-plane). This led to a total scan time of ~25 minutes for the whole brain. After each MRSI scan, a highly accelerated water reference image with the same spatial resolution as the original MRSI data was acquired from each slice. The total acquisition time of the water reference scan for the entire brain was about 7 minutes. The GRAPPA accelerated data were reconstructed using a machine-learning based neural network prediction that allowed robust un-aliasing of the unsuppressed lipid peaks even at high acceleration factors. The spectra were reconstructed and post-processed using the same methodology as in [10], and fitted using LCMODEL11.
For B0 shim updating, first, a reference B0 field map of the whole volume was acquired using a 2D dual-echo GRE sequence with 40 slices of 2mm thickness. Hence, every four slices in the reference map corresponds to one MRSI slice. Next, optimized shim currents for up to 2nd degree spherical harmonics were calculated and applied to the shim coils for each MRSI slice using the ConsTru shimming algorithm12. The shim values were updated at the beginning of each slice acquisition.
Results/Discussion
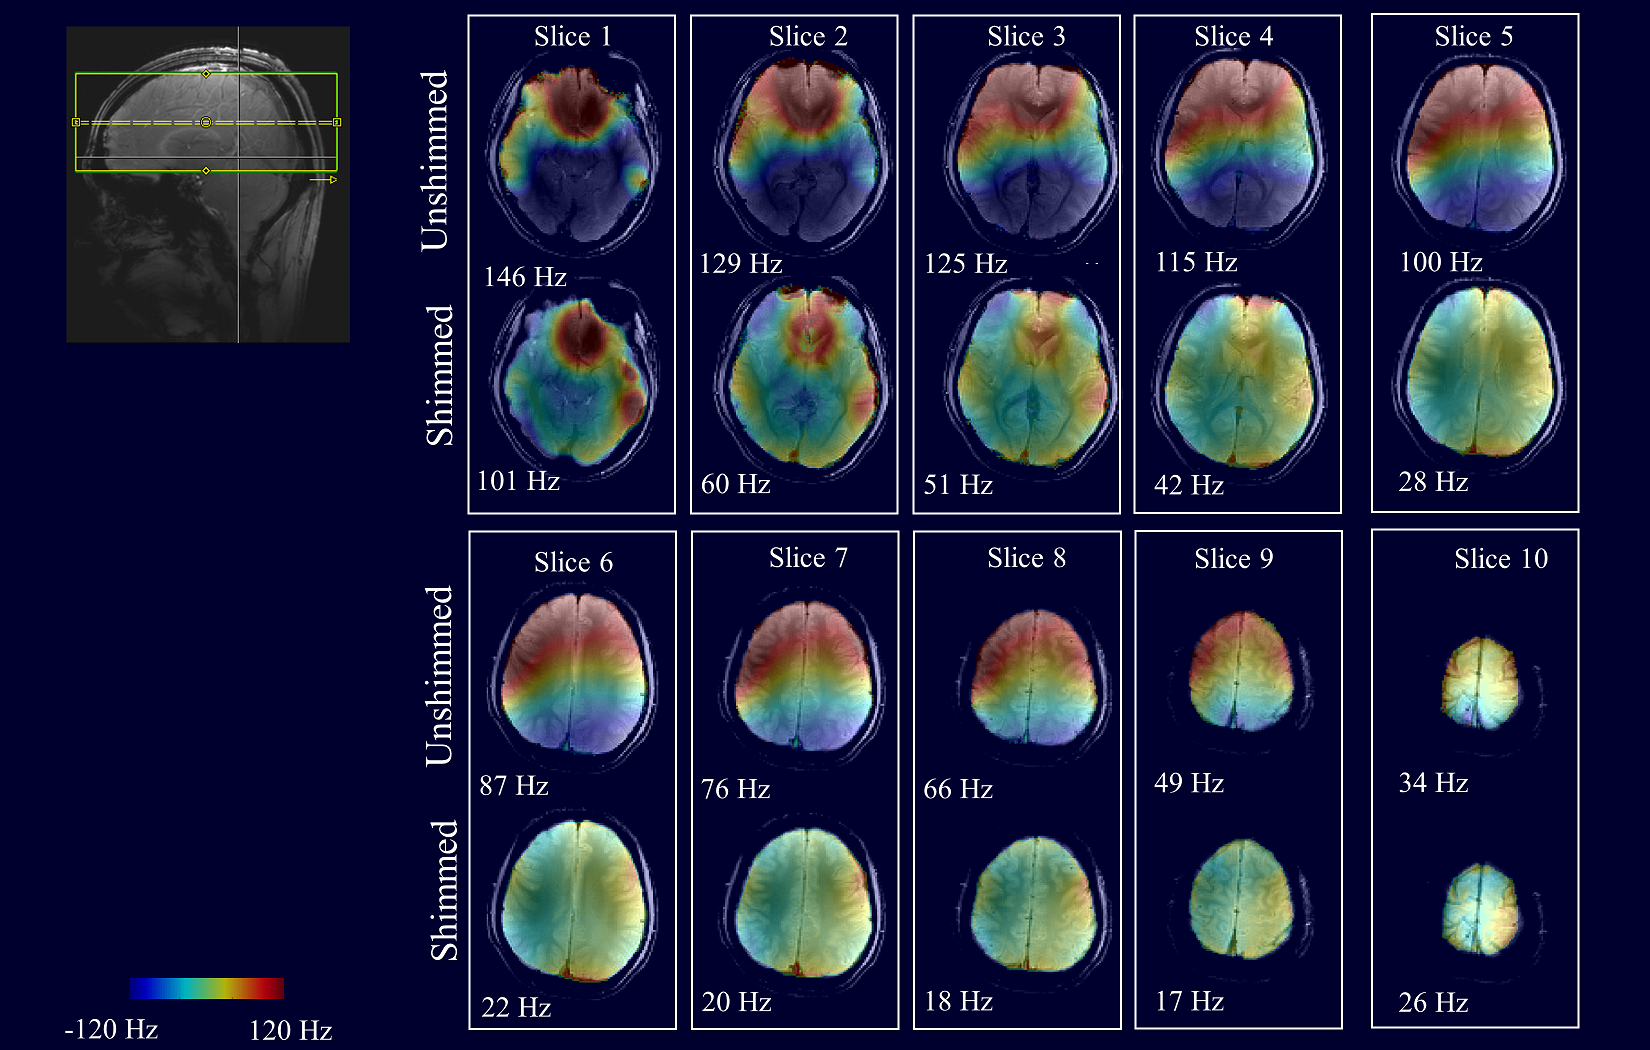
Figure 1 shows the B0 shim quality achieved on each slice using 2nd degree slice-wise B0 shimming. The unshimmed B0 maps are also shown as a reference. While 2nd degree dynamic shimming is able to achieve acceptable shim quality on most of the slices, on the two bottom slices there are still a lot of residual B0 inhomogeneity patterns that are difficult to correct for due to their localized nature. This results in poor water suppression quality in those regions and directly degrades the SNR and linewidth of the spectra. Improving the B0 homogeneity using localized shim coils might reduce this issue13.
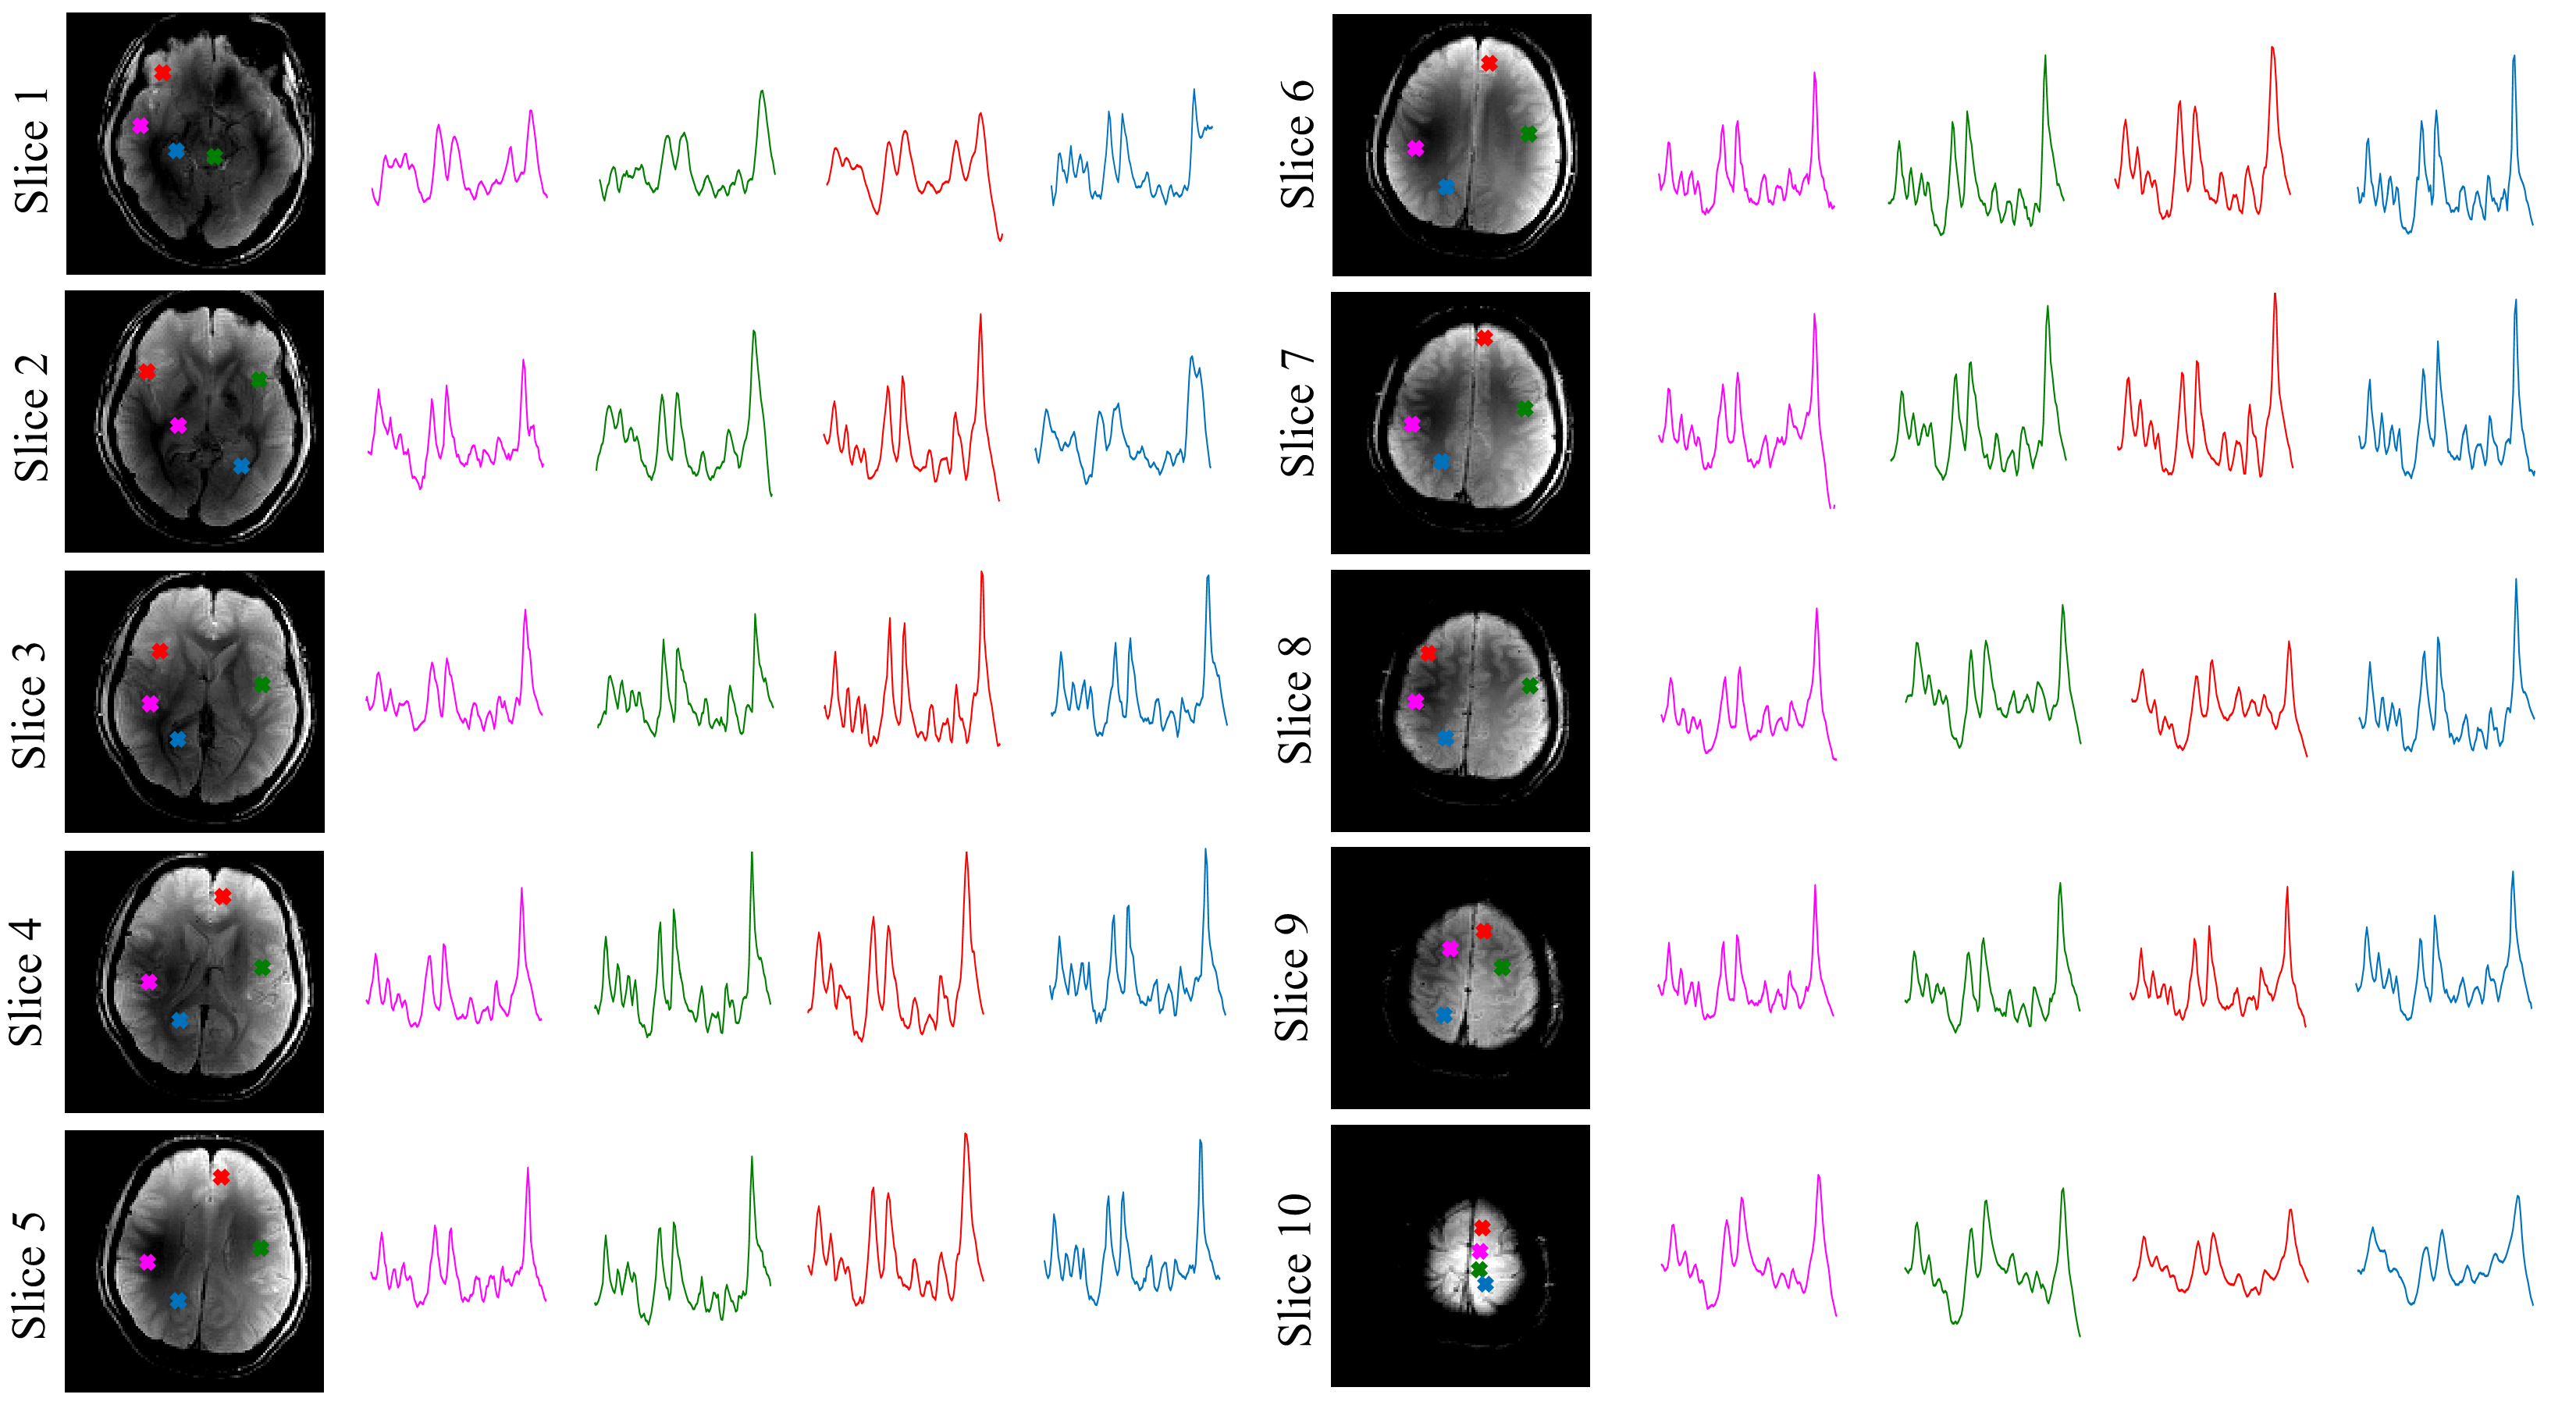
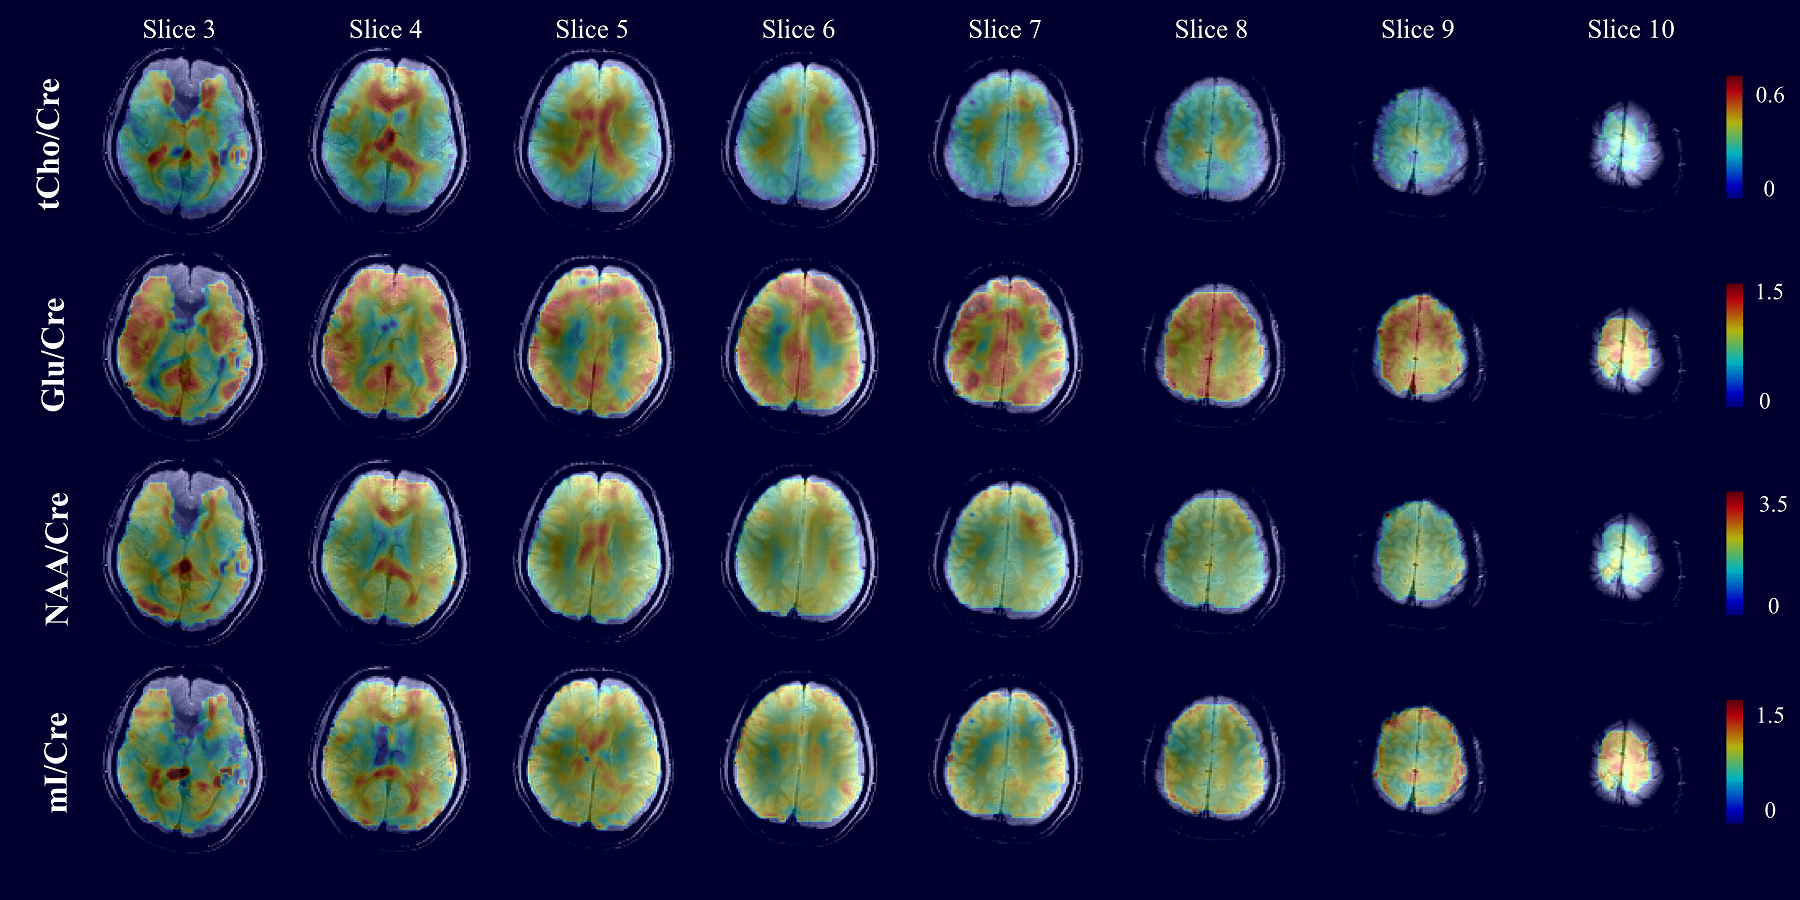
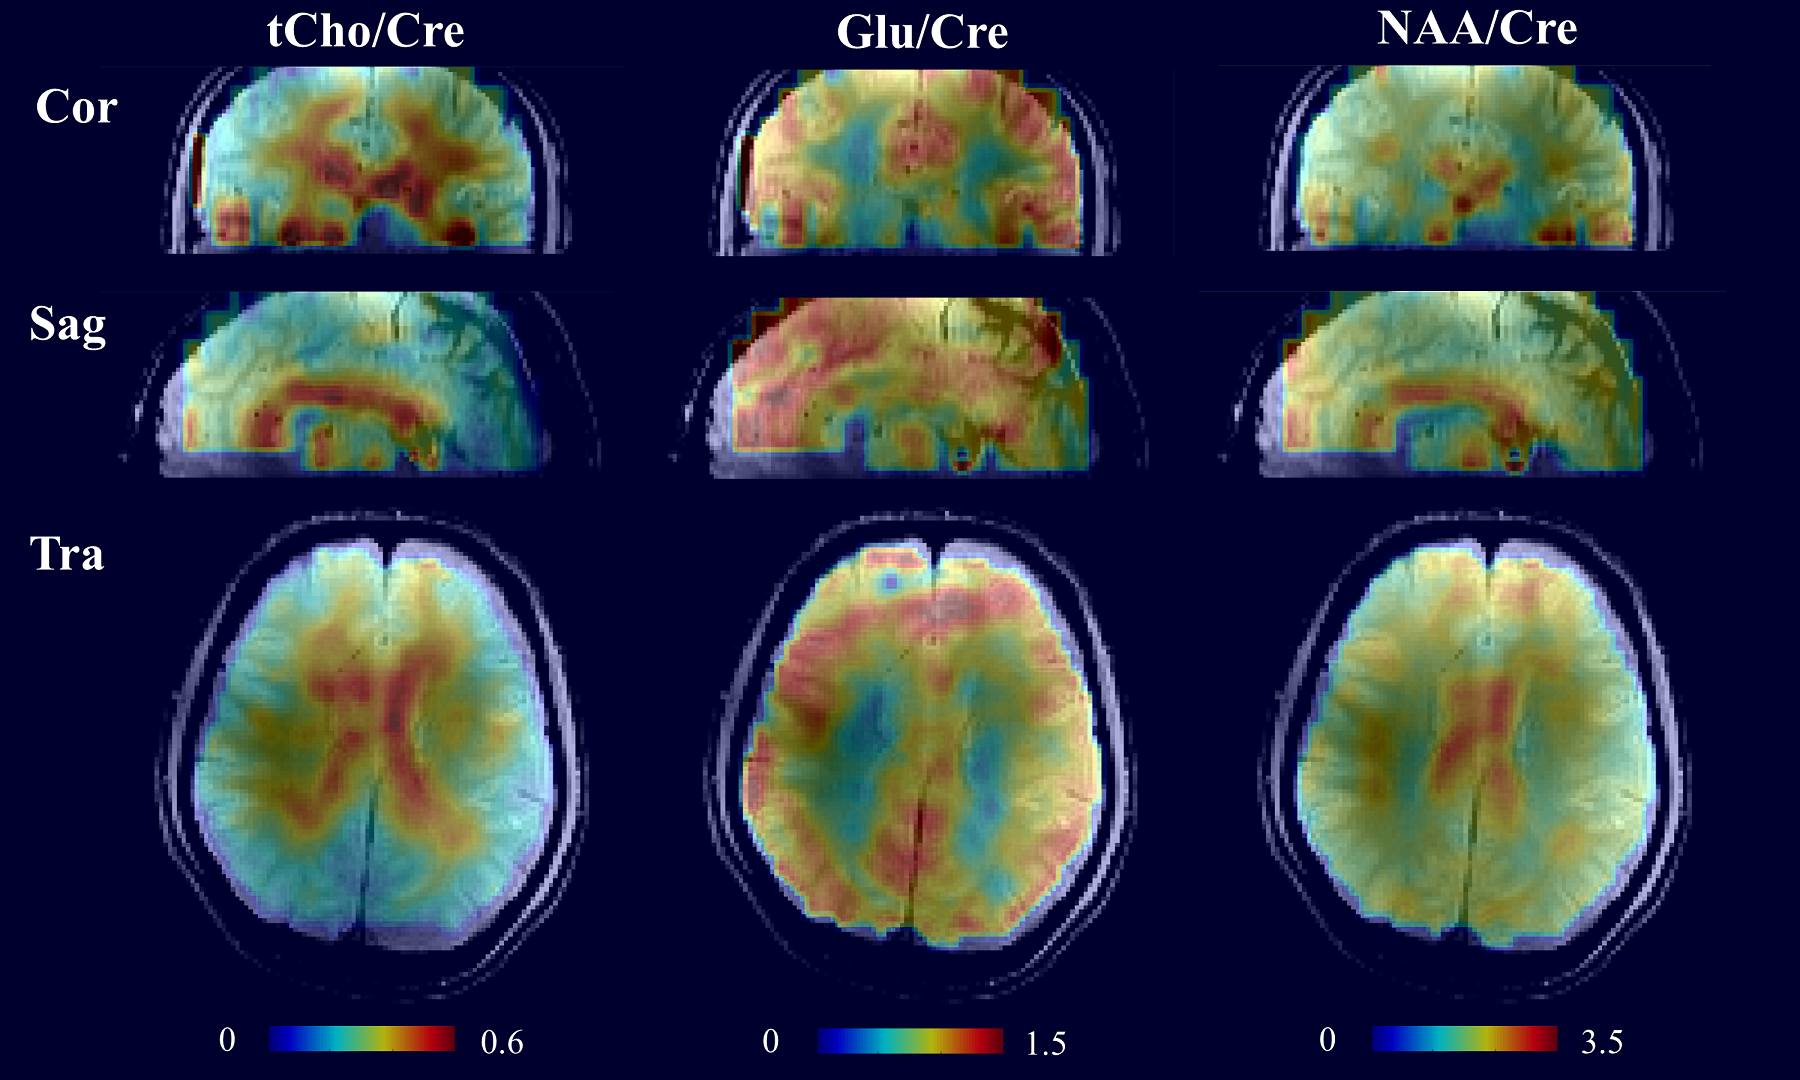
Figure 2 shows representative spectra from several voxel positions on all 10 slices. Figure 3 shows the metabolite maps of four metabolites ratios (/Cre) for slices 3 to 10. All maps show high SNR and great anatomical details across the slices. Note that despite the high in-plane acceleration factor (R=7) there are no visible residual lipid aliasing artifacts in the metabolite maps. Finally, Figure 4 shows the metabolite maps of 3 metabolites from the central slice in the transversal, sagittal, and coronal directions.
Conclusion
In this study whole-brain and high resolution metabolite maps acquired from the human brain at 9.4T were presented. Using dynamic slice-wise B0 shim updating and a robust acceleration method, high quality whole-brain metabolite maps with a nominal voxel size of ~80μL were acquired in about 25 minutes.Acknowledgements
No acknowledgement found.References
[1] Sabati et al, MRM 2015.
[2] Ding et al, MRM 2015.
[3] Maudsley et al, NMR in Biomed 2011.
[4] Posse et al, MRM 1995.
[5] Ebel et al, MRM 2001.
[6] Boer et al, MRM 2011.
[7] Henning et al, NMR in Biomed 2009.
[8] Bogner et al, NMR in Biomed 2012.
[9] Avdievitch et al, NMR in Biomed 2017.
[10] Nassirpour et al, NeuroImage 2017.
[11] Provencher, MRM 1993.
[12] Nassirpour et al, MRM 2017.
[13] Juchem et al, JMR 2011.
Figures