0614
Observed MRI changes following Directly-Acting Antiviral Therapy in Hepatitis-C virus patients1Sir Peter Mansfield Imaging Centre, School of Physics and Astronomy, University of Nottingham, Nottingham, United Kingdom, 2NIHR Nottingham Biomedical Research Centre, University of Nottingham, Nottingham, United Kingdom
Synopsis
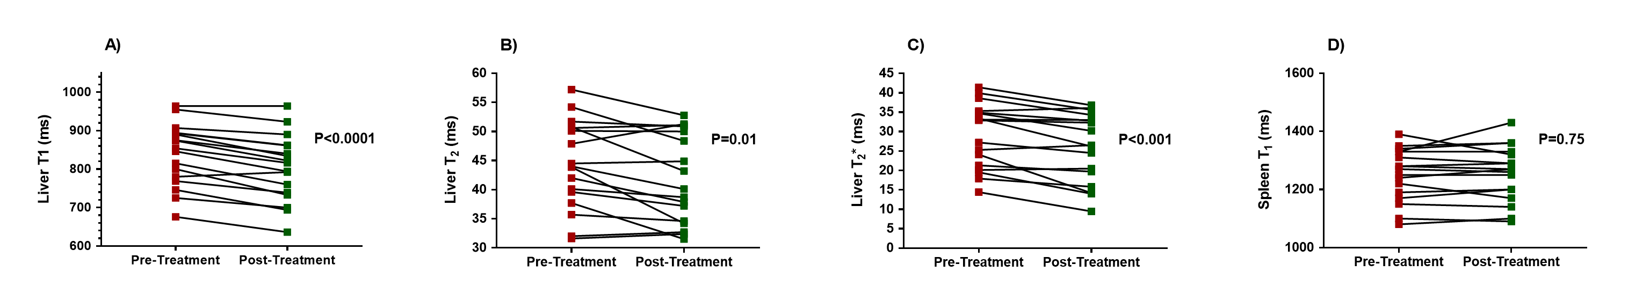
Hepatitis C Virus (HCV) is globally the largest viral cause of mortality. Directly Acting Antiviral (DAA) therapy achieves >90% sustained virological response in HCV patients. We used multiparametric MRI to assess changes in hepatic angio-architecture after patients had DAA therapy. The time window between pre- and post-treatment scans was of 3-6 months. We observed changes in hepatic microstructure indicated by a reduction in liver T1 (35±4ms), T2 (2.5±0.8ms) and T2* (3.0±0.7ms) which we suggest are linked to reduced pro-inflammatory milieu, including interstitial oedema, within the liver. No changes were observed in hepatic/splanchnic blood flow or perfusion.
Purpose
In 2015, globally, Hepatitis C virus (HCV) was named the largest viral cause of mortality. Over 90% of Chronic Hepatitis C (CHC) patients achieve Sustained Virological Response (SVR) using Directly Acting Antiviral (DAA) therapy. This study uses quantitative MRI to assess structural and haemodynamic changes within the liver over a 3-6 month time window following DAA therapy.Methods
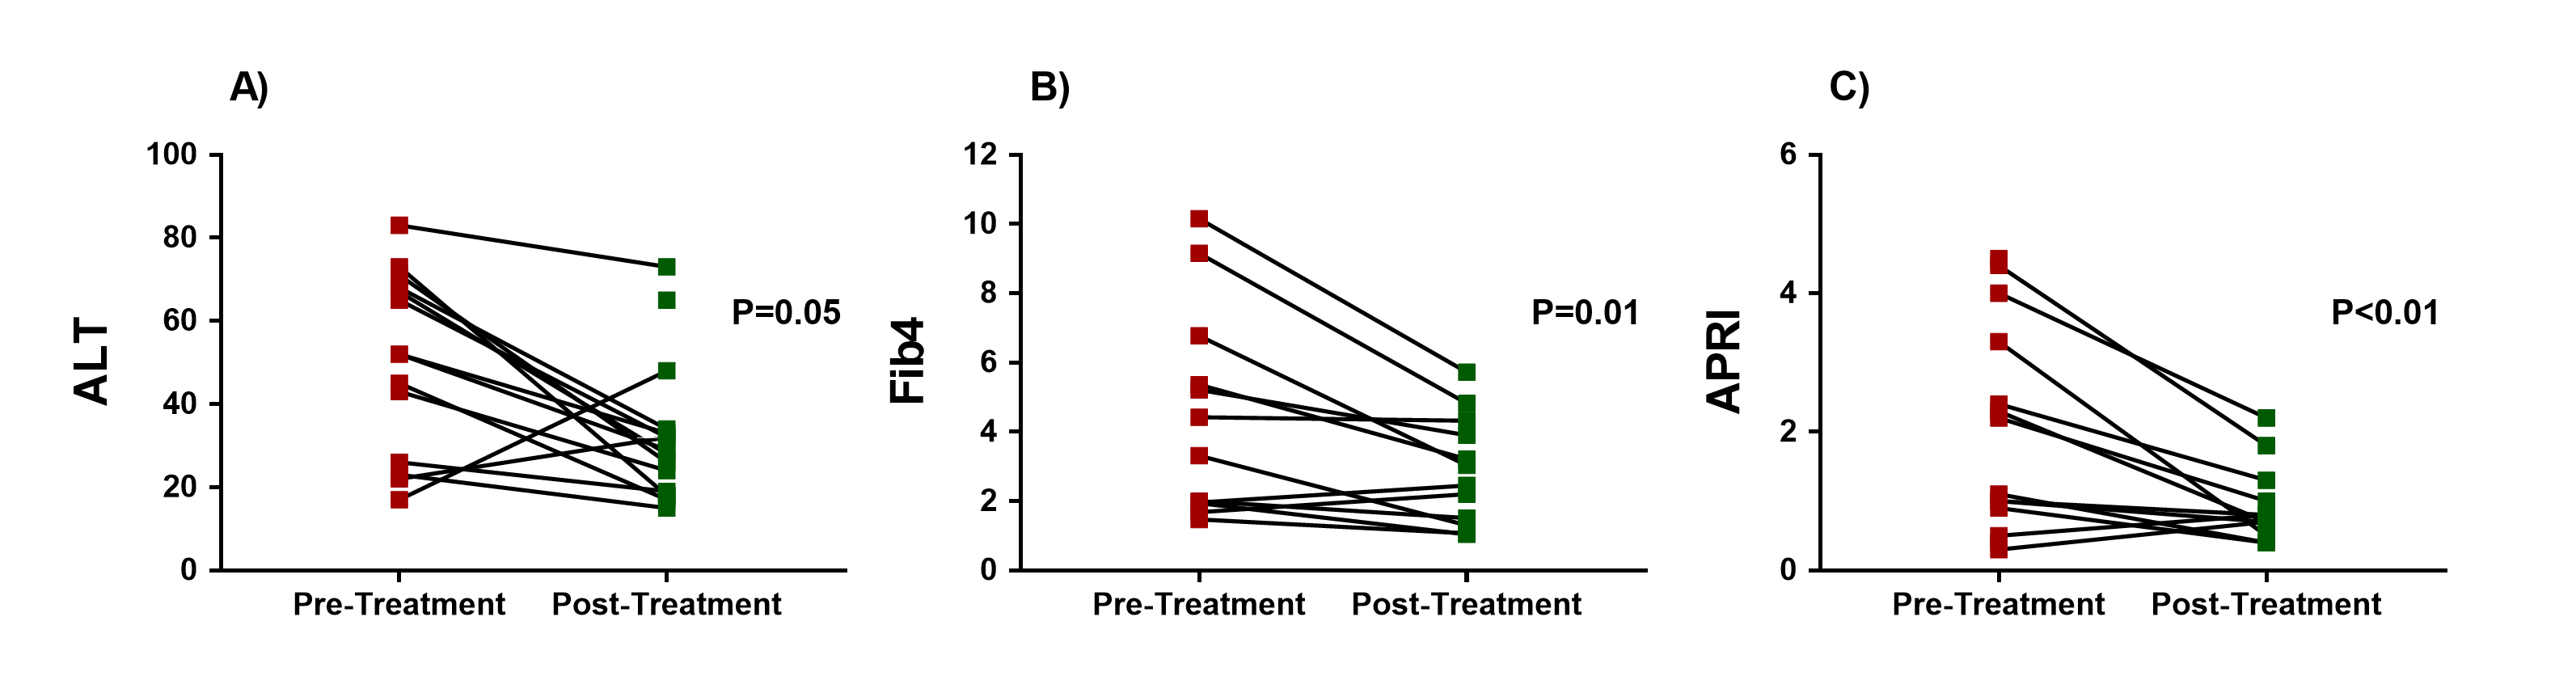
The study was approved by the NHS ethics committee, 17 HCV patients with cirrhosis had a multiparametric MRI scan pre- and post- DAA treatment to assess microstructure and haemodynamics within the liver and splanchnic system. Patients underwent DAA therapy within 1 week of their pre-treatment MRI scan. DAA therapy consisted of treatment with sofosbuvir, plus either ledipasvir or daclatasvir, with or without ribavirin. Patients returned for their post-treatment MRI scan at a median of 22 days (3 – 79 days) after the last DAA taken. Clinical liver markers of MELD, UKELD, Fib4, APRI, and ALBI were collected at pre- and post- MRI time points. All MRI scans were performed on a Philips 1.5T Achieva (16-channel SENSEXL Torso receive coil), with patients attending in the morning after an overnight fast.
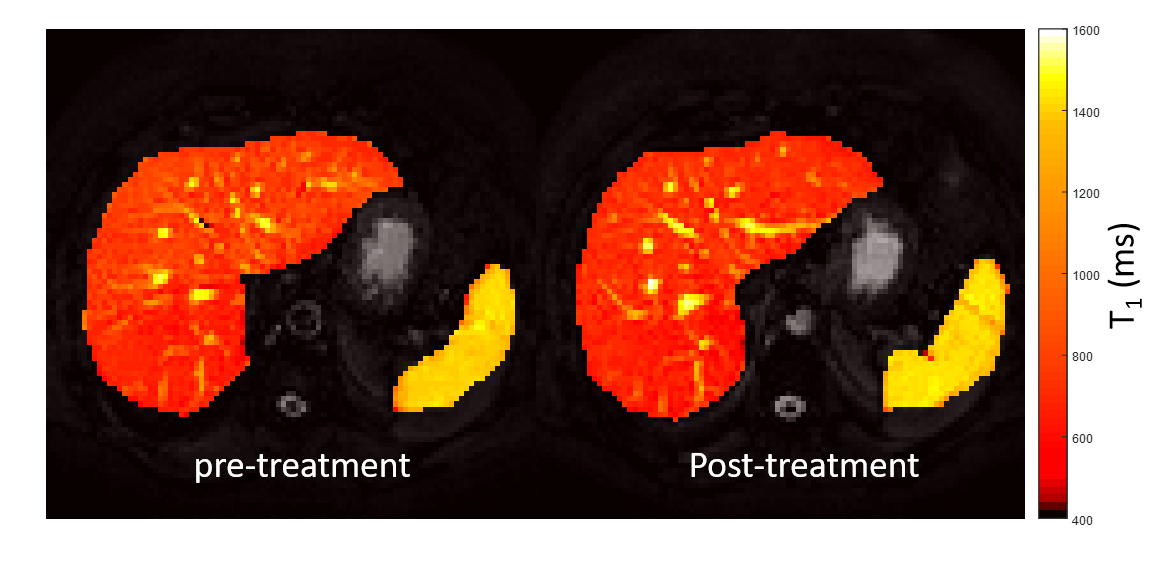
Structure: Liver and spleen T1 maps were generated using a modified respiratory gated inversion recovery sequence with a spin-echo (SE) readout (TE 27ms, minimum TR of 8000ms, Flip Angle (FA) 90o, SENSE 2, 3 sagittal slices, 3x3x8mm3, FOV 288x288mm2, temporal slice spacing 65ms, inversion times (TI): 100, 200, 300, 400, 500, 600, 700, 800, 900, 1000, 1100, 1200, and 1500ms, acquisition time ~3 min)1. Images were fit to create T1 and M0 maps, and a region of interest over the liver and spleen assessed using histogram analysis to determine the median liver T1 excluding large vessels1 and median spleen T1. A respiratory-gated SE-EPI scheme was used to measure liver T2 (six echo times (TE) of 27, 35, 42, 50, 60, and 70ms) in approximately 2 minutes. T2* maps were acquired using a multi-echo fast-field-echo (mFFE) sequence (12 echo times, first echo 5ms and subsequent echoes at 2.5ms intervals) in a ~ 17s breath hold. Data was fit to create T2 and T2* maps and compute median liver values. In addition liver volume was estimated from the bFFE localiser scans.
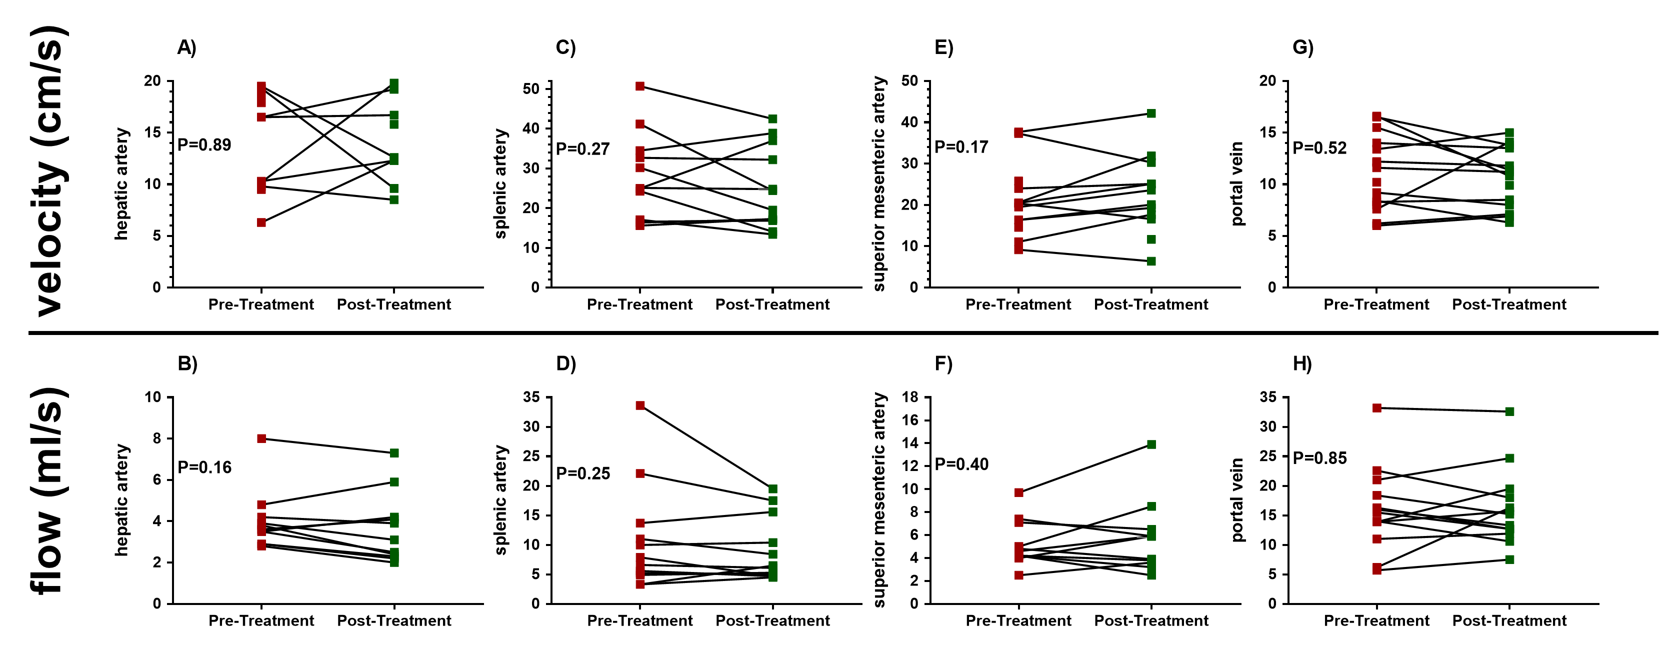
Haemodynamics: Phase contrast (PC) MRI was used to assess blood flow in the portal vein, hepatic artery, splenic artery, and superior mesenteric artery in a single 15-20 s breath hold. Imaging parameters were TE/TR 3.8/5.8ms, FA 25o, velocity encoding of: portal vein 50cm/s; hepatic artery and splenic artery 100cm/s; superior mesenteric artery 140cm/s. Mean arterial flow velocity and flow was calculated over the cardiac cycle for each vessel. In addition, liver perfusion was estimated using a respiratory triggered FAIR-ASL (geometrically matched to T1 map, at a PLD of 1100ms). Label/control images were motion corrected, label-control averaged to give a perfusion weighted image (ΔM), and perfusion quantified using the ΔM, M0, and T1 in a kinetic model.
Data was tested for normality (Shapiro-Wilk test, all data normally distributed) and a paired t-test used to compare pre- and post-treatment.
Results
Patients’ had significantly improved liver function test scores post-treatment compared to pre-treatment (Figure 1), 16 of the 17 (94%) patients went on to achieve SVR. There were significant changes in the liver microstructure as assessed by MR relaxation times, with a significant reduction in liver T1, T2 and T2* after treatment (Figure 2), but not spleen T1. Figure 3 shows example liver and spleen T1 maps. No significant changes were observed in any haemodynamic measures (hepatic artery, splenic artery, superior mesenteric artery, portal vein or liver perfusion) following DAA therapy (Figure 4).Discussion
Using non-invasive MRI, we have observed changes in MRI measures of hepatic microstructure in a short time window following DAA therapy. We suggest these MRI changes are a result of reduced pro-inflammatory milieu, including interstitial oedema, within the liver after the virus has been cleared. No changes in hepatic or splanchnic blood flow were observed, likely because of the short time frame between MRI scans. Few previous studies have assessed the effect of antivirals. Liver diffusion has demonstrated reduced liver ADC values which could be associated with ultrastructural changes such as cell necrosis/apoptosis and inflammatory cell infiltration2. A very recent study3 showed a small increase in liver volume (LV) during anti-viral treatment, which was larger in patients with SVR, interpreted to indicate liver regeneration and/or recovery and reduced fibrotic load of the liver. In future work we will use multiparametric MRI to observe the long term effects of DAA therapy on hepatic angio-architecture.Acknowledgements
Financial support from NIHR Nottingham Biomedical Research Centre, Nottingham University Hospitals NHS Trust and University of Nottingham.References
1.) A study of T₁ relaxation time as a measure of liver fibrosis and the influence of confounding histological factors. Hoad CL, Palaniyappan N, Kaye P, Chernova Y, James MW, Costigan C, Austin A, Marciani L, Gowland PA, Guha IN, Francis ST, Aithal GP. NMR Biomed. 2015;28(6):706-14.
2.) Guaraldi G1, Besutti G, Stentarelli C, Zona S, Nocetti L, Loria P, Ballestri S, Losi L, Torricelli P, Ligabue G.Magnetic resonance for quantitative assessment of liver steatosis: a new potential tool to monitor antiretroviral-drug-related toxicities. Antivir Ther. 2012;17(6):965-71.
3.) Fitzpatrick JA1, Kim JU2, Cobbold JF2, McPhail MJ2, Crossey MM2, Bak-Bol AA2, Zaky A2, Taylor-Robinson SD2. Changes in Liver Volume in Patients with Chronic Hepatitis C Undergoing Antiviral Therapy. J Clin Exp Hepatol. 2016;6(1):15-20.
Figures