0613
Staging of rat liver fibrosis using monoexponential, stretched exponential and diffusion kurtosis models with diffusion weighted imaging- magnetic resonance1Department of Radiology, The Second Clinical Medical College of Jinan University, Shenzhen People's Hospital, Shenzhen, China, 2Zhujiang Hospital, Southern Medical University, Guangzhou, China, 3The First Affiliated Hospital of Jinan University, Guangzhou, China, 4MR Clinical Science, Philips Healthcare, Guangzhou, China
Synopsis
Non-Gaussian DWI in Various Stages of Liver Fibrosis
Introduction
Liver fibrosis is a reparative response of liver tissues to the chronic liver injuries of various causes. It has been shown that early fibrosis is reversible,[1] and its progression into cirrhosis and cancer can be stopped or delayed by early treatment. Thus, early diagnosis of liver fibrosis is clinically important.Purpose
To compare the characteristics of monoexponential, stretched exponential models (SEM) and diffusion kurtosis imaging (DKI) in different stages of liver fibrosis in rat models, and to assess the accuracy of noninvasive diagnosis of diffusion weighted imaging (DWI) in liver fibrosis.Materials and Methods
The rats were randomized into a liver fibrosis group (n=64) with two standard rat models[2,3], induced by carbon tetrachloride (CCl4) (n=32) and biliary duct ligation (BDL) (n=32), and a control group (n=16). DWI was performed using a 3.0T magnetic resonance imaging (MRI) scanner. The values of various parameters (ADC, Dapp, Kapp, DDC, α) were measured: ADC from monoexponential; Dapp, Kapp from SEM; and DDC, α from DKI. Liver fibrosis stages (F0–F4) were defined by METAVIR scoring. Analyze the percentage of the positive-staining area relative to the whole area of the field of picrosirius red stainingResults
The ADC, Dapp and DDC decreased with increasing fibrosis levels. The Kapp and α increased. The Spearman rank correlation between fibrosis stage and the parameters (ADC, Dapp, Kapp, DDC, α) are -0.675, -0.743, 0.549, -0.789, 0.365, respectively. The Pearson rank correlation between collagen content and the parameters (ADC, Dapp, Kapp, DDC, α) are -0.559, -0.617, 0.459, -0.601, 0.368, respectively. Analysis of ROC curves for fibrosis stage evaluation showed that the AUC for both Dapp and DDC were 0.805–0.938 and 0.876–1.000, respectively, which were higher than ADC (0.687–0.957), except the control group VS. fibrosis group (F0 versus F1-2-3-4)Conclusion
Correlation between fibrosis stages and diffusion parameters, collagen content and diffusion parameters both showed that Dapp and DDC from the non-Gaussian model were superior to the r of ADC. Non-Gaussian parameters Dapp and DDC were superior to ADC as diagnostic markers for staging of liver fibrosis.Discussion
ECM deposition as well as leakage of fluids from liver cells, and infiltration of inflammatory cells during liver fibrosis, can restrict diffusion of water molecules and lead to the reduction of the diffusion parameters (ADC, Dapp, DDC) [4] . The non-Gaussian model may more consistent with the real status of diffusion in liver fibrosis tissue probably due to the presence of various diffusion barriers such as ECMs, inflammation, hepatocyte ballooning, and steatosis [5]. SEM and DKI might provide more accurate information about diffusion in liver fibrosis. That as an effective complementary tool to the standard DWI monoexponential model. However, its clinical utility in the clinical evaluation of liver fibrosis remains to be evaluated.Acknowledgements
No acknowledgement found.References
1.Schuppan, D. and N.H. Afdhal, Liver cirrhosis. Lancet, 2008. 371(9615): p. 838-51.
2. Hu, G., et al., Intravoxel incoherent motion MRI evaluation for the staging of liver fibrosis in a rat model. J Magn Reson Imaging, 2015. 42(2): p. 331-9.
3.Wang, Y.X., et al., T1rho MR imaging is sensitive to evaluate liver fibrosis: an experimental study in a rat biliary duct ligation model. Radiology, 2011. 259(3): p. 712-9.
4. Anderson, S.W., et al., Characterizing non-gaussian, high b-value diffusion in liver fibrosis: Stretched exponential and diffusional kurtosis modeling. J Magn Reson Imaging, 2014. 39(4): p. 827-34.
5.Sheng, R.F., et al., Diffusion kurtosis imaging and diffusion-weighted imaging in assessment of liver fibrosis stage and necroinflammatory activity. Abdom Radiol (NY), 2017. 42(4): p. 1176-1182.
Figures
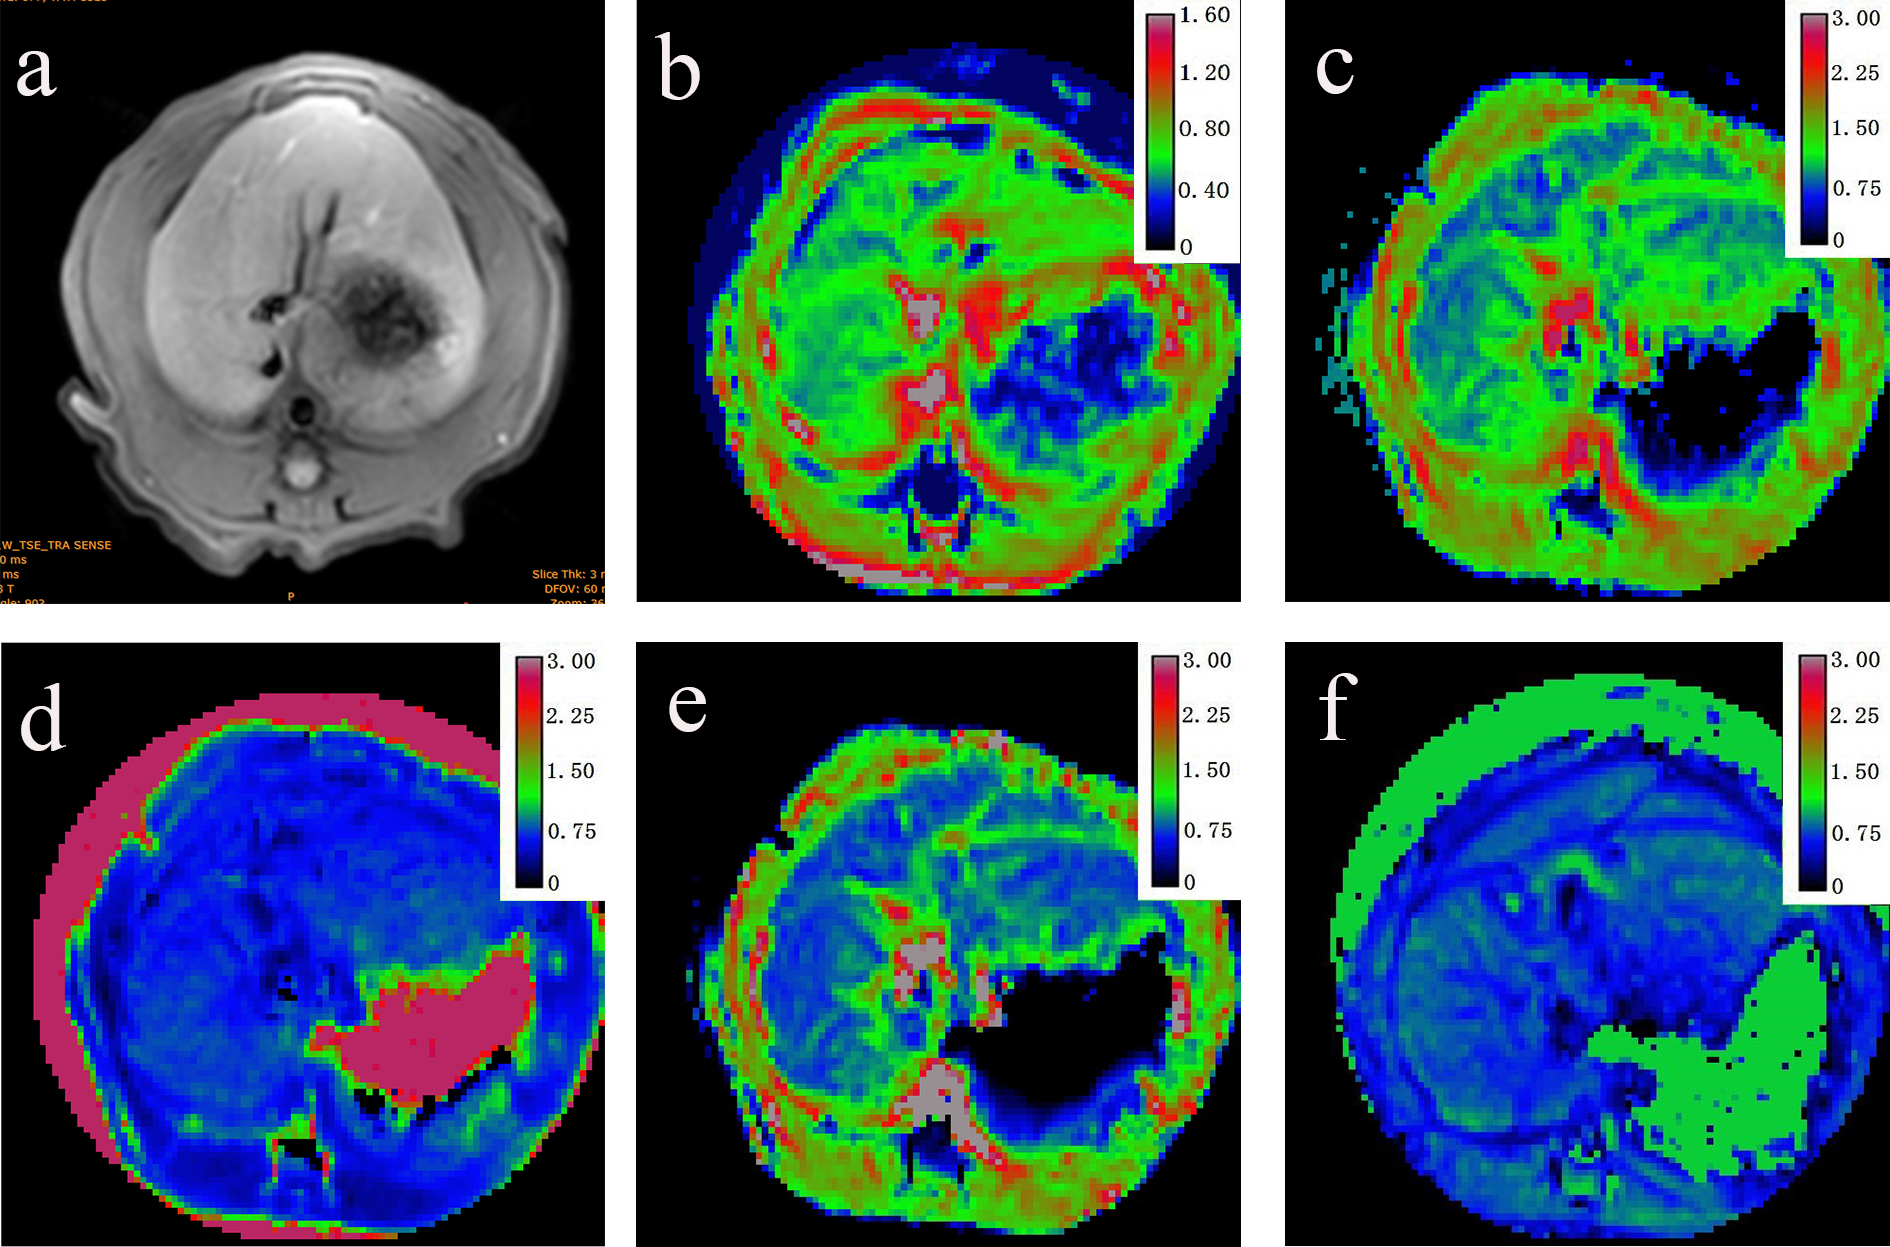
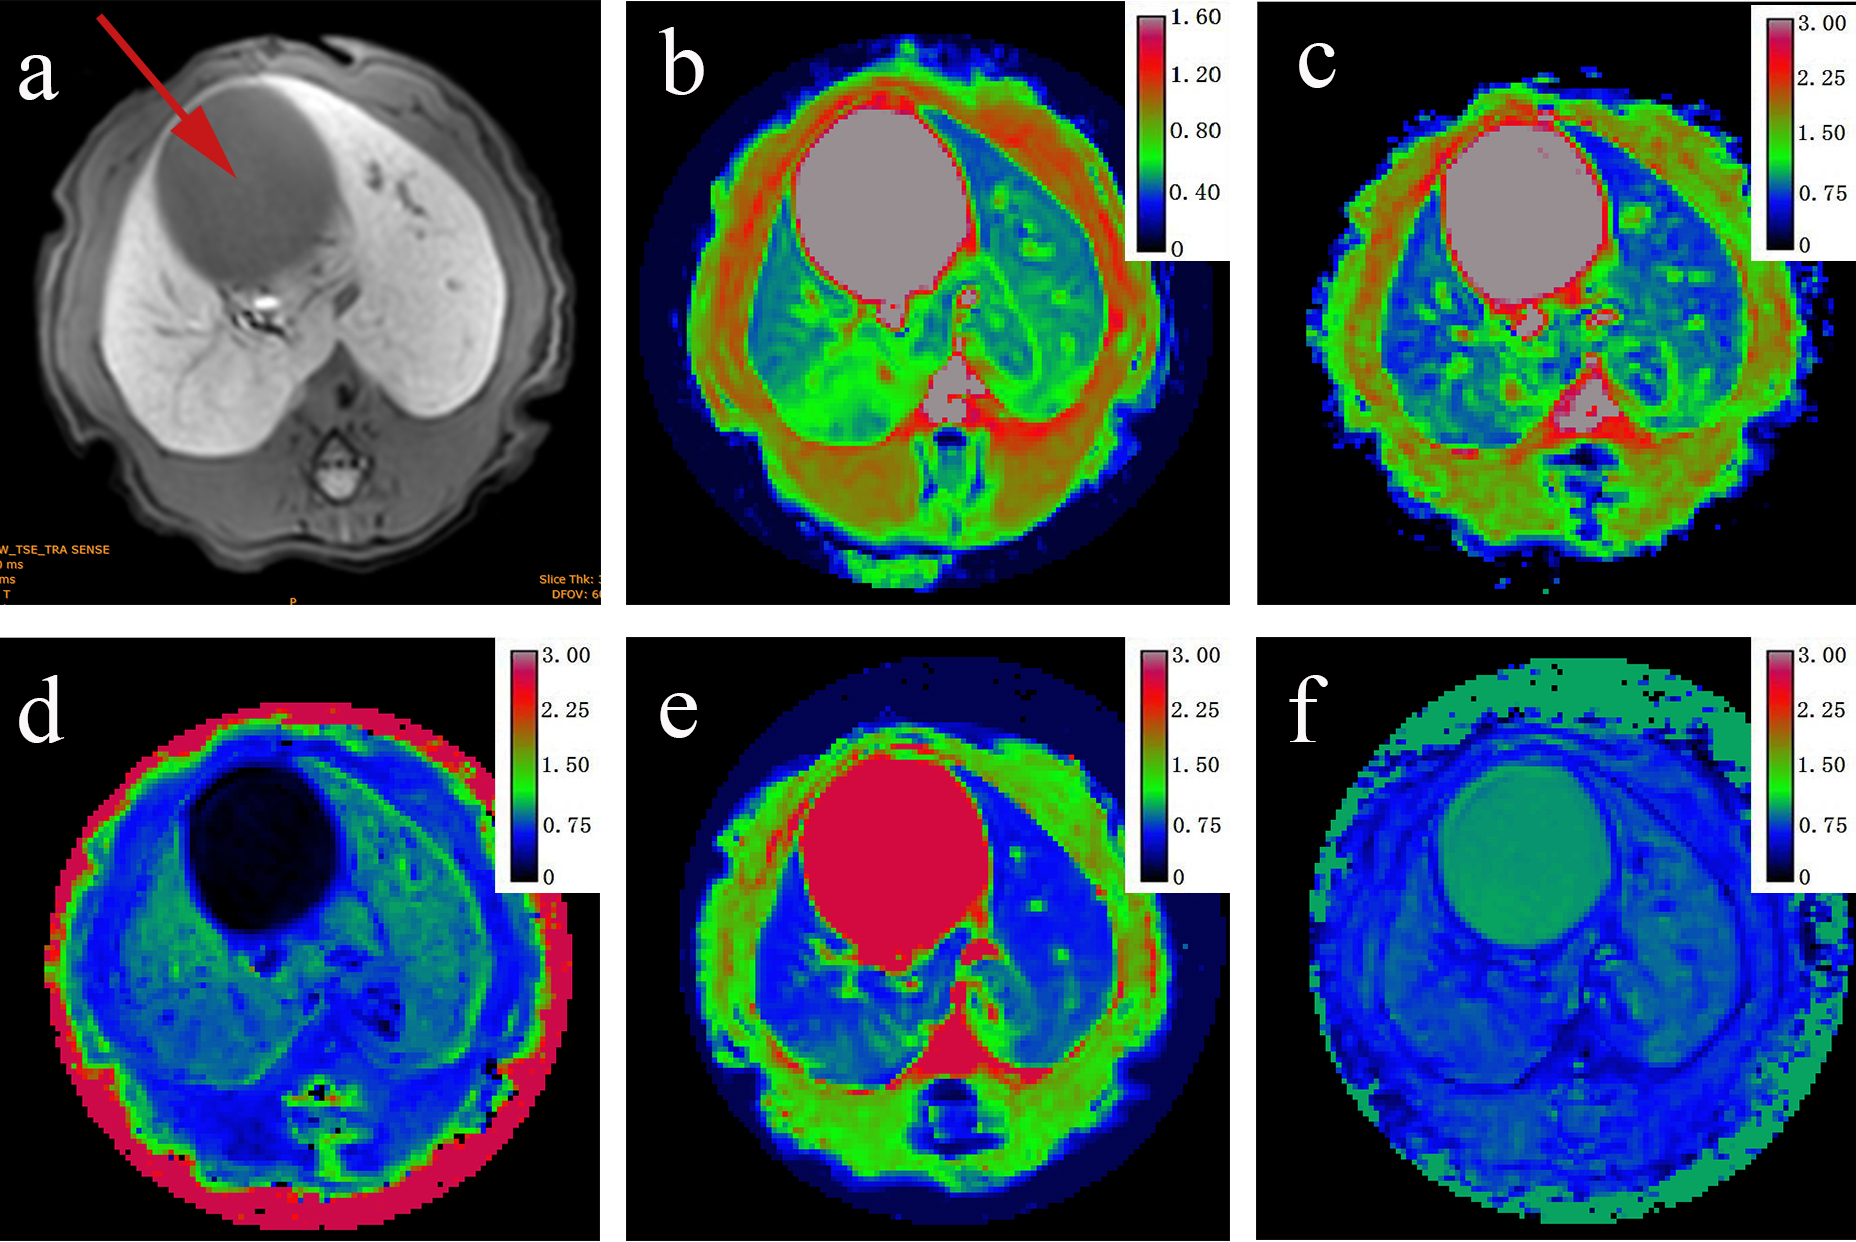
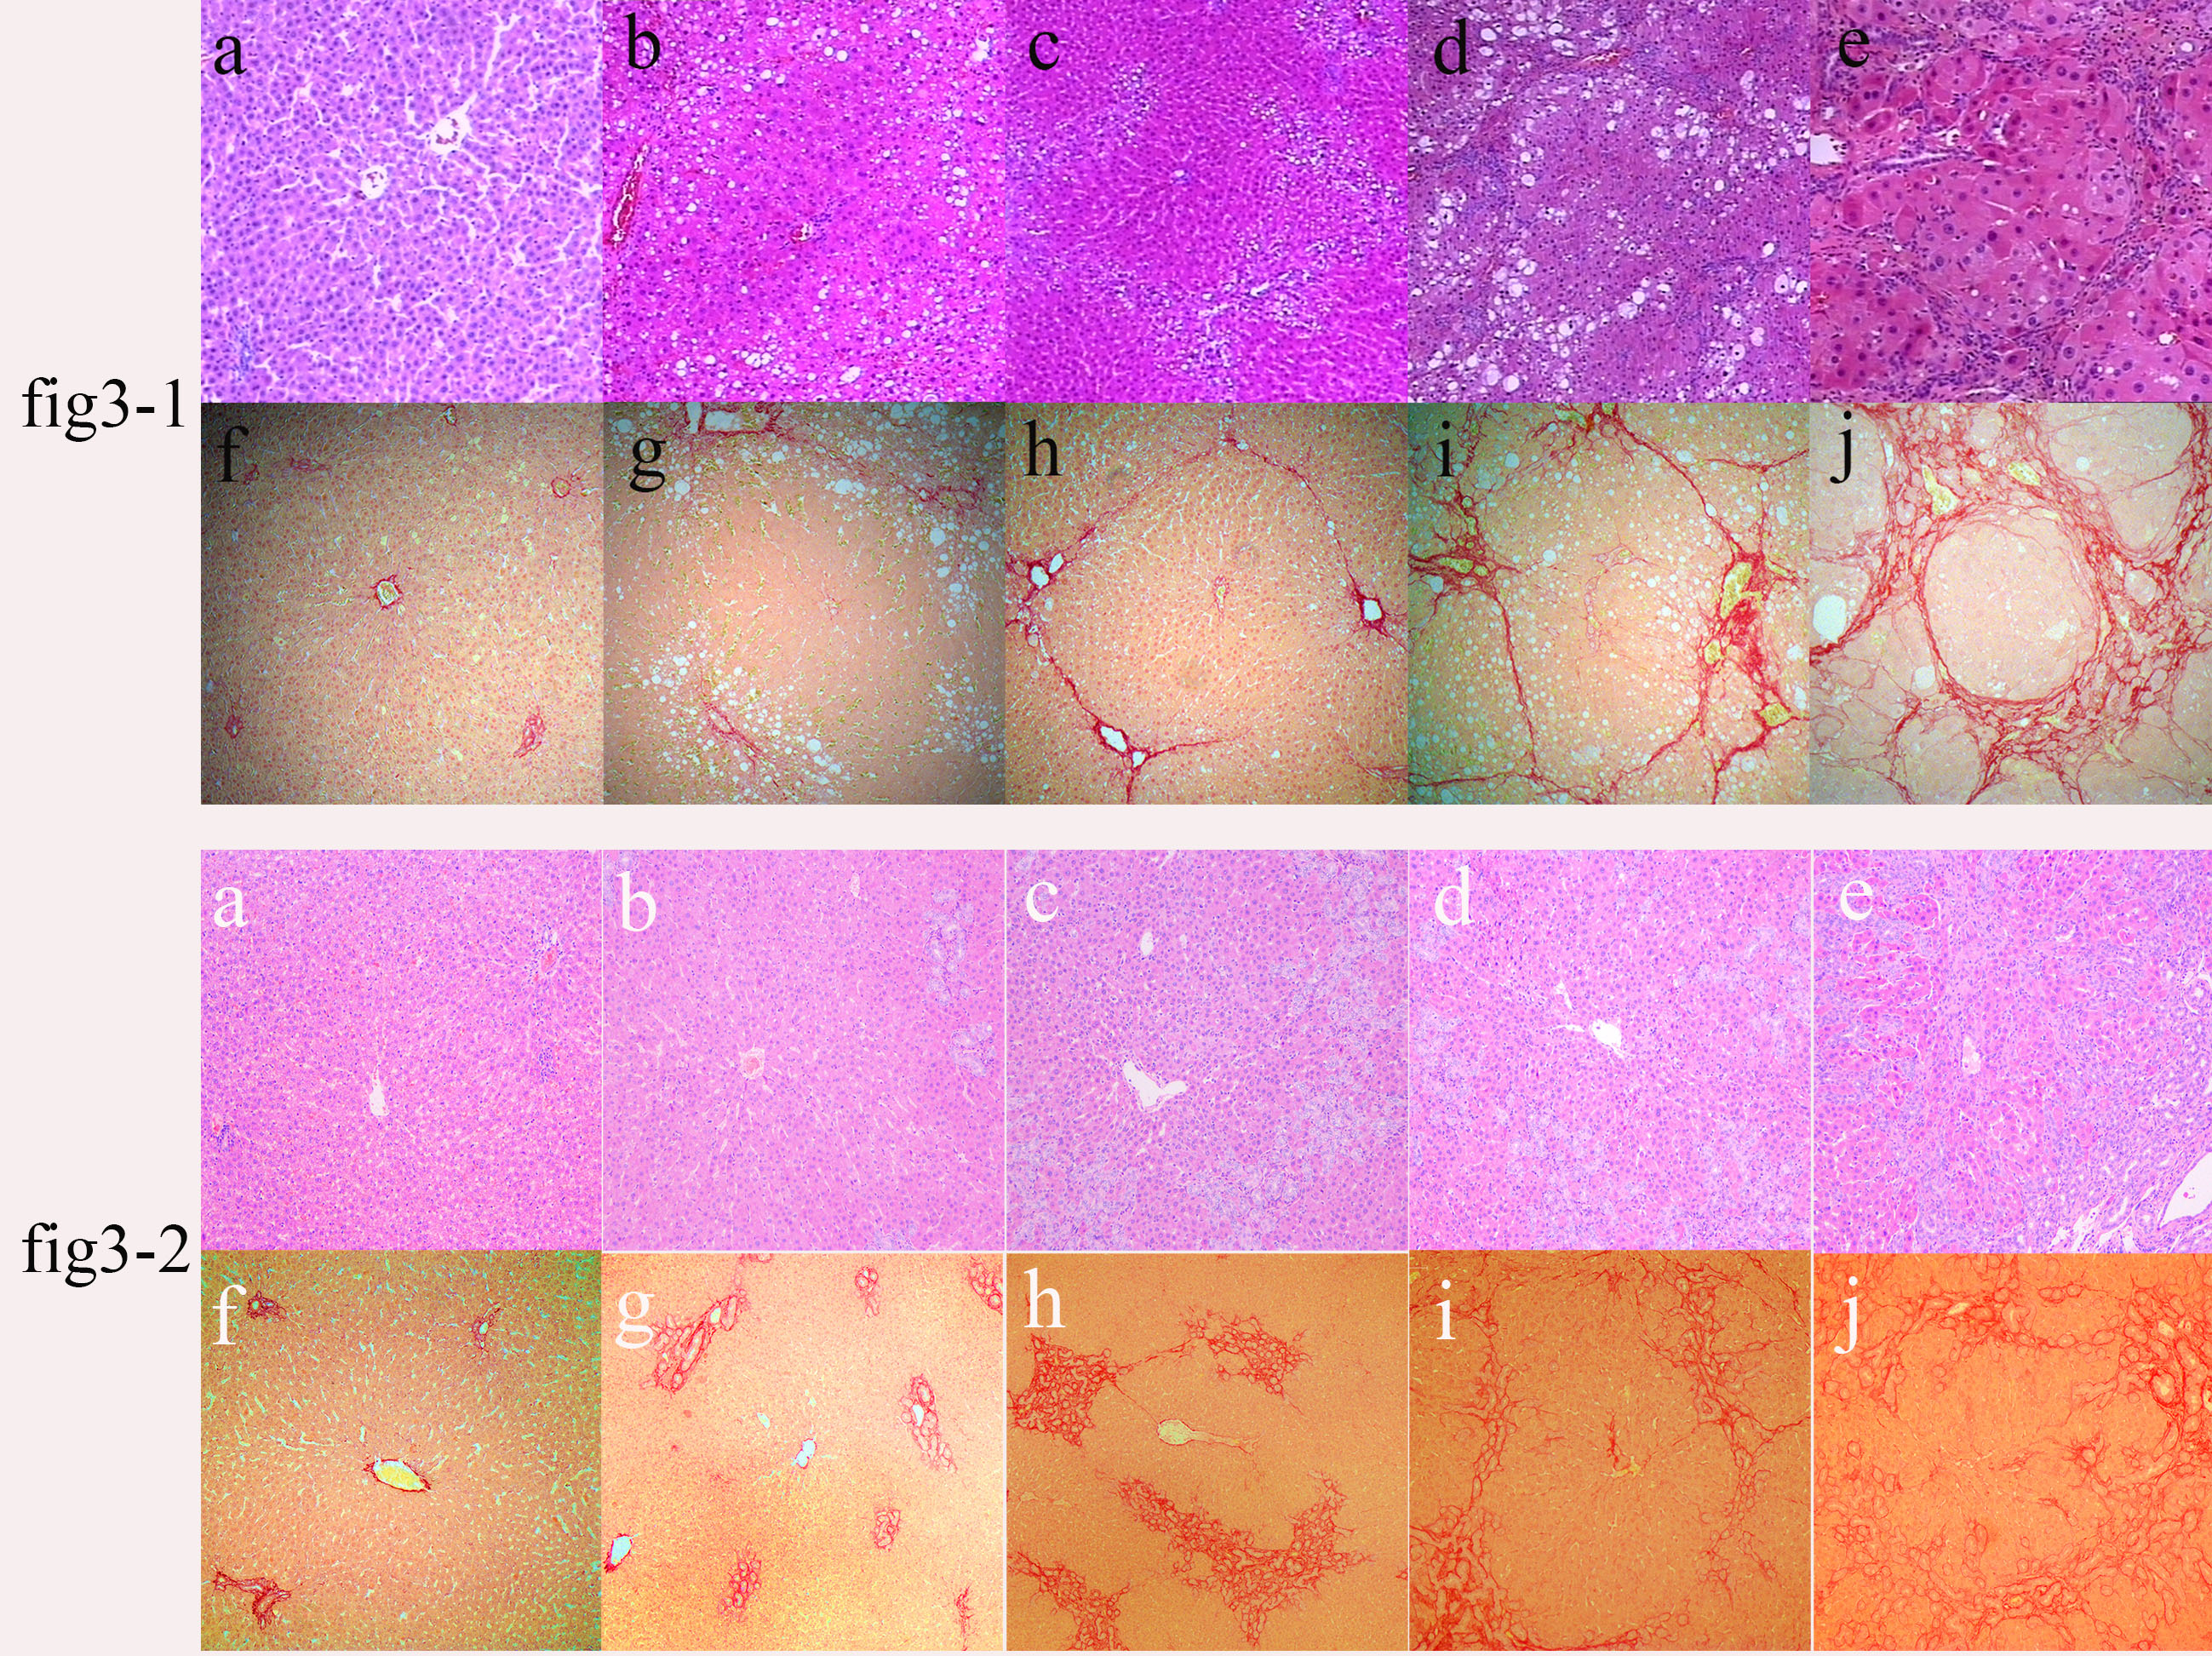
Figure 3-1. Typical hematoxylin and eosin (H&E) staining and picrosirius red staining for representative samples in the carbon tetrachloride (CCl4) group. (a–e) Liver fibrosis stages F0–F4 (H&E; 10×20), (f–j) Liver fibrosis stages F0–F4 (picrosirius red; 10×20).
Figure 3-2. Typical hematoxylin and eosin (H&E) staining and picrosirius red staining for representative samples in biliary duct ligation (BDL) group. (a–e) Liver fibrosis stages F0–F4 (H&E; 10×20), (f–j) Liver fibrosis stages F0–F4 (picrosirius red; 10×20).

