0611
Gd-EOB-DTPA-enhanced T1ρ Imaging vs. Diffusion Metrics for Assessment Liver Inflammation and Early Stage Fibrosis of Nonalcoholic Steatohepatitis in Rabbits1Radiology, Southern Medical University, Guangzhou, China, 2Radiology, Central Hospital of Wuhan, Tongji Medical College, Huazhong University of Science and Technology, Wuhan, China, 3Central Hospital of Wuhan, Tongji Medical College, Huazhong University of Science and Technology, Wuhan, China, 4Pathology, Central Hospital of Wuhan, Tongji Medical College, Huazhong University of Science and Technology, Wuhan, China, 5Philips Healthcare, Beijing, China, 6Southern Medical University, Guangzhou, China
Synopsis
This study is to evaluate applications of T1ρ, T1ρ on hepatobiliary phase (HBP, with Gd-EOB-DTPA enhancement) and IVIM in assessing of early-stage NASH in rabbits model. Results show that T1ρ (HBP) after Gd-EOB-DTPA administration is a more sensitive method for assessment of NAFLD activity, while a combination of T1ρ(HBP) and IVIM showed highest diagnostic value.
Purpose
The diagnosis of NASH is critically important, but it is rather challenging to screen the NASH at its early stages for clinical intervention. Advanced inflammation or/and fibrosis may have an effect on hepatic transport of gadoxetic acid. This study is to investigate the correlations between T1ρ time and the severity of NASH (such as inflammation, fibrosis and overall activity scores) by using T1ρ MR imaging with Gd-EOB-DTPA enhancement, and the differences among T1ρ,T1ρ(HBP) and diffusion metrics derived from IVIM in diagnosis of early-stage NASH.Methods
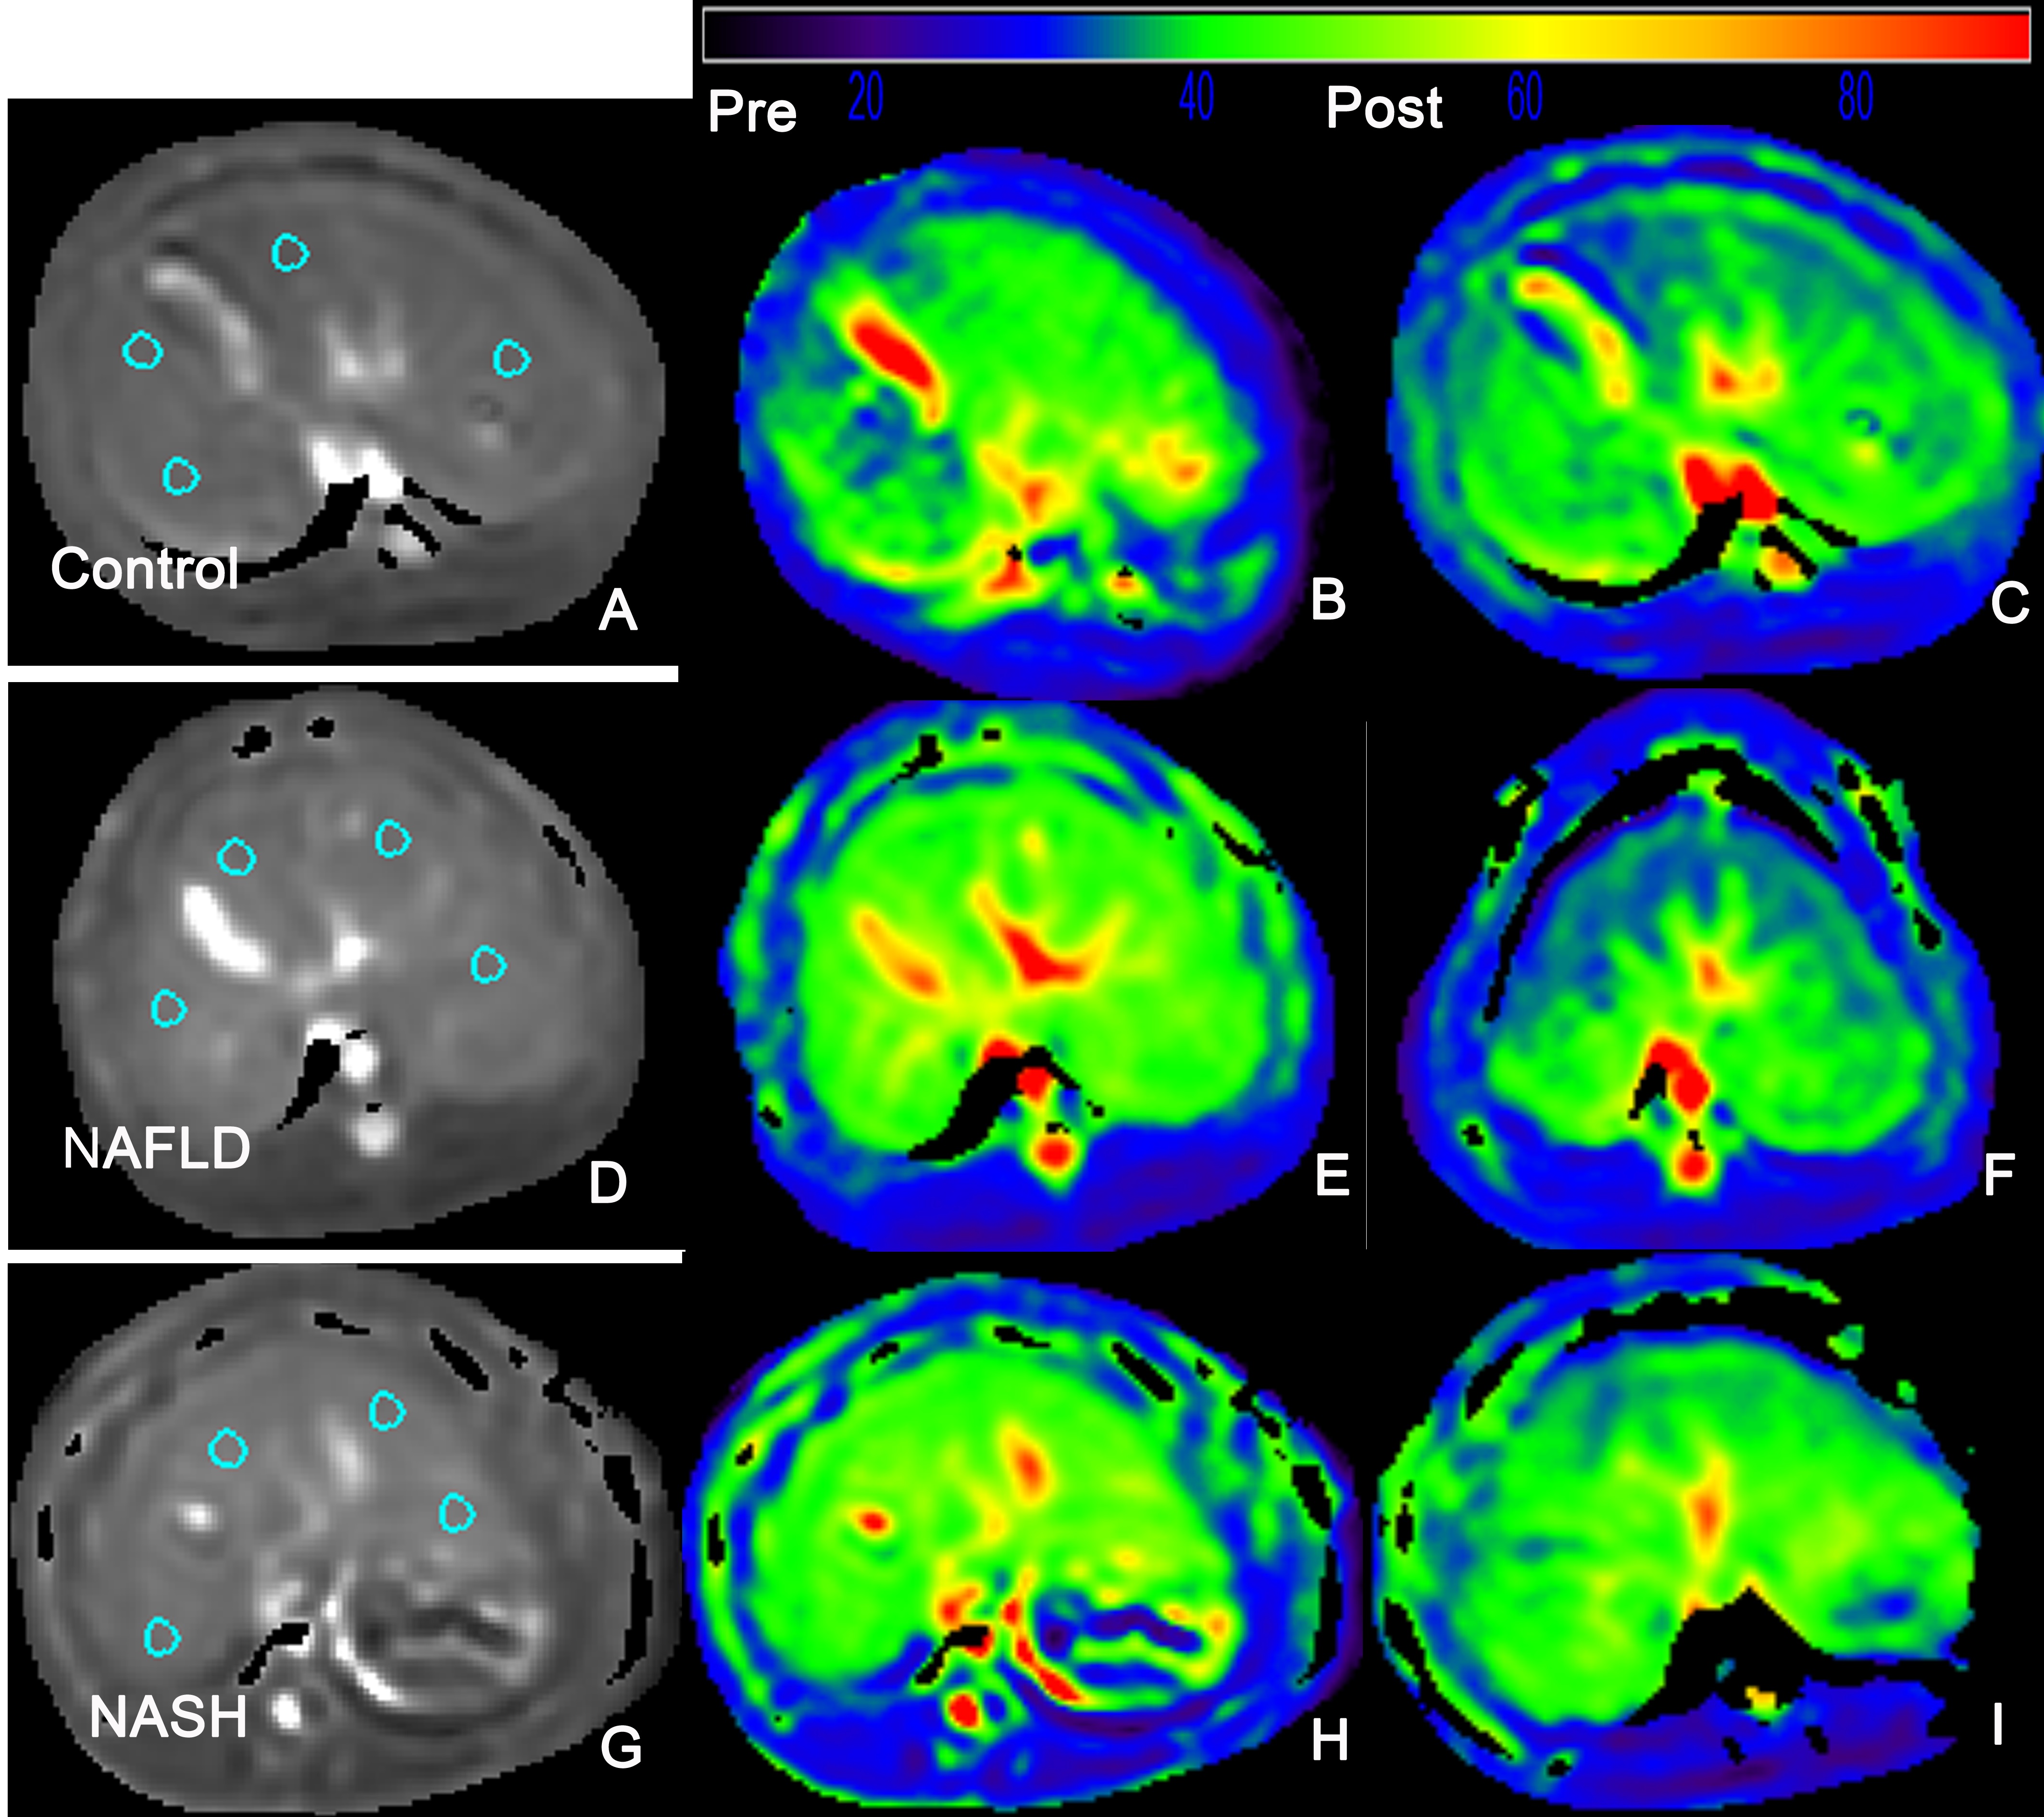
NASH rabbits model was induced by feeding a varied duration of high-fat, high-cholesterol diet. Gd-EOB-DTPA was administered as a bolus injection with a total 0.025 mmol/kg through the auricular vein at a flow rate of 2ml/s, followed by 2-3 ml saline chaser. T1ρ,T1ρ(HBP) before and 20min after administration of Gd-EOB-DTPA were performed on a 3.0T magnetic resonance (MR) imaging unit (Ingenia, Phillip Healthcare, Best, the Netherlands). Other examinations included single-shot T2WI(axial and coronal), enhanced-T1 high-resolution isotropic volume examination with in phase and out of phase method (mDIXON-eTHRIVE), intravoxel incoherent motion (IVIM) diffusion-weighted imaging. IVIM data was analyzed via bi-exponential model with f to be extracted. Histological findings according to semi-quantitative scoring of steatosis, inflammation, and fibrosis were acquired for reference. The diagnostic value of each parameter for NASH, inflammation and fibrosis severity were determined by means of receiver operating characteristics (ROC) analysis, with the respective cutoff values determined to accommodate best diagnostic accuracy based on Youden’s index. With an optimal cutoff value, the sensitivity, specificity, positive predictive value (PPV) and negative predictive value (NPV) were generated as well. P<0.05 was considered to be statistically significant.Results
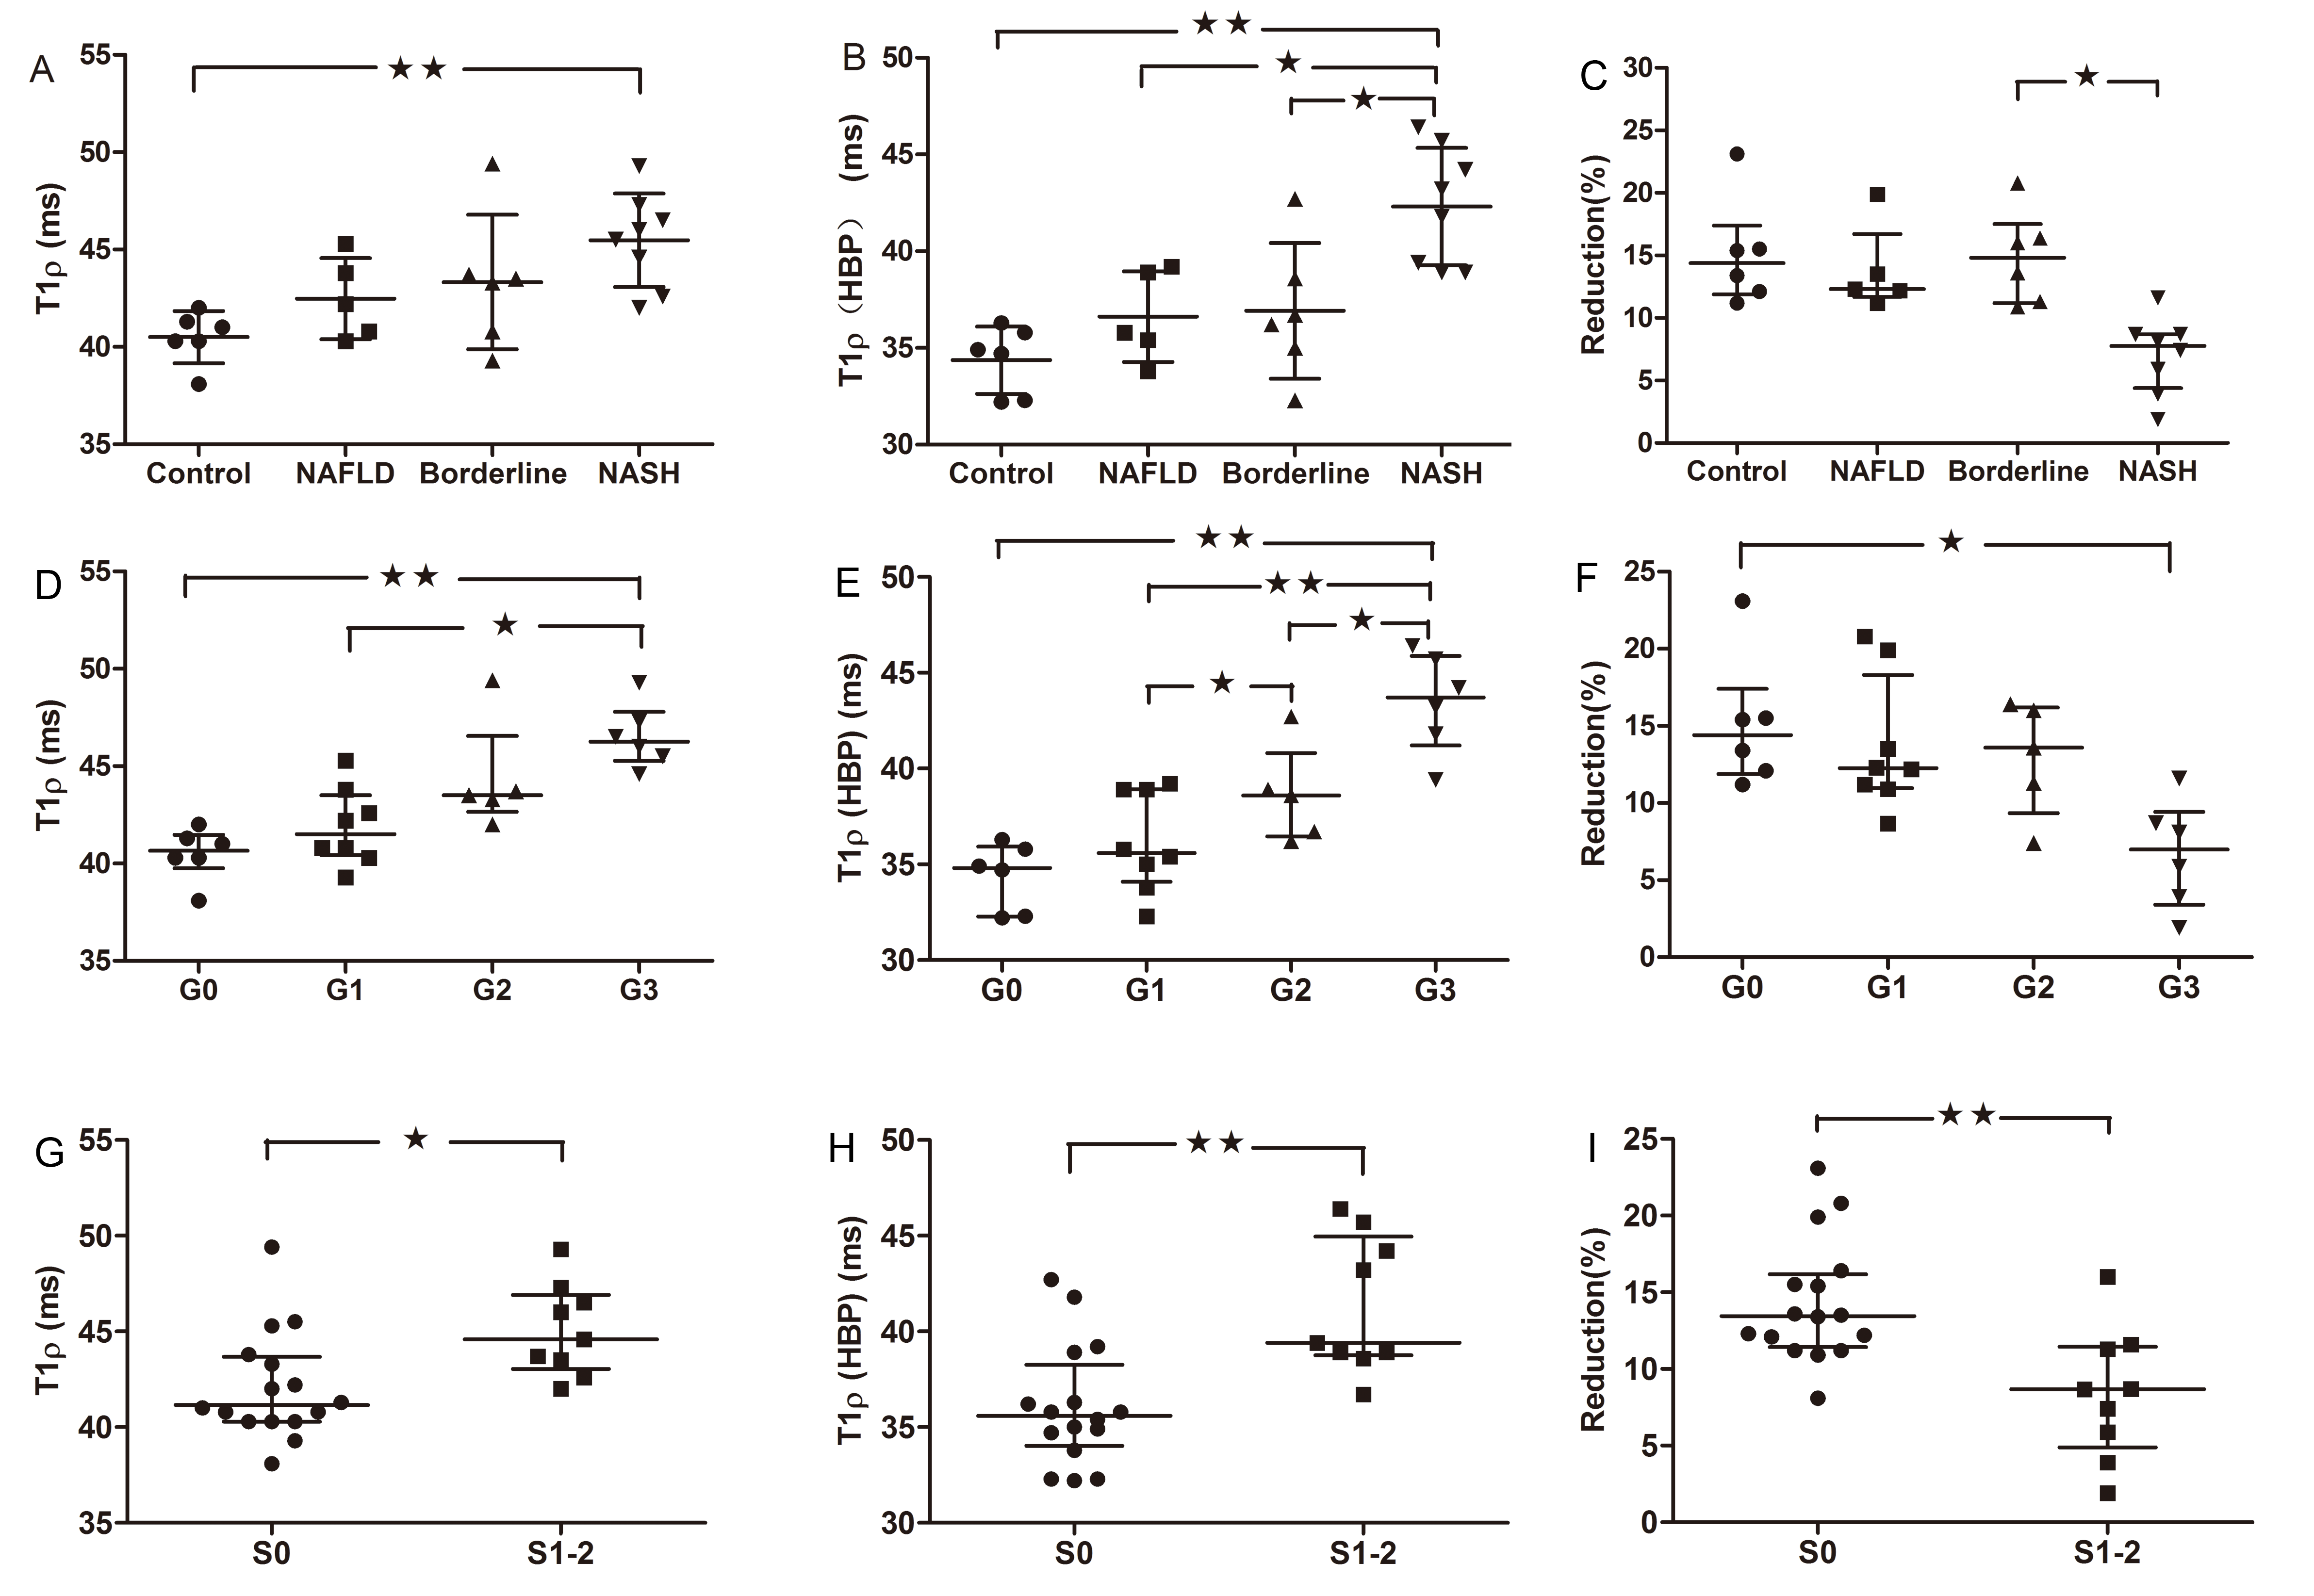
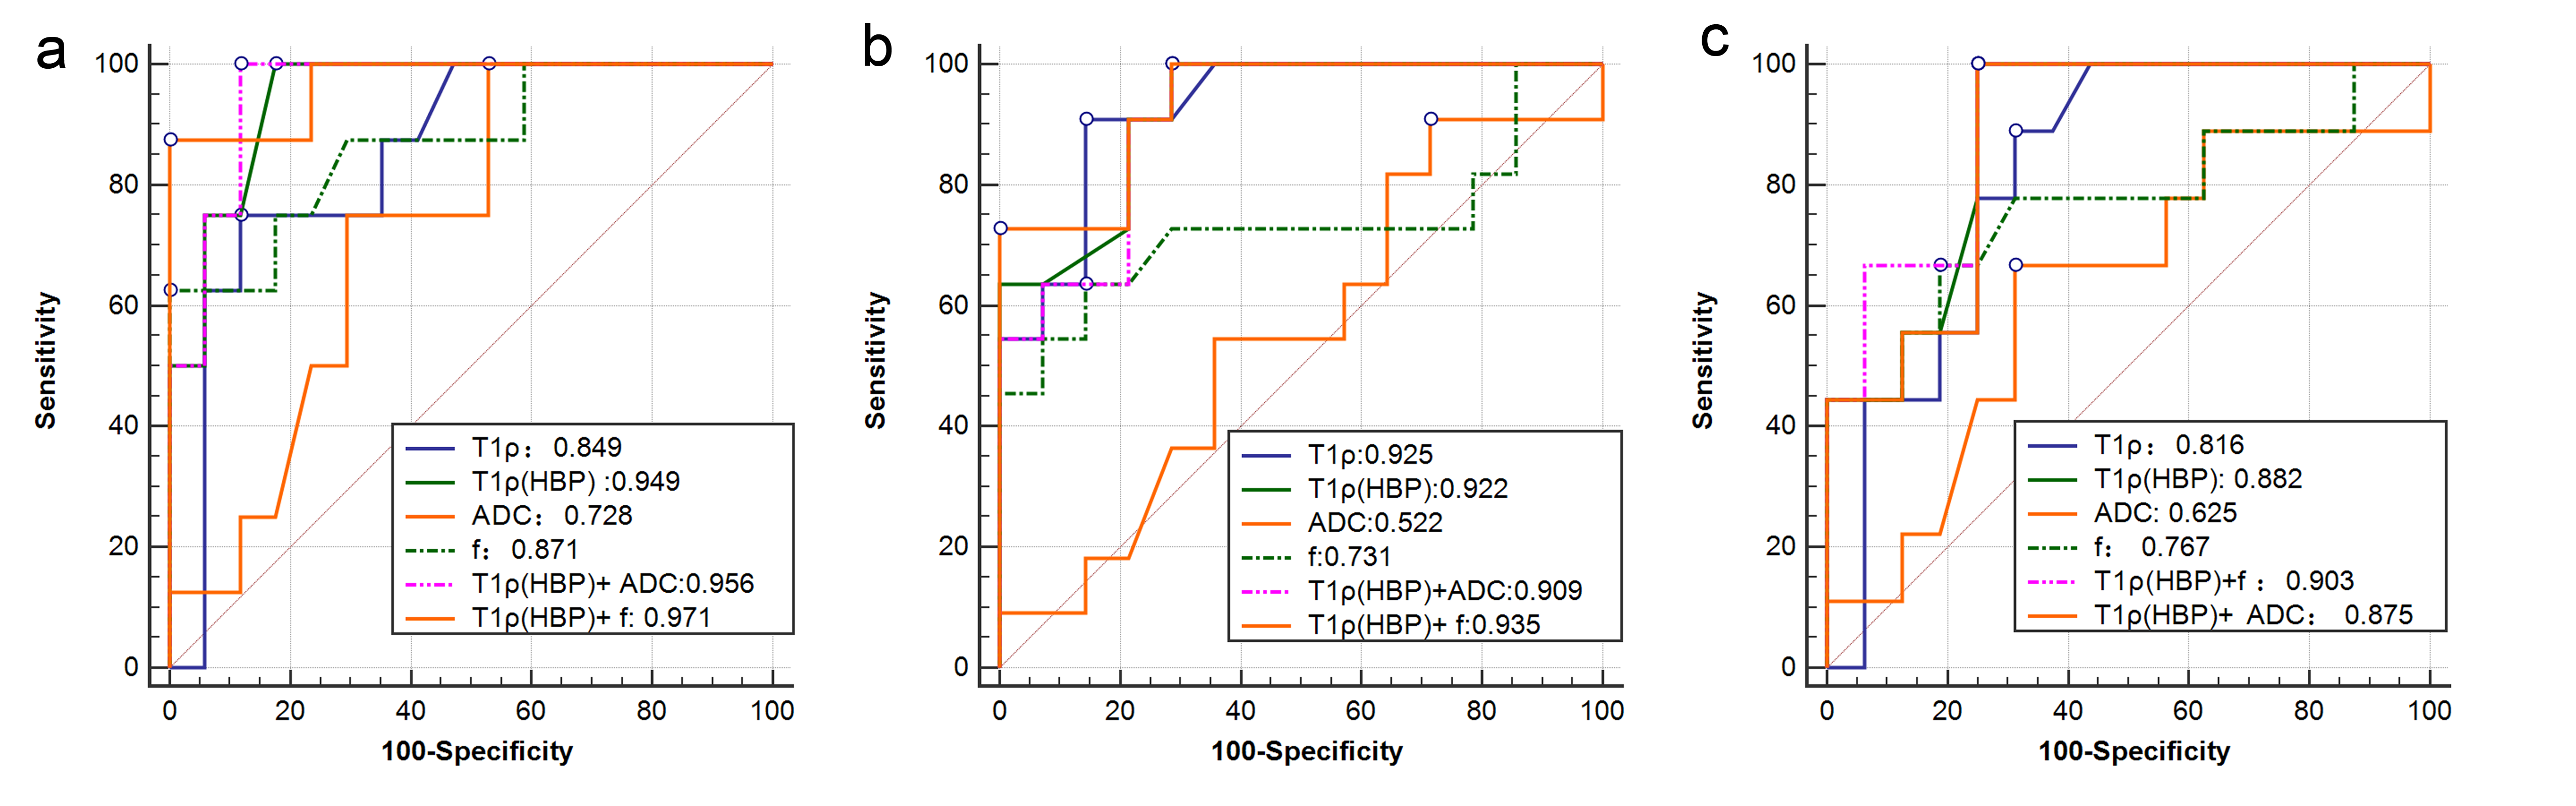
There was an association between T1ρ and overall activity (r = 0.658; p<0.001), between T1ρ and inflammation stage (r = 0.790; p<0.001). Mean T1ρ time shortened after administration of gadoxetic acid. Compared to NASH, mean T1ρ(HBP) time decreased significantly in rabbits without inflammation and fibrosis or slight inflammation. There was a strong association between T1ρ(HBP) and overall activity (r = 0.750; p<0.001), between T1ρ(HBP) and inflammation stage (r = 0.812; p<0.001). Whereas negative association presented between Reduction(reduction of T1ρ of pre and post-contrast) and overall activity (r = -0.631; p<0.001), between Reduction and inflammation stage (r = -0.538; p<0.01). There was negative association between f and inflammation(r = -0.480), whilst no significant relation between other three parameters (ADC, D* and D) and inflammation or overall activity. The areas under the receiver operating characteristic curves (AUCs) of f, ADC, T1ρ and T1ρ-HBP were 0.871, 0.728, 0.849 and 0.949 for differentiating NASH; 0.731, 0.552, 0.925 and 0.922 for G2-3 inflammation; and 0.767, 0.625, 0.816, and 0.882 for S1-2 fibrosis. Comparison of ROC curve showed T1ρ(HBP) had an optimal diagnostic performance for NASH [T1ρ(HBP) vs ADC, AUC:0.949 vs 0.728,P=0.043], inflammation[T1ρ(HBP) vs ADC, AUC:0.922 vs 0.552,P=0.003], fibrosis[T1ρ(HBP) vs ADC, AUC:0.882 vs 0.625,P=0.046]. The combination of T1ρ(HBP) + f showed highest diagnostic value for NASH(AUC:0.971), inflammation(AUC:0.935).Conclusion
This study showed that T1ρ on hepatobiliary phase (HBP) after Gd-EOB-DTPA administration might be a promising MRI for assessment of NAFLD activity. Semi-perfusion f derived from bi-exponential IVIM shows a moderate negative correlation with overall activity and inflammation stage. T1ρ values of pre and post-contrast by Gd-EOB-DTPA in staging inflammation and fibrosis has more diagnostic value than f derived from IVIM alone. Moreover, T1ρ(HBP) + f is a sensitive and accurate noninvasive biomarker for NASH activity assessment.Acknowledgements
Thank Prof. Andrews Trevor from University of Vermont College of Medicine for helping T1ρ design.References
1. Bellentani S, Marino M. Epidemiology and natural history of non-alcoholic fatty liver disease (NAFLD). Annals of hepatology. 2009;8 Suppl 1:S4-8.
2. Deng J, Fishbein MH, Rigsby CK, Zhang G, Schoeneman SE, Donaldson JS. Quantitative MRI for hepatic fat fraction and T2* measurement in pediatric patients with non-alcoholic fatty liver disease. Pediatric radiology. 2014;44(11):1379-87.
3. Guiu B, Petit JM, Capitan V, Aho S, Masson D, Lefevre PH, et al. Intravoxel incoherent motion diffusion-weighted imaging in nonalcoholic fatty liver disease: a 3.0-T MR study. Radiology. 2012;265(1):96-103.
4. Ding Y, Rao SX, Meng T, Chen C, Li R, Zeng MS. Usefulness of T1 mapping on Gd-EOB-DTPA-enhanced MR imaging in assessment of non-alcoholic fatty liver disease. Eur Radiol. 2014;24(4):959-66.
5. Federau C, Maeder P, O'Brien K, Browaeys P, Meuli R, Hagmann P. Quantitative measurement of brain perfusion with intravoxel incoherent motion MR imaging. Radiology. 2012;265(3):874-81.
6. Kleiner DE, Brunt EM, Van Natta M, Behling C, Contos MJ, Cummings OW, et al. Design and validation of a histological scoring system for nonalcoholic fatty liver disease. Hepatology. 2005;41(6):1313-21.
7. Feier D, Balassy C, Bastati N, Fragner R, Wrba F, Ba-Ssalamah A. The diagnostic efficacy of quantitative liver MR imaging with diffusion-weighted, SWI, and hepato-specific contrast-enhanced sequences in staging liver fibrosis--a multiparametric approach. Eur Radiol. 2016;26(2):539-46.
Figures