0610
A Novel Analysis Strategy for Assessing Liver Lipid Composition with Magnetic Resonance Spectroscopy1Radiology, University of Minnesota, Minneapolis, MN, United States, 2Pediatrics, University of Minnesota, Minneapolis, MN, United States
Synopsis
Measuring lipid composition (e.g., saturation levels) with MRS requires analysis of small lipid resonances in addition to the 1.3 ppm methylene peak. This is straightforward in adipose tissue but difficult in the liver due to lower concentration and greater spectral linewidths. In this work we propose a new fitting method that models the full lipid spectrum from 3 parameters and fits a multi-TE array of spectra simultaneously. This approach produces repeatable and physically reasonable estimations of liver fat composition in a wide range of fat factions.
Introduction
Measurement of the liver fat fraction (FF) is now commercially available and routine, but measuring lipid composition (1,2) in the liver is more difficult. Hamilton et al. (3) used MRS to develop a descriptive model which parameterized the liver lipid spectrum using three parameters: number of double bounds (ndb), number of methylene-interrupted double bonds (nmidb), and mean chain length (CL). This model has been widely used for Dixon image reconstruction, but their MRS fitting approach was only able to fit all the relevant lipid peaks in subjects with high FF (>40%).
In this work we propose a new MRS fitting strategy with the goal of estimating lipid composition in subjects with moderate FF (<40%). This approach uses the model of Hamilton et al. to reduce the degrees of freedom (DoF) in the fitting procedure and directly estimate the composition parameters. Additionally this approach fits across multiple TE values simultaneously to jointly estimate the T2 decay and its impact on the spectral lineshape. The purpose of this study was to assess the proposed fitting strategy and determine which metrics could be most reliably estimated.
Methods
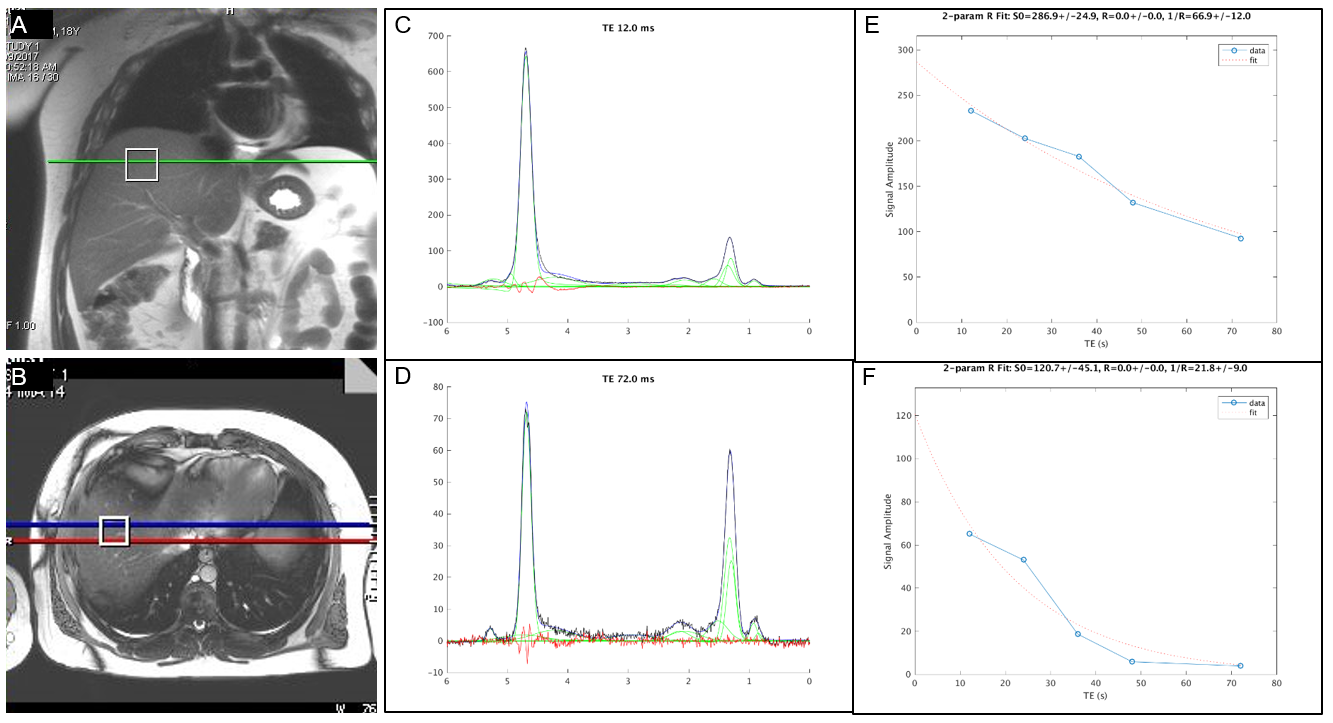
Forty-three MRI scans were performed on 26 adolescents (age 12-18) in an IRB-approved study of pediatric obesity. Scans were acquired with a 3T Siemens Prisma scanner using spine and anterior body array coils. Using T2-weighted images, a 27 cm3 voxel was placed in the right lobe of the liver, avoiding large vessels. Spectra were acquired using STEAM (TR/TM=3000/10 ms) with 5 TE values (TE=12, 24, 36, 48, 72 ms) over a 15 s breath-hold, and automatically processed to produce a reference FF by the vendor’s software. MRS scans were acquired twice to assess scan-to-scan repeatability.
The raw spectra were analyzed in Matlab using two approaches. Method A followed ref (3), fitting each spectrum with 13 Gaussian resonances covering 0.8 – 5.4 ppm. The resulting peaks were assigned to water or one of 6 lipid resonances (5.3, 4.2, 2.75, 2.1, 1.3, 0.9 ppm) based on frequency. The peak amplitudes were fit to a monoexponential decay to estimate T2 and M0. Peaks were considered unmeasurable if the standard deviation of M0 (based on Cramer-Rao) was >50%. The ndb was calculated using the 5.3 ppm and the total fat signal, while nmidb was calculated using the 5.3 and 1.3 ppm amplitudes, following expressions in (3).
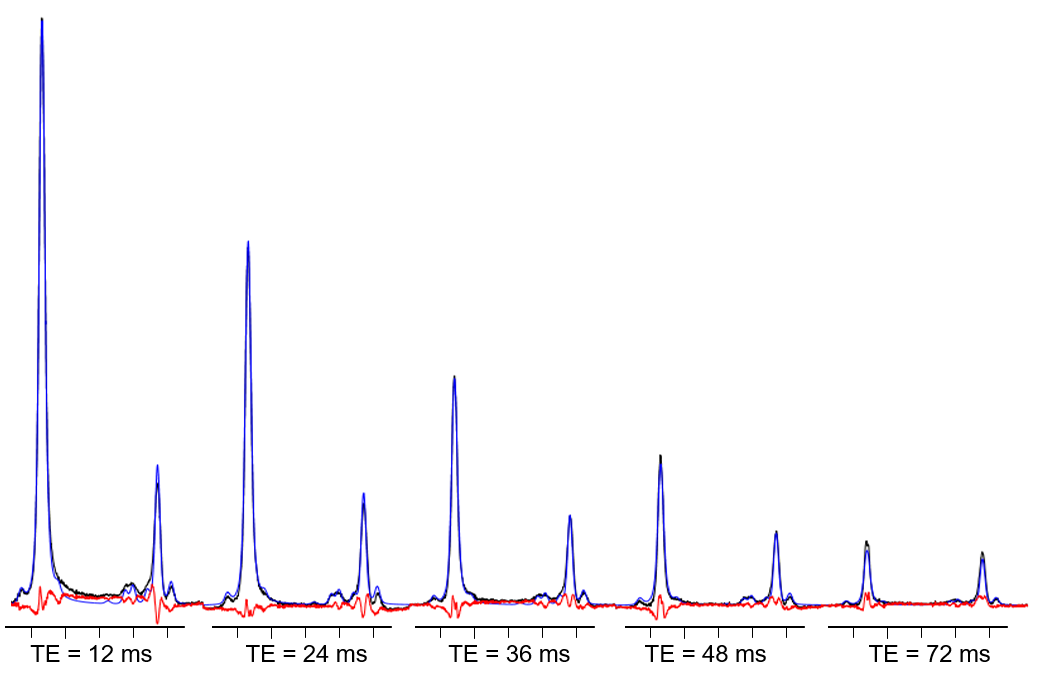
Method B modeled the spectrum as a water peak plus a 9-resonance lipid spectral model (5.29, 5.19, 4.2, 2.75, 2.24, 2.02, 1.6, 1.3, 0.9 ppm) determined by 3 parameters (ndb, nmidb, CL). All 5 TE values were fit simultaneously. The T2 values for all lipid peaks except 0.9 and 1.3 ppm were fixed at 51 ms (3), and the CL was fixed at 17.5 (4). Small variations in frequency and phase were allowed for each TE. Each resonance was modeled as a Voigt line, including the estimated T2 effect. Parameters with a standard deviation >50% were considered unmeasurable. This model used 19 DoF to describe the spectra across all TEs, compared to 195 DoF for method A.
Results
The reference FF measurement ranged from 1.2-48.0% (mean 11.0%) and had excellent reproducibility (ICC=0.995). Figures 1 and 2 shows a typical dataset fit with methods A and B respectively. In this example the methods give similar residuals but large differences between the ndb and nmidb estimates.
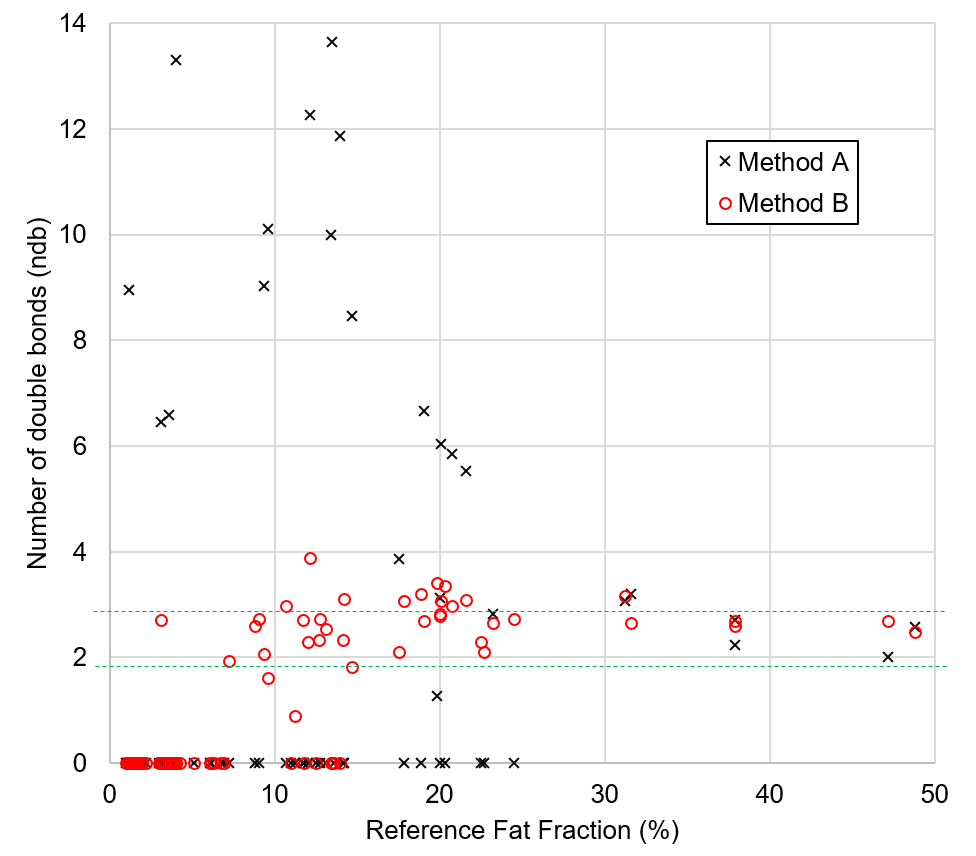
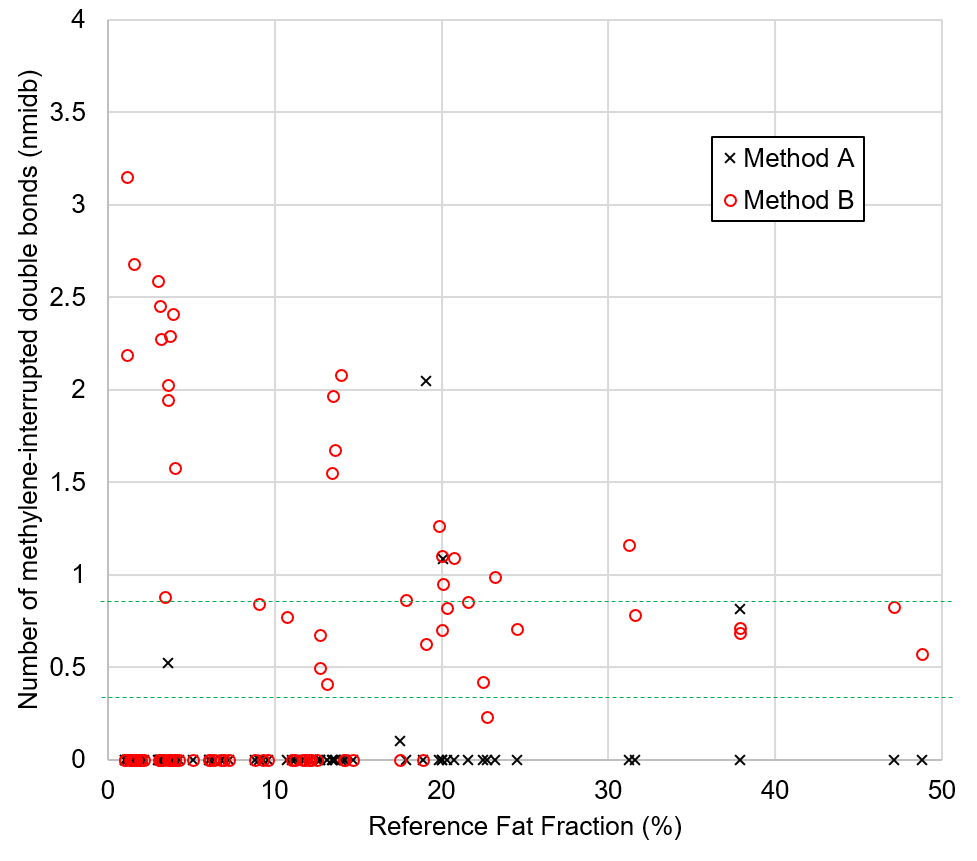
Figures 3 and 4 show the estimated values of ndb and nmidb for both methods as a function of FF. Both methods produce reasonable estimates of ndb for FF>30%, but for lower FF values only method B produces metrics in a physically plausible range (3–6). Estimates for nmidb were more variable than for ndb, especially at low FF.
Method B produced a measurable ndb estimate in 38/86 spectral measurements (44%), with ndb ranging from 0.88-3.89, mean 2.63, stdev 0.55. In 17 of studies, ndb was measurable in both the first and second scans, enabling assessment of repeatability. In this group the ICC was 0.4846, and the mean coefficient of variation was 10.7%, indicating moderate consistency between the two scans.
Discussion
These results indicate that method B may give useful values for ndb, whereas the other metrics were not reliable. Estimation of polyunsaturated fatty acids (via nmidb) is more challenging than estimating the total number of double bonds, because nmidb depends greatly on the 2.75 ppm lipid resonance, which is difficult to fit accurately at low SNR levels.Conclusion
The proposed spectral fitting technique uses prior knowledge and reduced DoF to enable reliable liver lipid composition measurement at moderate levels of liver fat accumulation.Acknowledgements
Funding provided by NIH P41 EB015894, NIH R01 DK105953, and the UMN Medical School FoundationReferences
1. Machann J, Stefan N, Wagner R, Bongers M, Schleicher E, Fritsche A, Haering H-U, Nikolaou K, Schick F. Intra- and interindividual variability of fatty acid unsaturation in six different human adipose tissue compartments assessed by H-1-MRS in vivo at 3T. Nmr Biomed. 2017;30:e3744. doi: 10.1002/nbm.3744.
2. Ren J, Dimitrov I, Sherry AD, Malloy CR. Composition of adipose tissue and marrow fat in humans by 1H NMR at 7 Tesla. J. Lipid Res. 2008;49:2055–2062. doi: 10.1194/jlr.D800010-JLR200.
3. Hamilton G, Yokoo T, Bydder M, Cruite I, Schroeder ME, Sirlin CB, Middleton MS. In vivo characterization of the liver fat 1H MR spectrum. NMR Biomed. 2011;24:784–790. doi: 10.1002/nbm.1622.
4. Hamilton G, Schlein AN, Middleton MS, Hooker CA, Wolfson T, Gamst AC, Loomba R, Sirlin CB. In vivo triglyceride composition of abdominal adipose tissue measured by 1H MRS at 3T. J. Magn. Reson. Imaging 2017;45:1455–1463. doi: 10.1002/jmri.25453.
5. Leporq B, Lambert SA, Ronot M, Vilgrain V, Van Beers BE. Quantification of the triglyceride fatty acid composition with 3.0 T MRI. NMR Biomed. 2014;27:1211–1221. doi: 10.1002/nbm.3175.
6. Peterson P, Månsson S. Fat quantification using multiecho sequences with bipolar gradients: Investigation of accuracy and noise performance. Magn. Reson. Med. 2014;71:219–229. doi: 10.1002/mrm.24657.
Figures