0606
PET-MRI Quantification of 89Zr-Iron Oxide Nanoparticles for Targeted Magnetic Drug Therapy1Radiology and Biomedical Imaging, University of California, San Francisco, San Francisco, CA, United States, 2Bioengineering, University of California, Berkeley, Berkeley, CA, United States
Synopsis
One recent application of magnetic nanoparticles is to deploy an endovascular magnetic device to selectively remove magnetically-linked chemotherapy during an intra-arterial treatment procedure. In order to measure the device’s efficacy, 89Zr-iron oxide nanoparticles could be imaged using PET-MR. We measured quantitative susceptibility values (Δχ), R2*, and 89Zr-PET uptake of increasing concentrations of 89Zr-IONP in vitro, and in liver in vivo by acquiring a multi-echo UTE GRE sequence and time-of-flight PET. Phantom evaluations demonstrated linear correlation between Δχ, R2*, and 89Zr-IONP uptake. In vivo, substantial increase was observed after 89Zr-IONP infusion. This approach shows promise tracking the biodistribution of radiolabelled magnetic nanoparticles.
Introduction
Targeted drug delivery using magnetic nanoparticles1 could reduce systemic toxicity of transarterial chemoembolization by conjugation to a chemotherapeutic drug, which is then extracted via the temporary deployment of an intravenous magnetic filtration device1 downstream of a tumor. Current in vitro methods use 89Zr-iron oxide nanoparticles (IONPs) to measure particle capture2. Before testing magnetically-linked chemotherapeutic drugs, accurate quantification of the unlinked nanoparticle distribution will be necessary to show efficacy in vivo. New hybrid PET-MR systems provide the clinical advantage of simultaneous large field-of-view scanning using PET, as well as the improved resolution and soft-tissue contrast of MRI. Since 89Zr decays by both positron emission and electron capture3, and IONPs have a large magnetic susceptibility and shorten MR relaxation times, 89Zr-IONP concentration could be quantified as a multi-modality imaging agent using PET-MR. Ultra-short echo time (UTE) sequences can be used to acquire signal from materials with a short T2* relaxation time. This work investigates three techniques for their ability to deliver quantitative information about the distribution of ferromagnetic 89Zr-IONPs.Methods
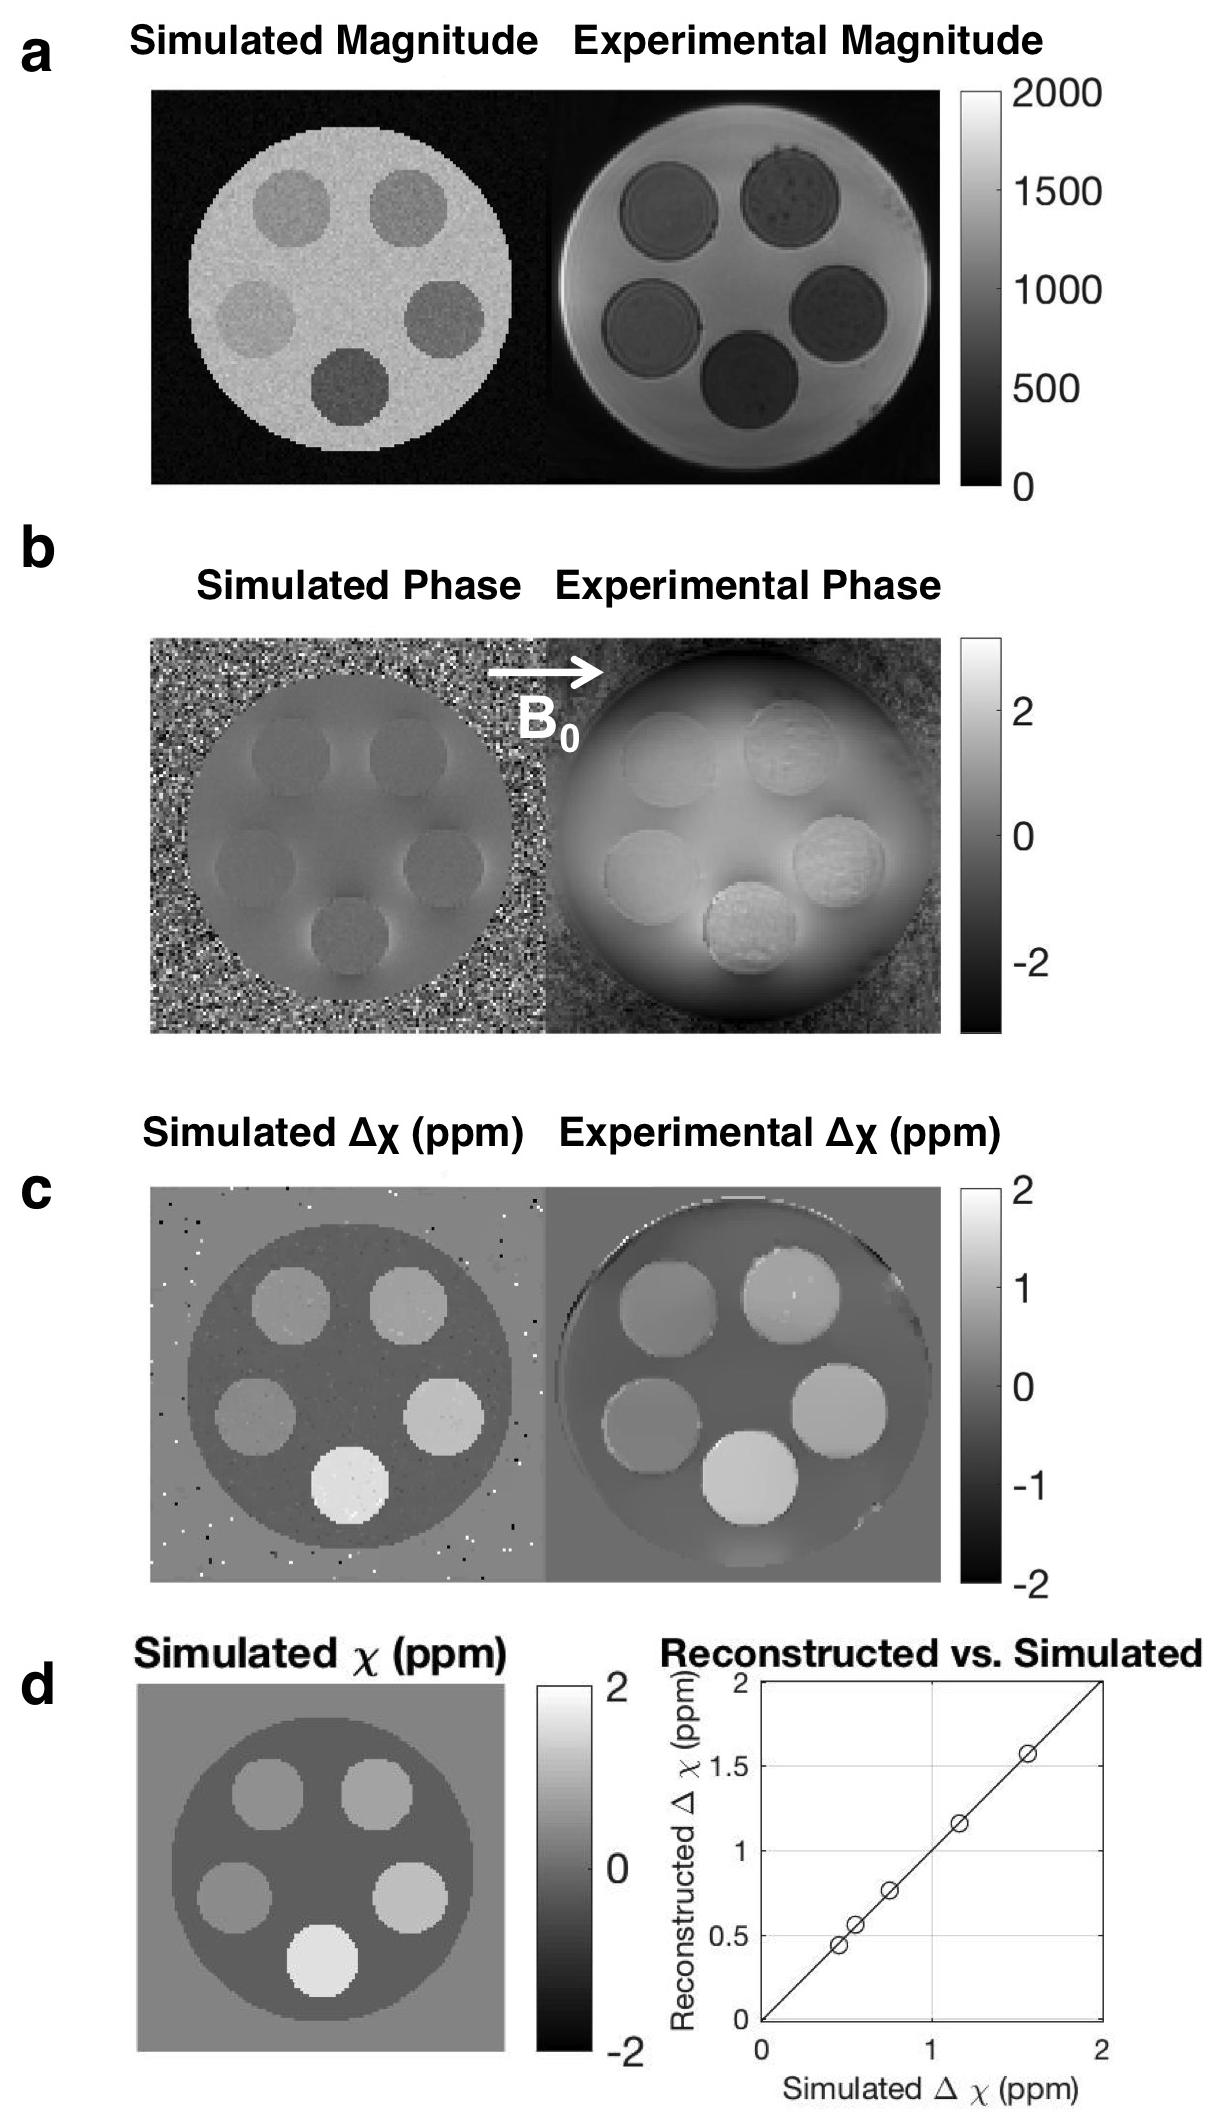
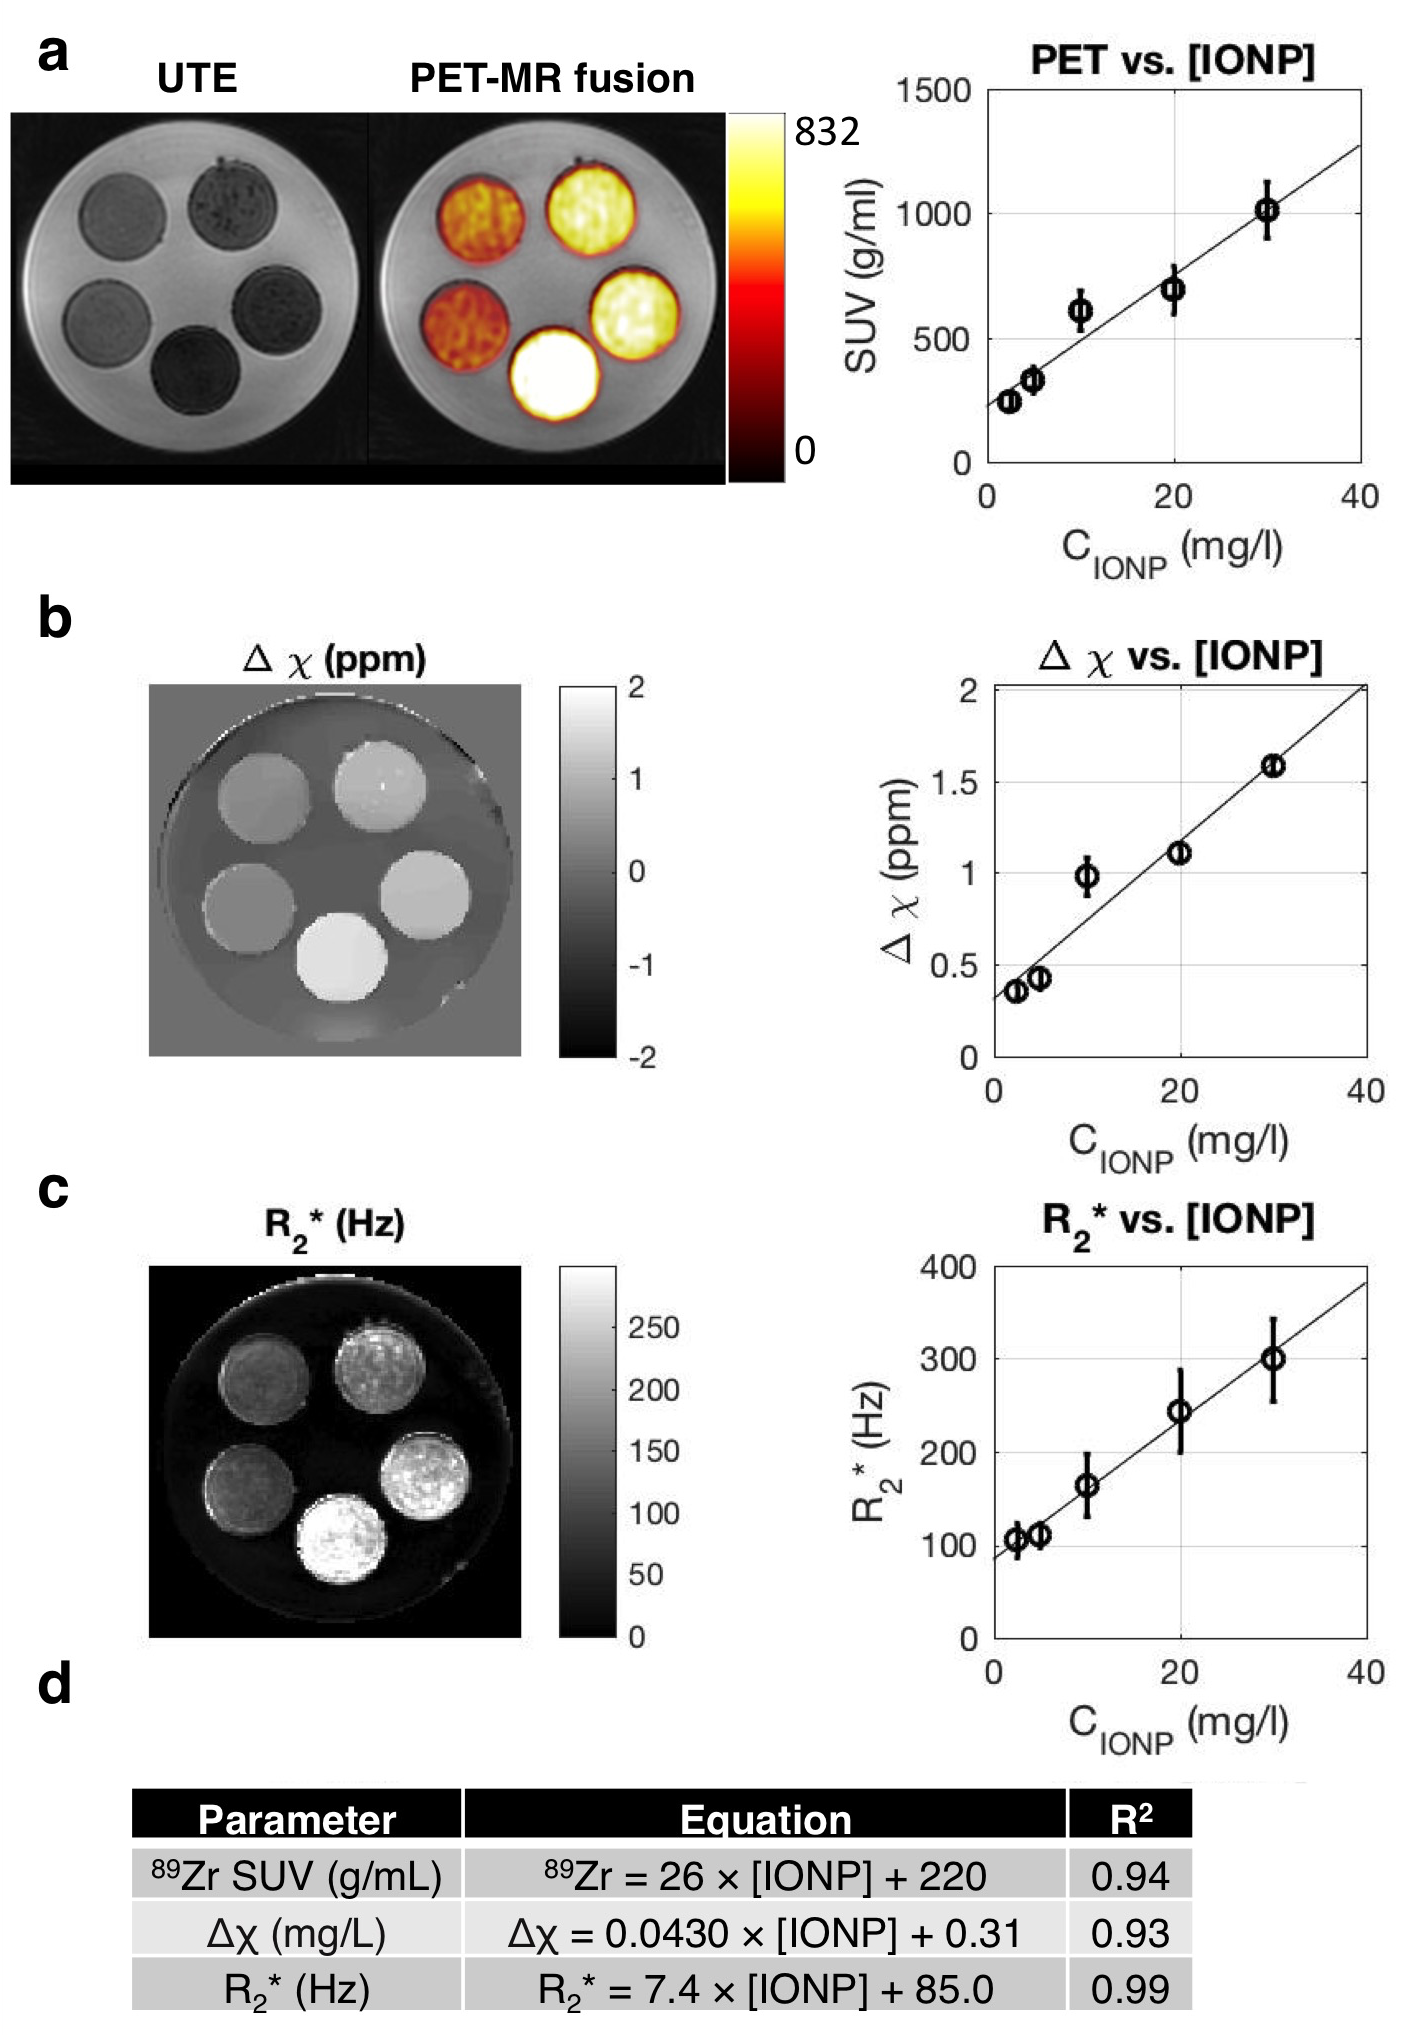
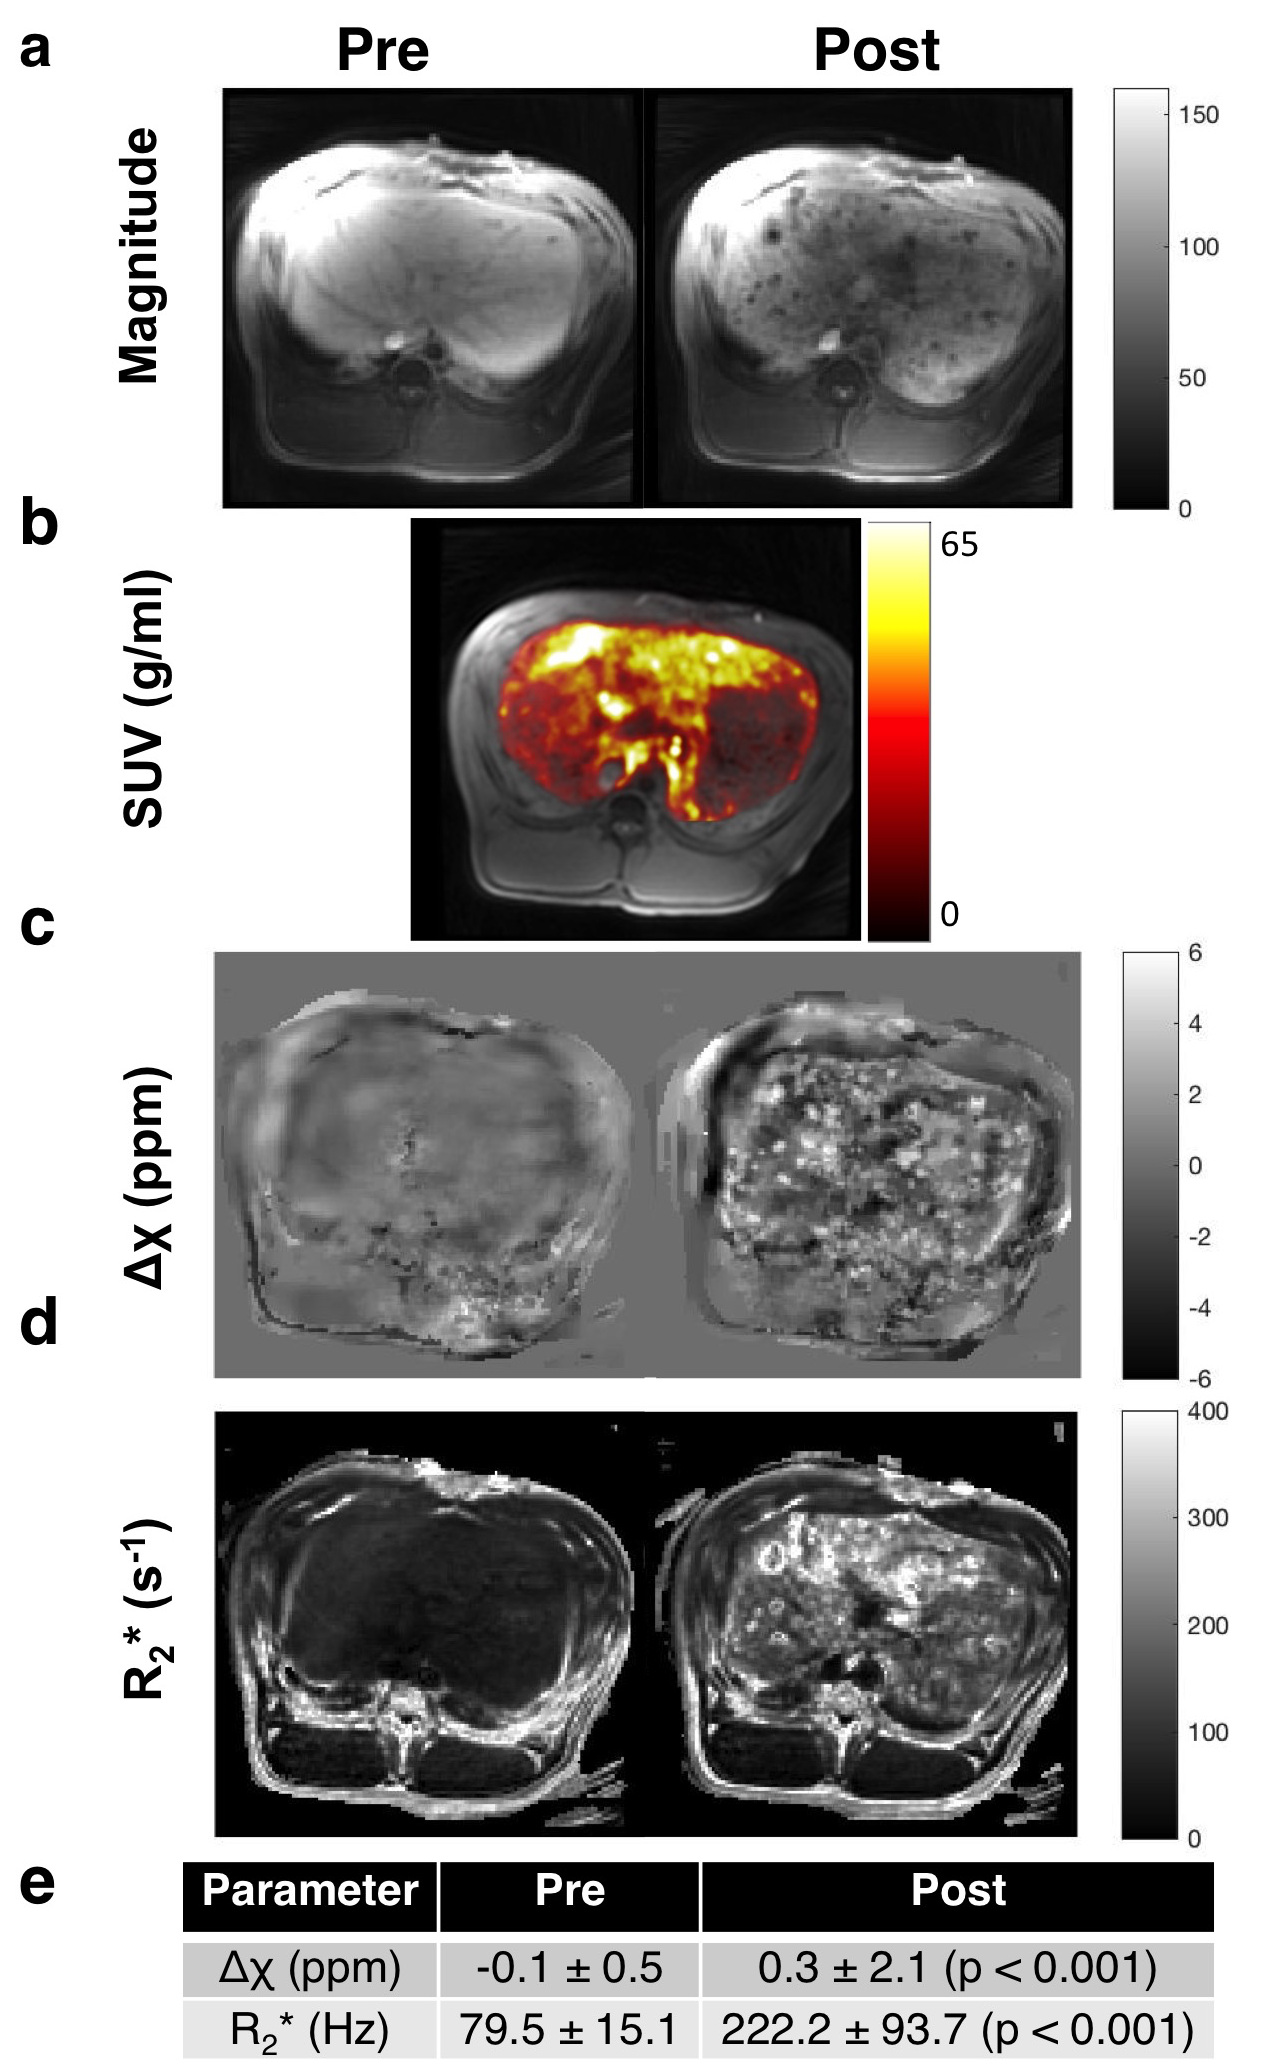
Susceptibility reconstruction validation numerical phantom: Quantitative susceptibility maps (QSM) were calculated using the Morphology Enabled Dipole Inversion (MEDI) toolbox in MATLAB (MathWorks, Natick, MA) in order to validate the software pipeline4. Specifically, the QSM processing pipeline included Laplacian phase unwrapping, background phase removal using the Laplacian Boundary Value method, and L1-norm optimization to solve the field-to-source inverse problem4. We simulated the magnitude and susceptibility of the iron oxide particle spheres based on experimental results, which were then used to simulate phase. These inputs were then used to calculate the susceptibility map. Phantom experiments: Iron (II, III) oxide Fe3O4 nanoparticles (magnetite) nanopowder with 50–100 nm diameter were used. IONPs were radiolabeled with 675 μCi of 89Zr per 16.75 mg IONP in 5 mL de-ionized water for an initial concentration of 3.35 mg/mL. A phantom was constructed using a cylinder of gelatin with five embedded ping pong balls, with increasing concentrations of [2.5, 5, 10, 20, 30] mg/L of 89Zr-IONP, experimentally chosen to have enough signal to be visible under MR, and also to be physiologically relevant with realistic tissue concentration. We used a SIGNA PET/MR system (GE Healthcare) to acquire simultaneous PET and MR data (time-of-flight PET; 3.0T magnet; 10 min), with a 12-channel Head and Neck Unit coil and a coronal scan plane. For susceptibility and R2* measurements, we acquired a 3D multi-echo cones UTE sequence5 and fat suppression. In vivo experiment: Under IACUC approval, a 5 Fr catheter was placed into the common hepatic artery of a single swine using X-ray system guidance. Imaging hardware was the same as above, except an 18-channel upper anterior array coil, and an axial scan plane was used. 25 mg IONPs were radiolabeled with 3.05 mCi 89Zr-IONPs in 10 mL saline, then distributed into three vials with volumes [1, 4, 5] mL. We imaged the swine before infusion, then infused the 89Zr-IONP in the common hepatic artery and imaged again after each infusion. We acquired a 34-second breath-held 3D multi-echo UTE cones combined with fat suppression, as well as a free-breathing 3D multi-echo UTE with radial trajectories. Post-processing: To obtain the R2* maps, we performed a mono-exponential fit of the magnitude images, then took the inverse pixel-wise. Δχ was calculated by processing the UTE magnitude and phase images through the QSM pipeline. Manual ROIs were drawn on a single slice for each dataset. For the in vivo measurements, a two-sided Wilcoxon signed-rank test was performed.
Results
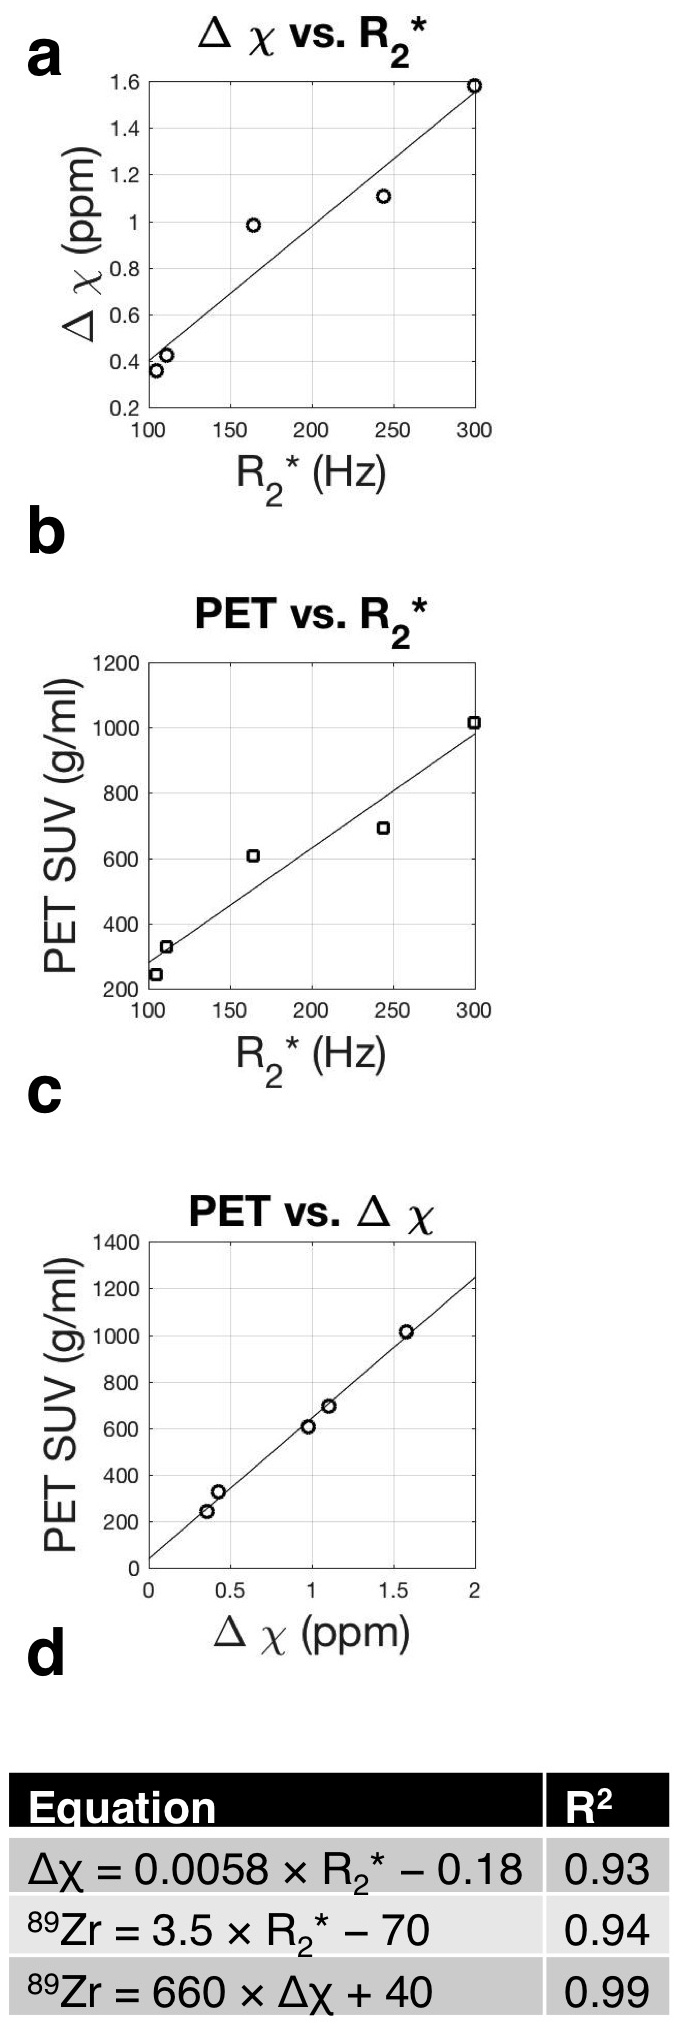
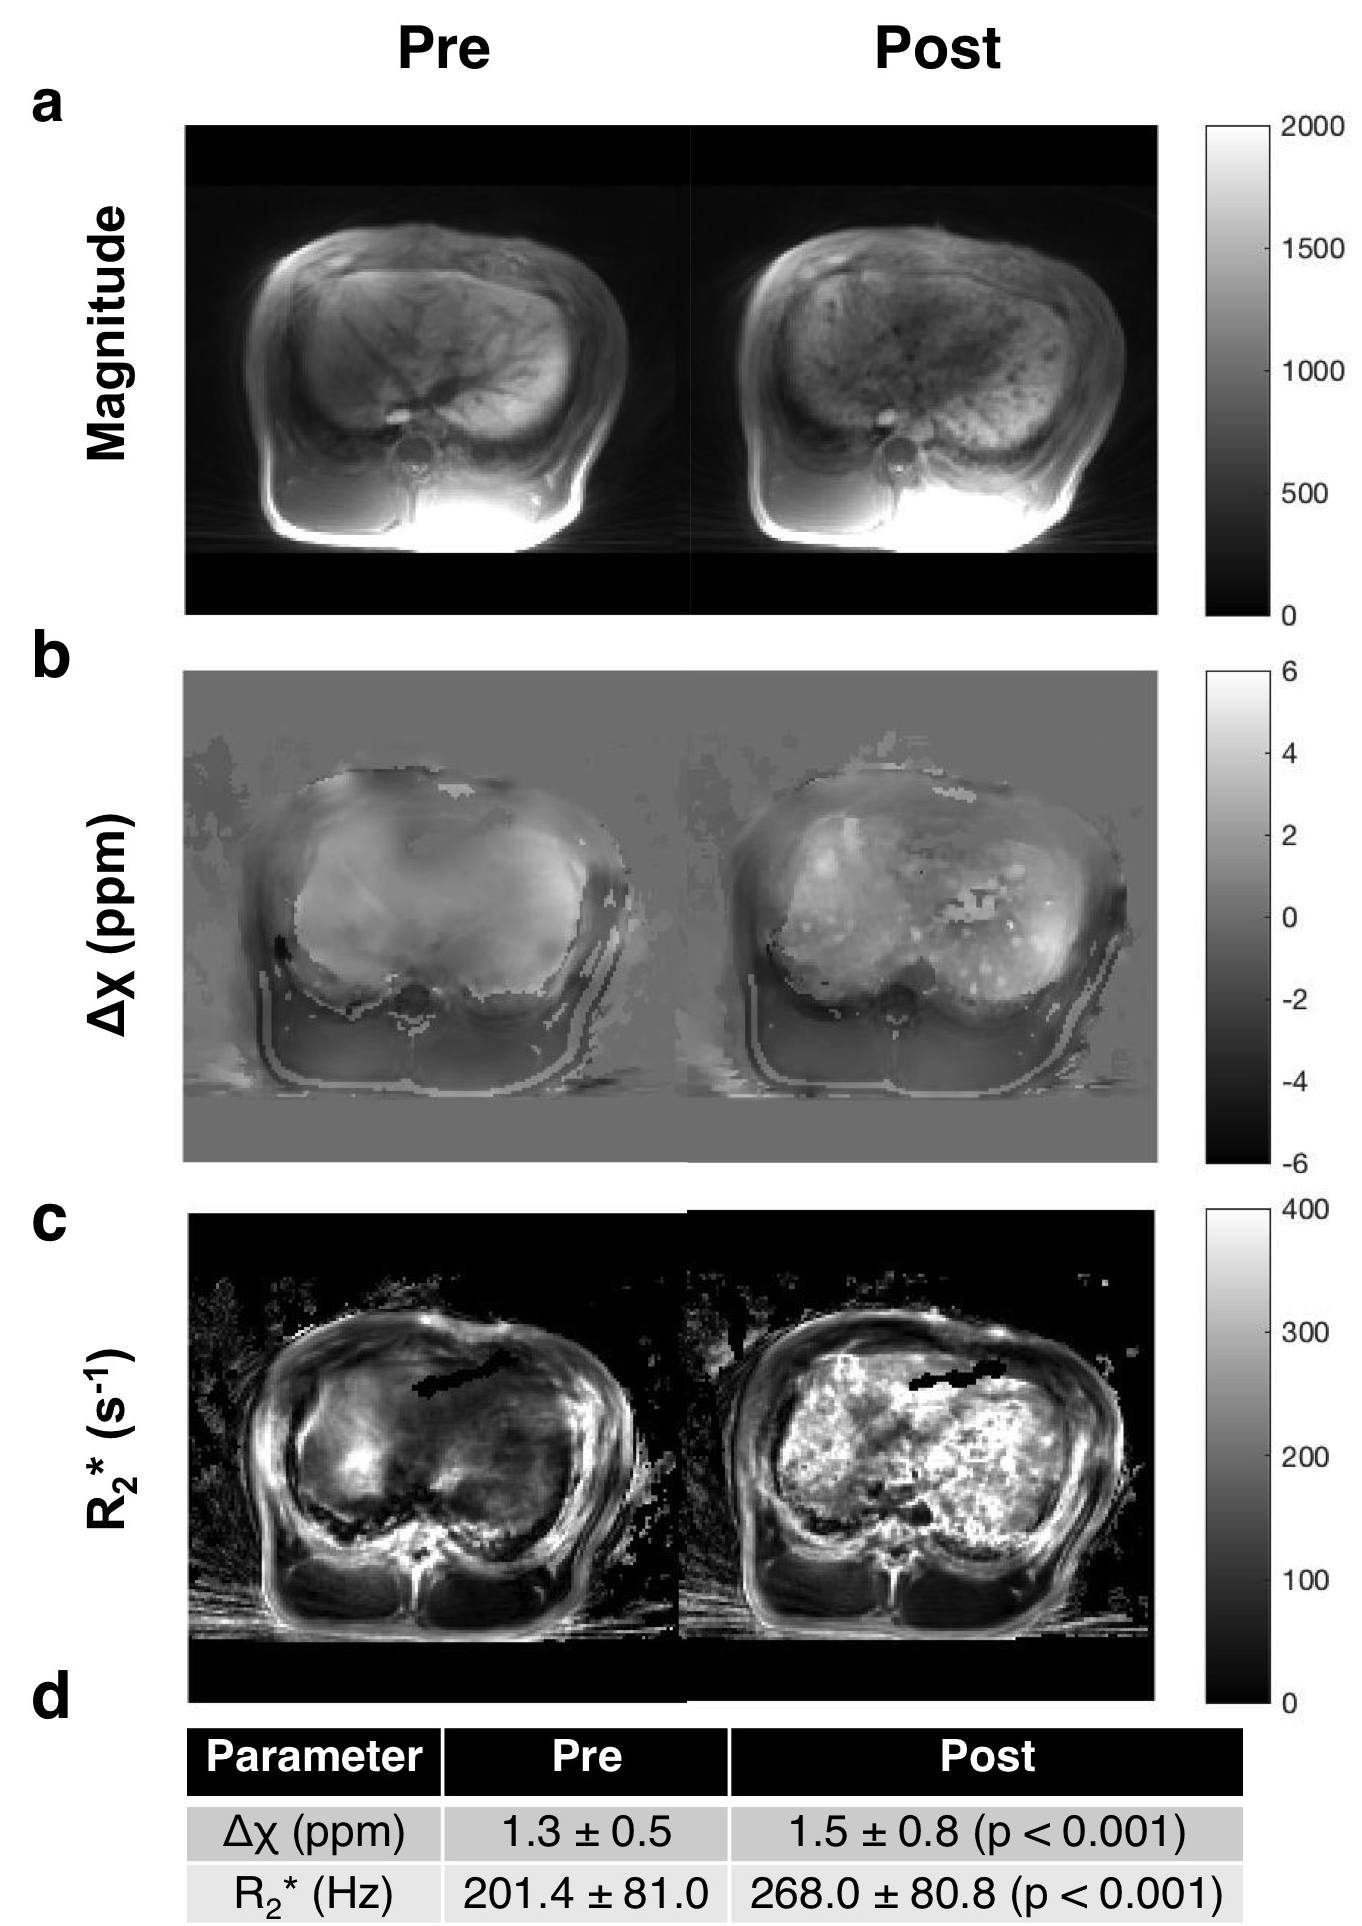
The numerical phantom demonstrated good reconstruction, with a root mean square error of 0.12 ppm between the entire initial and reconstructed susceptibility maps (Fig. 1). In the experimental phantom, each parameter had a linear relationship with radiolabeled IONP concentration, which were well described by the least-squares fit line (Fig. 2). Each parameter Δχ, R2*, and 89Zr-IONP uptake in SUV, had a linear relationship with each other, which were also well explained by the least-squares fit line (Fig. 3). Intra-arterial hepatic infusion of the 89Zr-IONP resulted in substantial changes in ROIs of R2* and Δχ after the final intra-hepatic infusion, shown in the analysis with the cones (Fig. 4) and radial trajectories (Fig. 5).Discussion
These multiparametric techniques, Δχ, R2*, and 89Zr-IONP uptake had a good linear relationship with the iron oxide concentration in phantoms and with each other, which were well explained by the equations. Intra-hepatic infusion demonstrated significant changes after infusion in vivo. This preliminary in vivo study demonstrated initial feasibility for assessing magnetic nanoparticle tracking for intra-arterial chemotherapy procedures.Acknowledgements
The authors gratefully acknowledge Vahid Ravanfar for PET-MR scanning, Emma Bahroos for PET-MR expertise, Dr. Michael Carl for assistance with the UTE sequence, and Dr. Pauline W. Worters, Dr. Mohammad Khalighi, and Patrick Koon for assistance with GE pulse sequences. Funding support included grants R01 CA194533, R01 EB012031, and TL1 TR001871.References
1. Mabray, M. C. et al. J. Vasc. Interv. Radiol. 27, 426–432.e1 (2016). 2. Kondapavulur, S. et al. Biomed. Microdevices 18, 109 (2016). 3. Zhang, Y., Hong, H. & Cai, W. Curr. Radiopharm. 4, 131–139 (2011). 4. Liu, J. et al. Neuroimage 59, 2560–2568 (2012). 5. Gurney, P. T. et al. Magn. Reson. Med. 55, 575–582 (2006).
Figures