0604
Real-time MR Brain Infusion Monitoring Enables Accurate Prediction of End Drug Distribution1Therataxis, LLC, Baltimore, MD, United States, 2TherVoyant, Madison, WI, United States, 3Medical Physics, Madison, Madison, WI, United States, 4Medical Physics, University of Wisconsin - Madison, Madison, WI, United States, 5Psychiatry, University of Wisconsin - Madison, Madison, WI, United States, 6Biomedical Engineering, University of Wisconsin - Madison, Madison, WI, United States, 7Radiology, University of Wisconsin- Madison, Madison, WI, United States
Synopsis
The hetergeneity of the brain makes designing a desired end drug distribution through pressurized catheters difficult. We present a method to utilize real-time MR monitoring of a co-infused Gd tracer during initial stages of the infusion to derive a real-time 3D estimate of the velocity front. We demonstrate considerable improvement in predicting the actual drug distribution using the MR real-time data in four cases using a large animal surgical model.
Introduction
As brain cancer and rare genetic brain diseases require treatments capable of bypassing the blood-brain barrier over wide regions, a procedure known as convection-enhanced delivery (CED) uses catheters inserted into brain tissue to infuse new therapeutics. CED is being used in multiple clinical trials, often treating an entire hemisphere over 2-3 days. However, the brain presents a very complex as well as dynamic topography for fluid flow [1] so that it is impossible for a surgeon to form a mental map for the likely final distribution of the drug based only on pre-surgical clinical imaging. In fact, the interpretation of past failed trials has often been clouded by questions on where the therapeutic was actually delivered[2].
Building upon a retrospective trial[3], we demonstrate the value of real-time MRI to (i) capture the relatively slow fluid expansion during the first 20-40 minutes of the infusion; (ii) calculate a velocity front at each point along a 3D surface on the advancing infusion, and (iii) utilize the velocity front in a brain drug predictive algorithms to predict the final spatial distribution. We present prospective predictions in four image-guided swine surgeries, compare them to the actual end distribution, and compare them with our best prediction based upon pre-surgical planning alone.
Methods
Real-time MR qualitative infusion monitoring has previously recognized issues such as backflow [4]. However, the real-time data is not leveraged to predict the actual final distribution and thus detecting and controlling errant distributions is difficult.
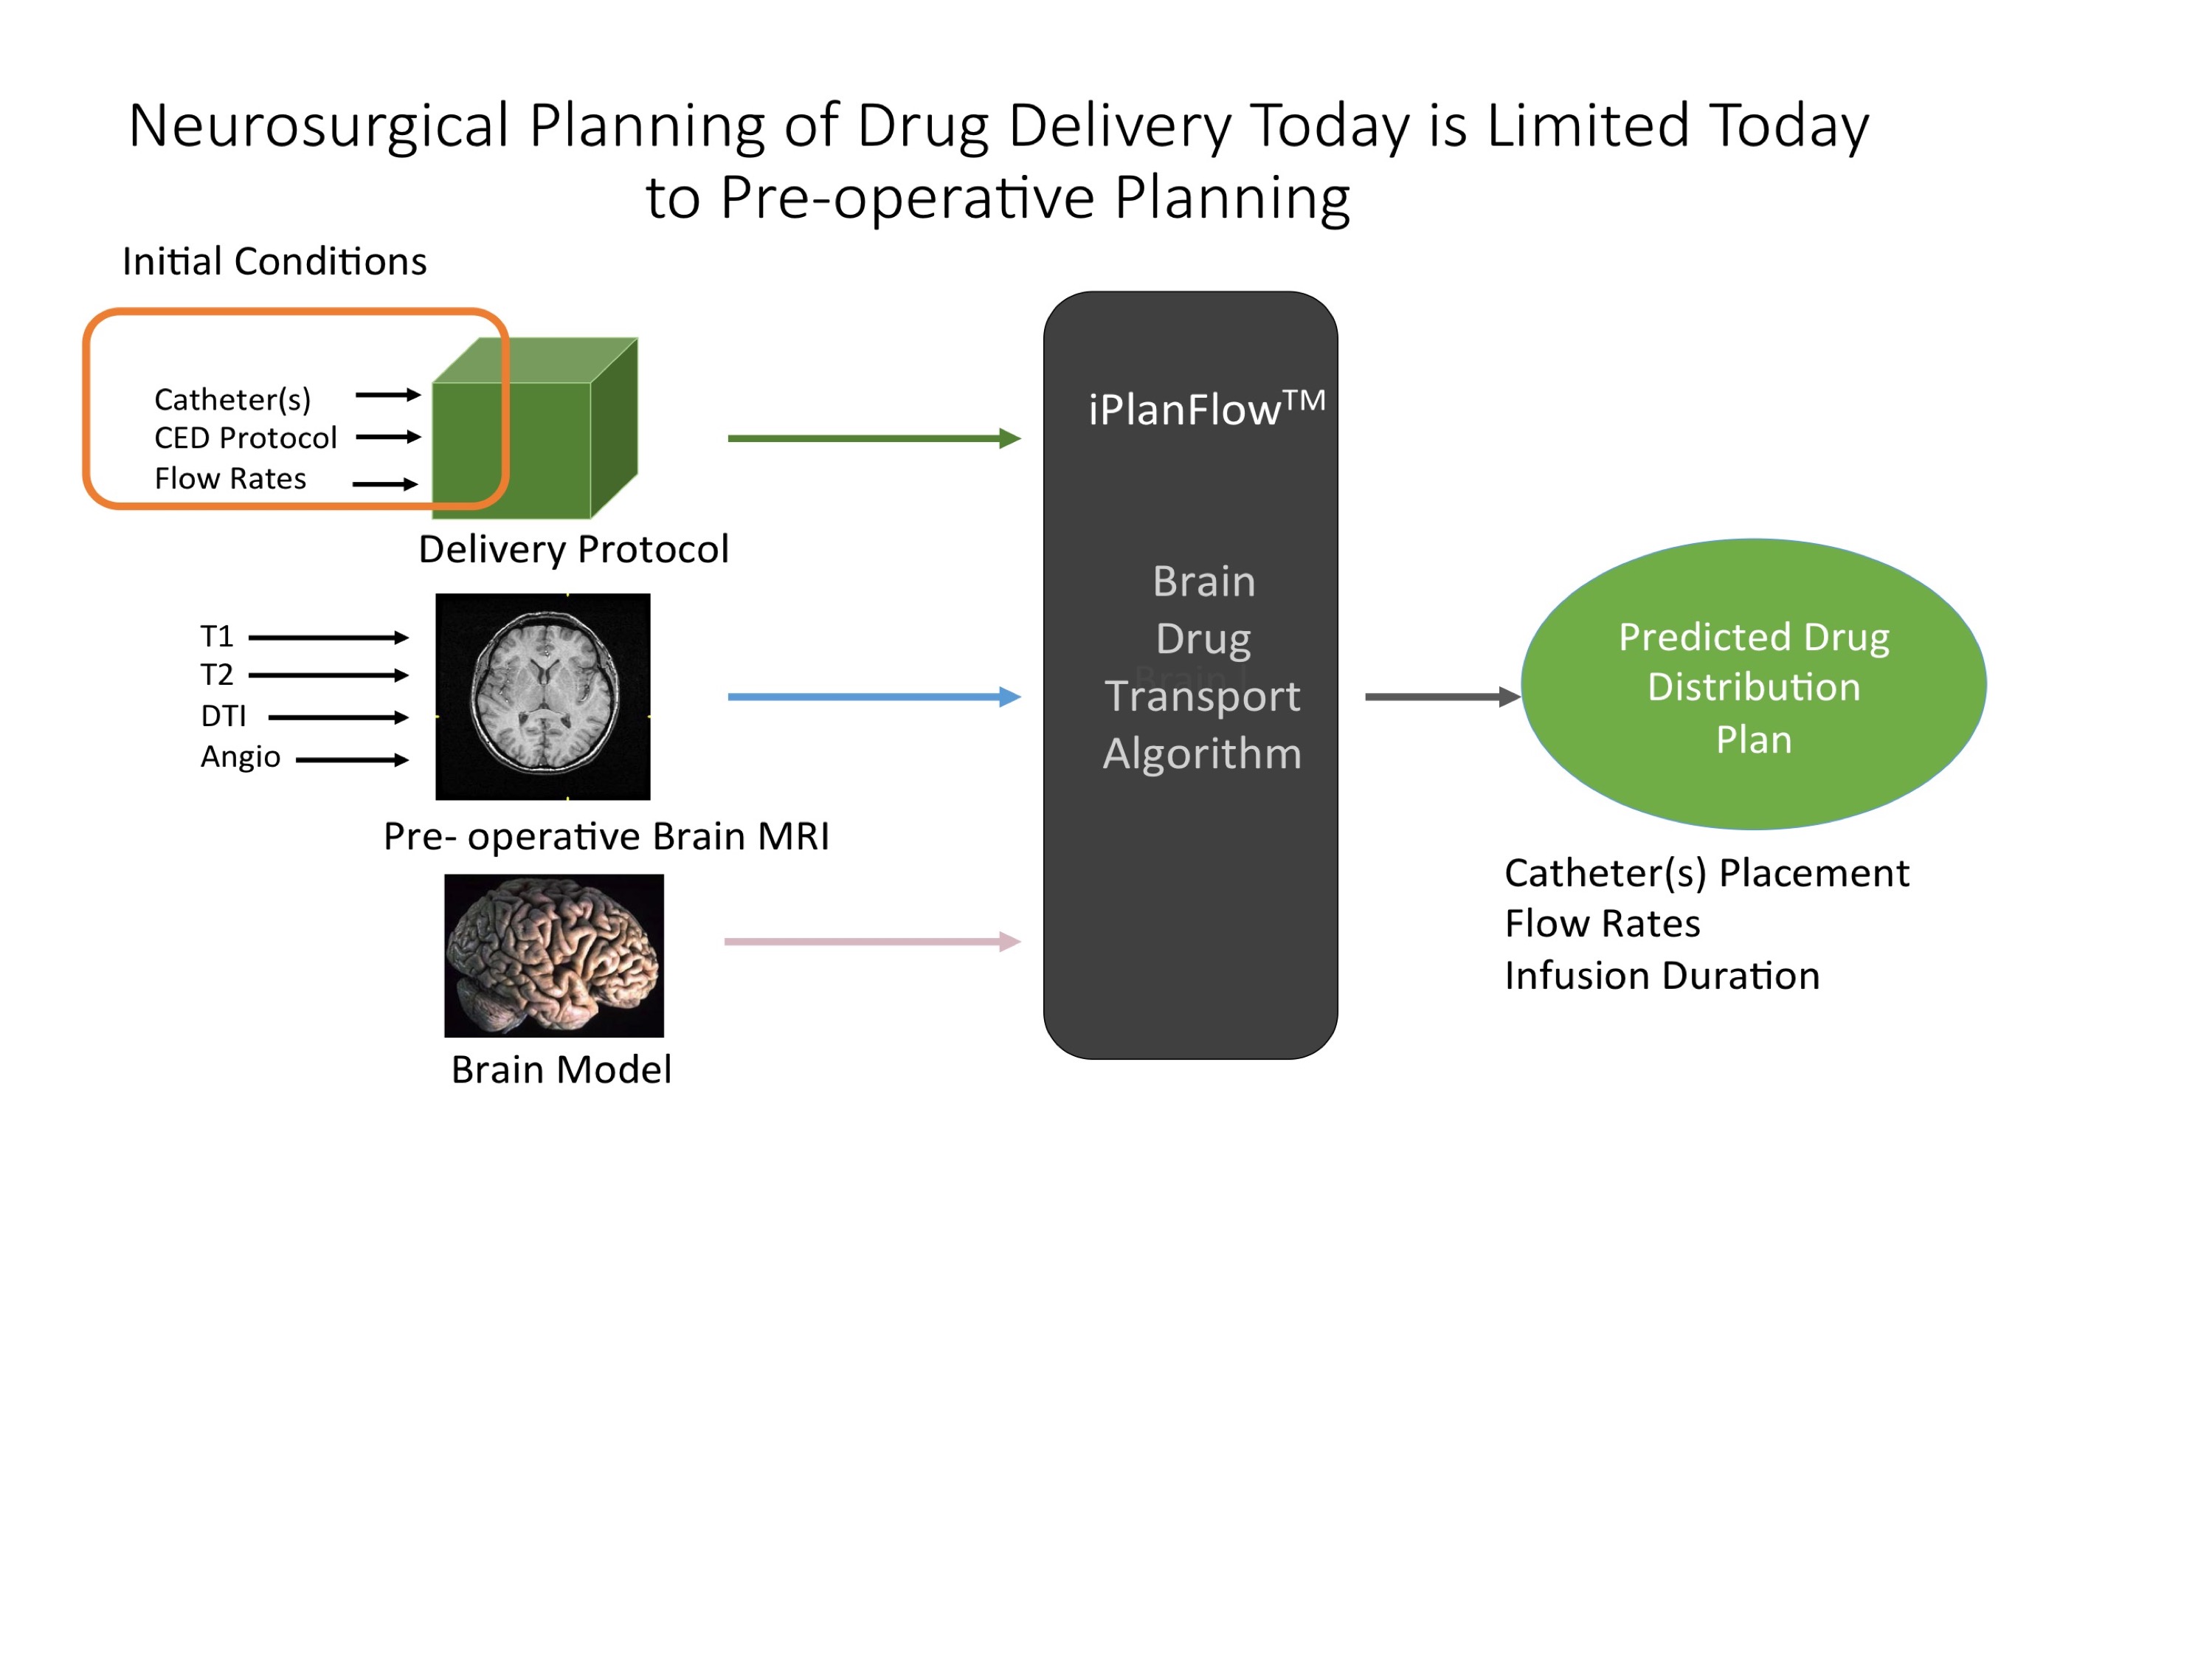
As MRI can segment parenchymal components and map the geometry of fluid pathways, it is promising for planning, predicting, and monitoring CED infusions. Our prediction estimation model, illustrated in Figure 1, computes changes in drug concentration as the sum of a diffusion term, bulk flow due to CED, and losses due to movement out of the parenchyma[5].
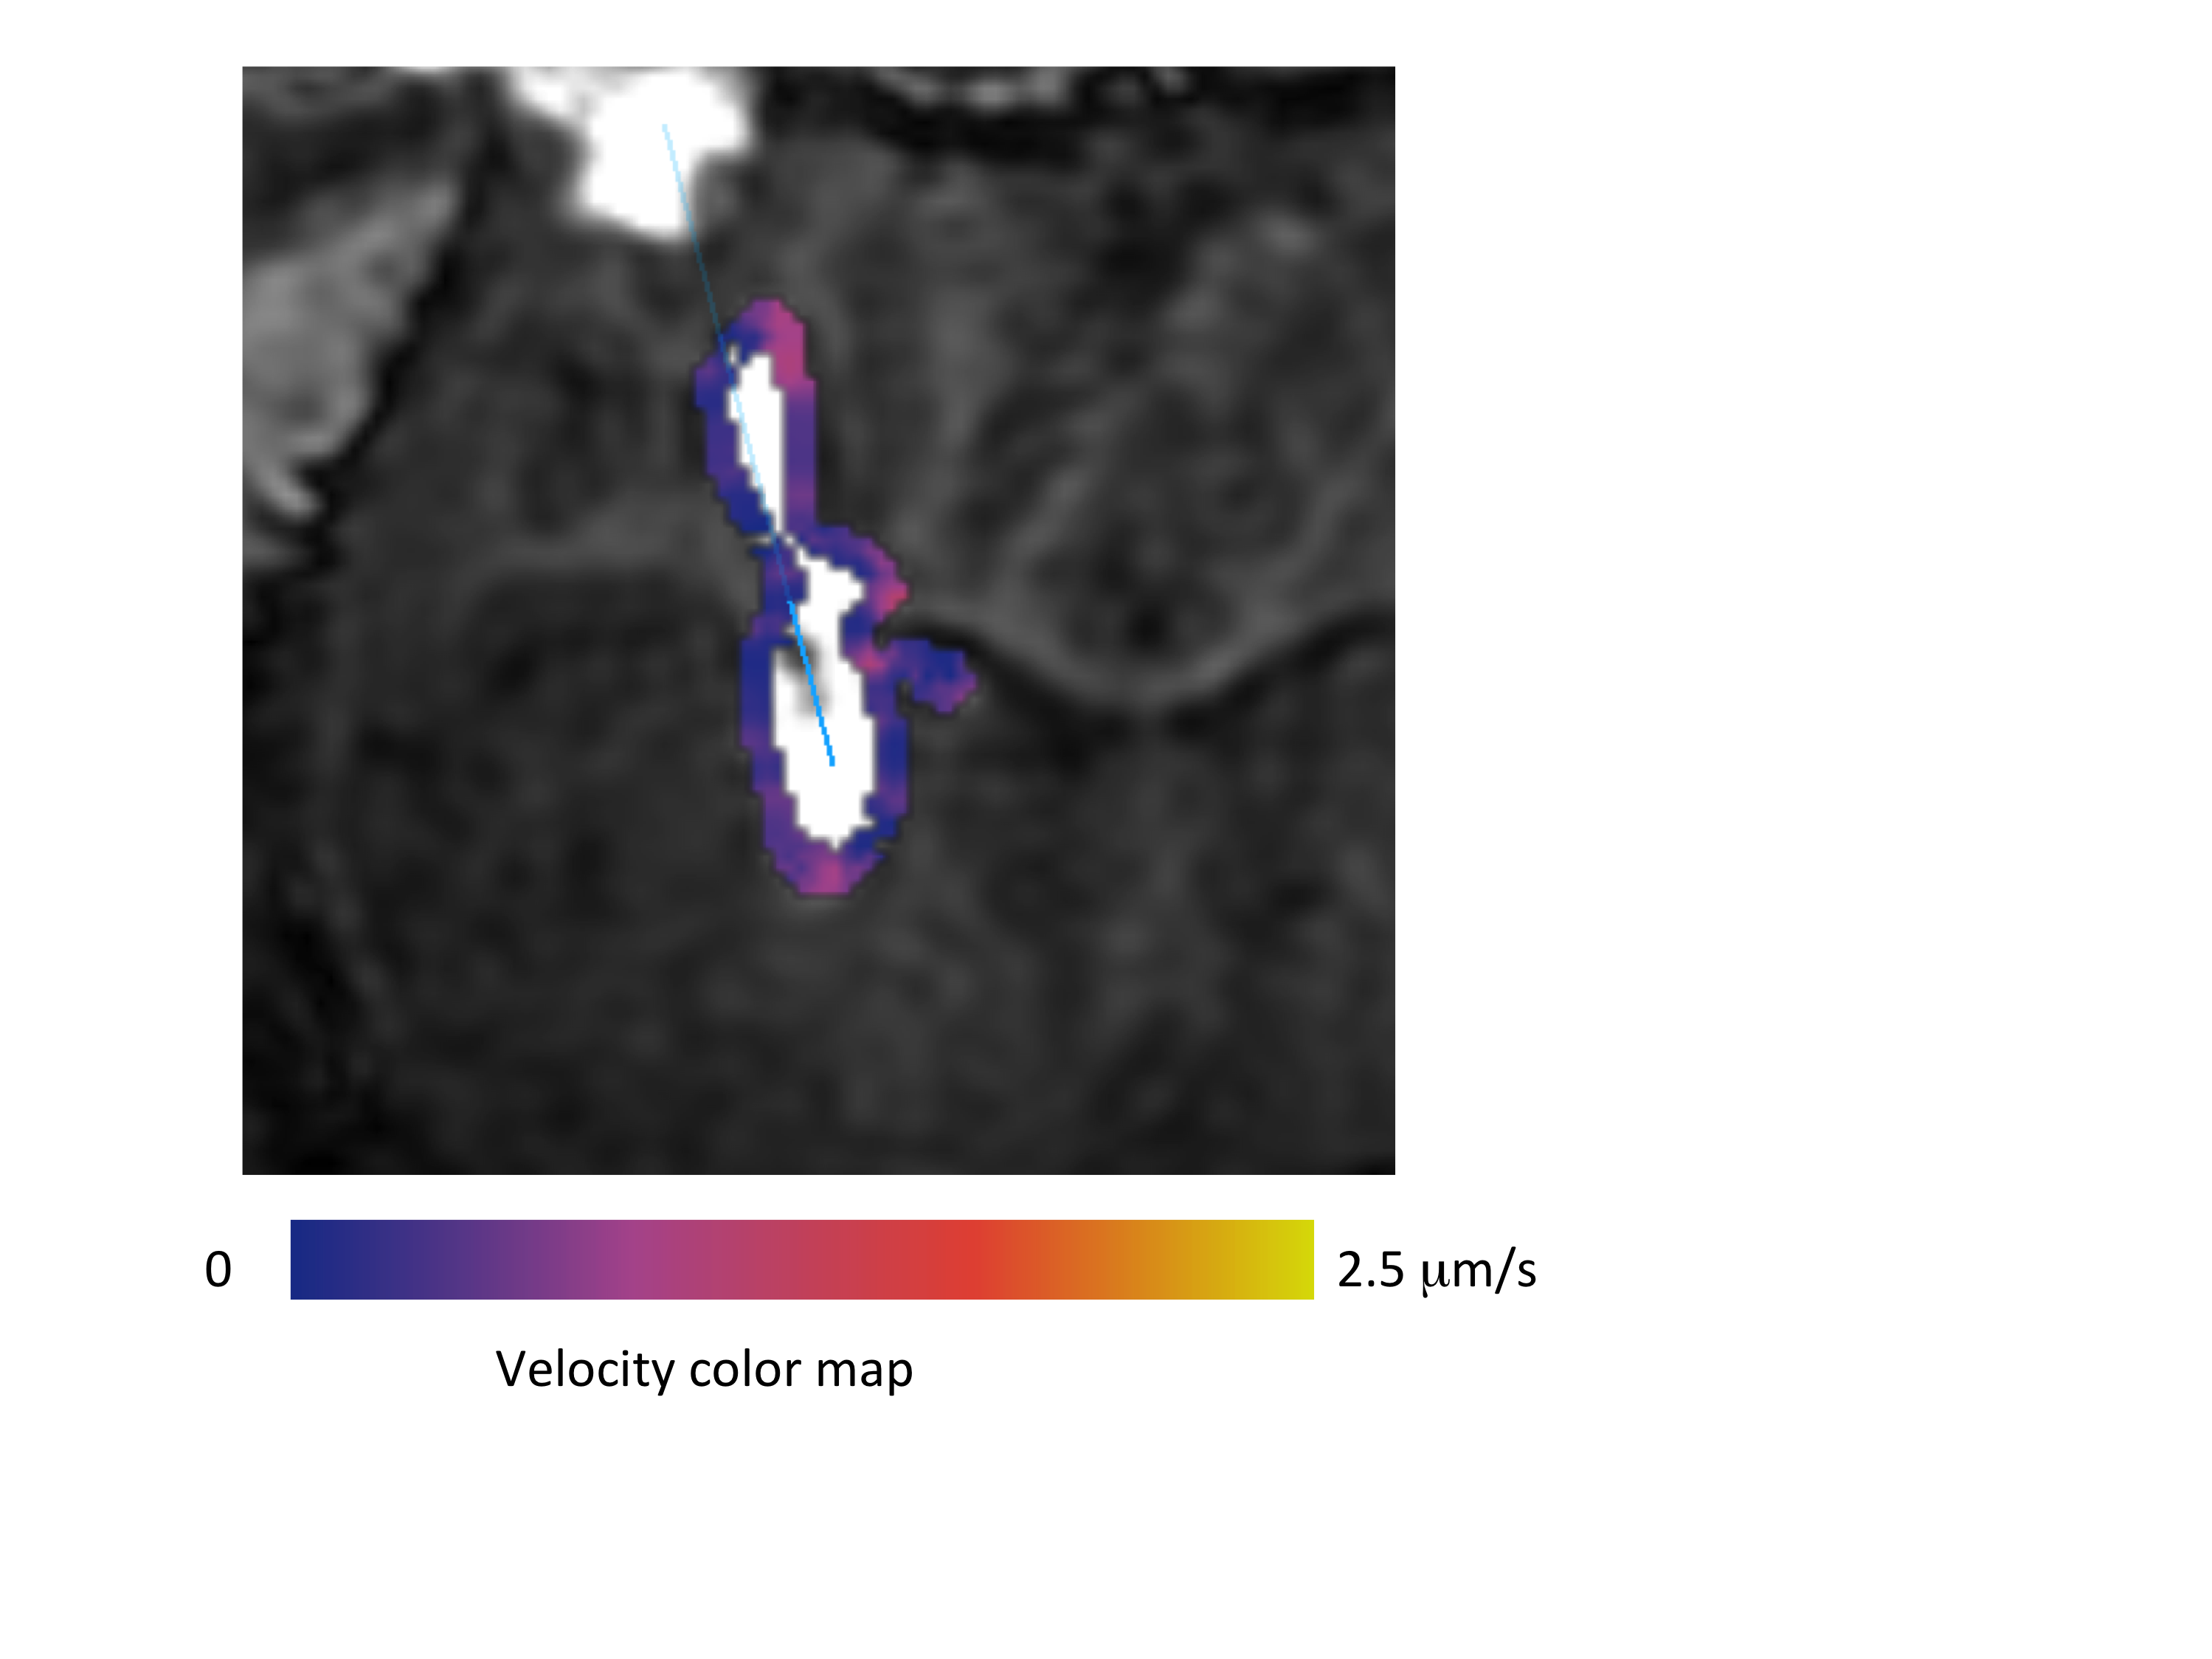
Initializing the algorithm, however, requires assumptions on flow mechanics at the catheter tip. We replace these assumptions by generating a 3D velocity front along the expanding infusion surface, co-infused with a Gd tracer. By waiting a moderate duration after infusion initiation (tens of minutes), the infusion front travels a moderate distance from the catheter tip, as shown in Figure 2. A 3D velocity boundary vector at the infusion front is derived from a difference image between sequential volumetric images.
We guided 0.7 mm diameter CED catheters bilaterally into four swine models using a customized guidance platform[6] on a GE PET/MR scanner. Infusions of 5 mL/min extended for 140 minutes, resulting in a total infused volume of 700 mL. IR-prepped 3D GRE scans monitored the infusion.
Results
High resolution is needed to measure the slow moving velocity front. We initially used 3D GRE dual flip angles scans (6 and 34 degrees) to measure the velocity front[3]. Though this approach could quantify the spatial tracer concentration, we have transitioned to simply thresholding an inversion-recovery prepped 3D GRE sequences (BRAVO, MP-RAGE to increase resolution. Typical parameters include a 512 x 512 x 80 image matrix at 0.35 x 0.35 x 0.8 mm resolution acquired over 4 minutes. A typical velocity front estimation is shown in Figure 2.
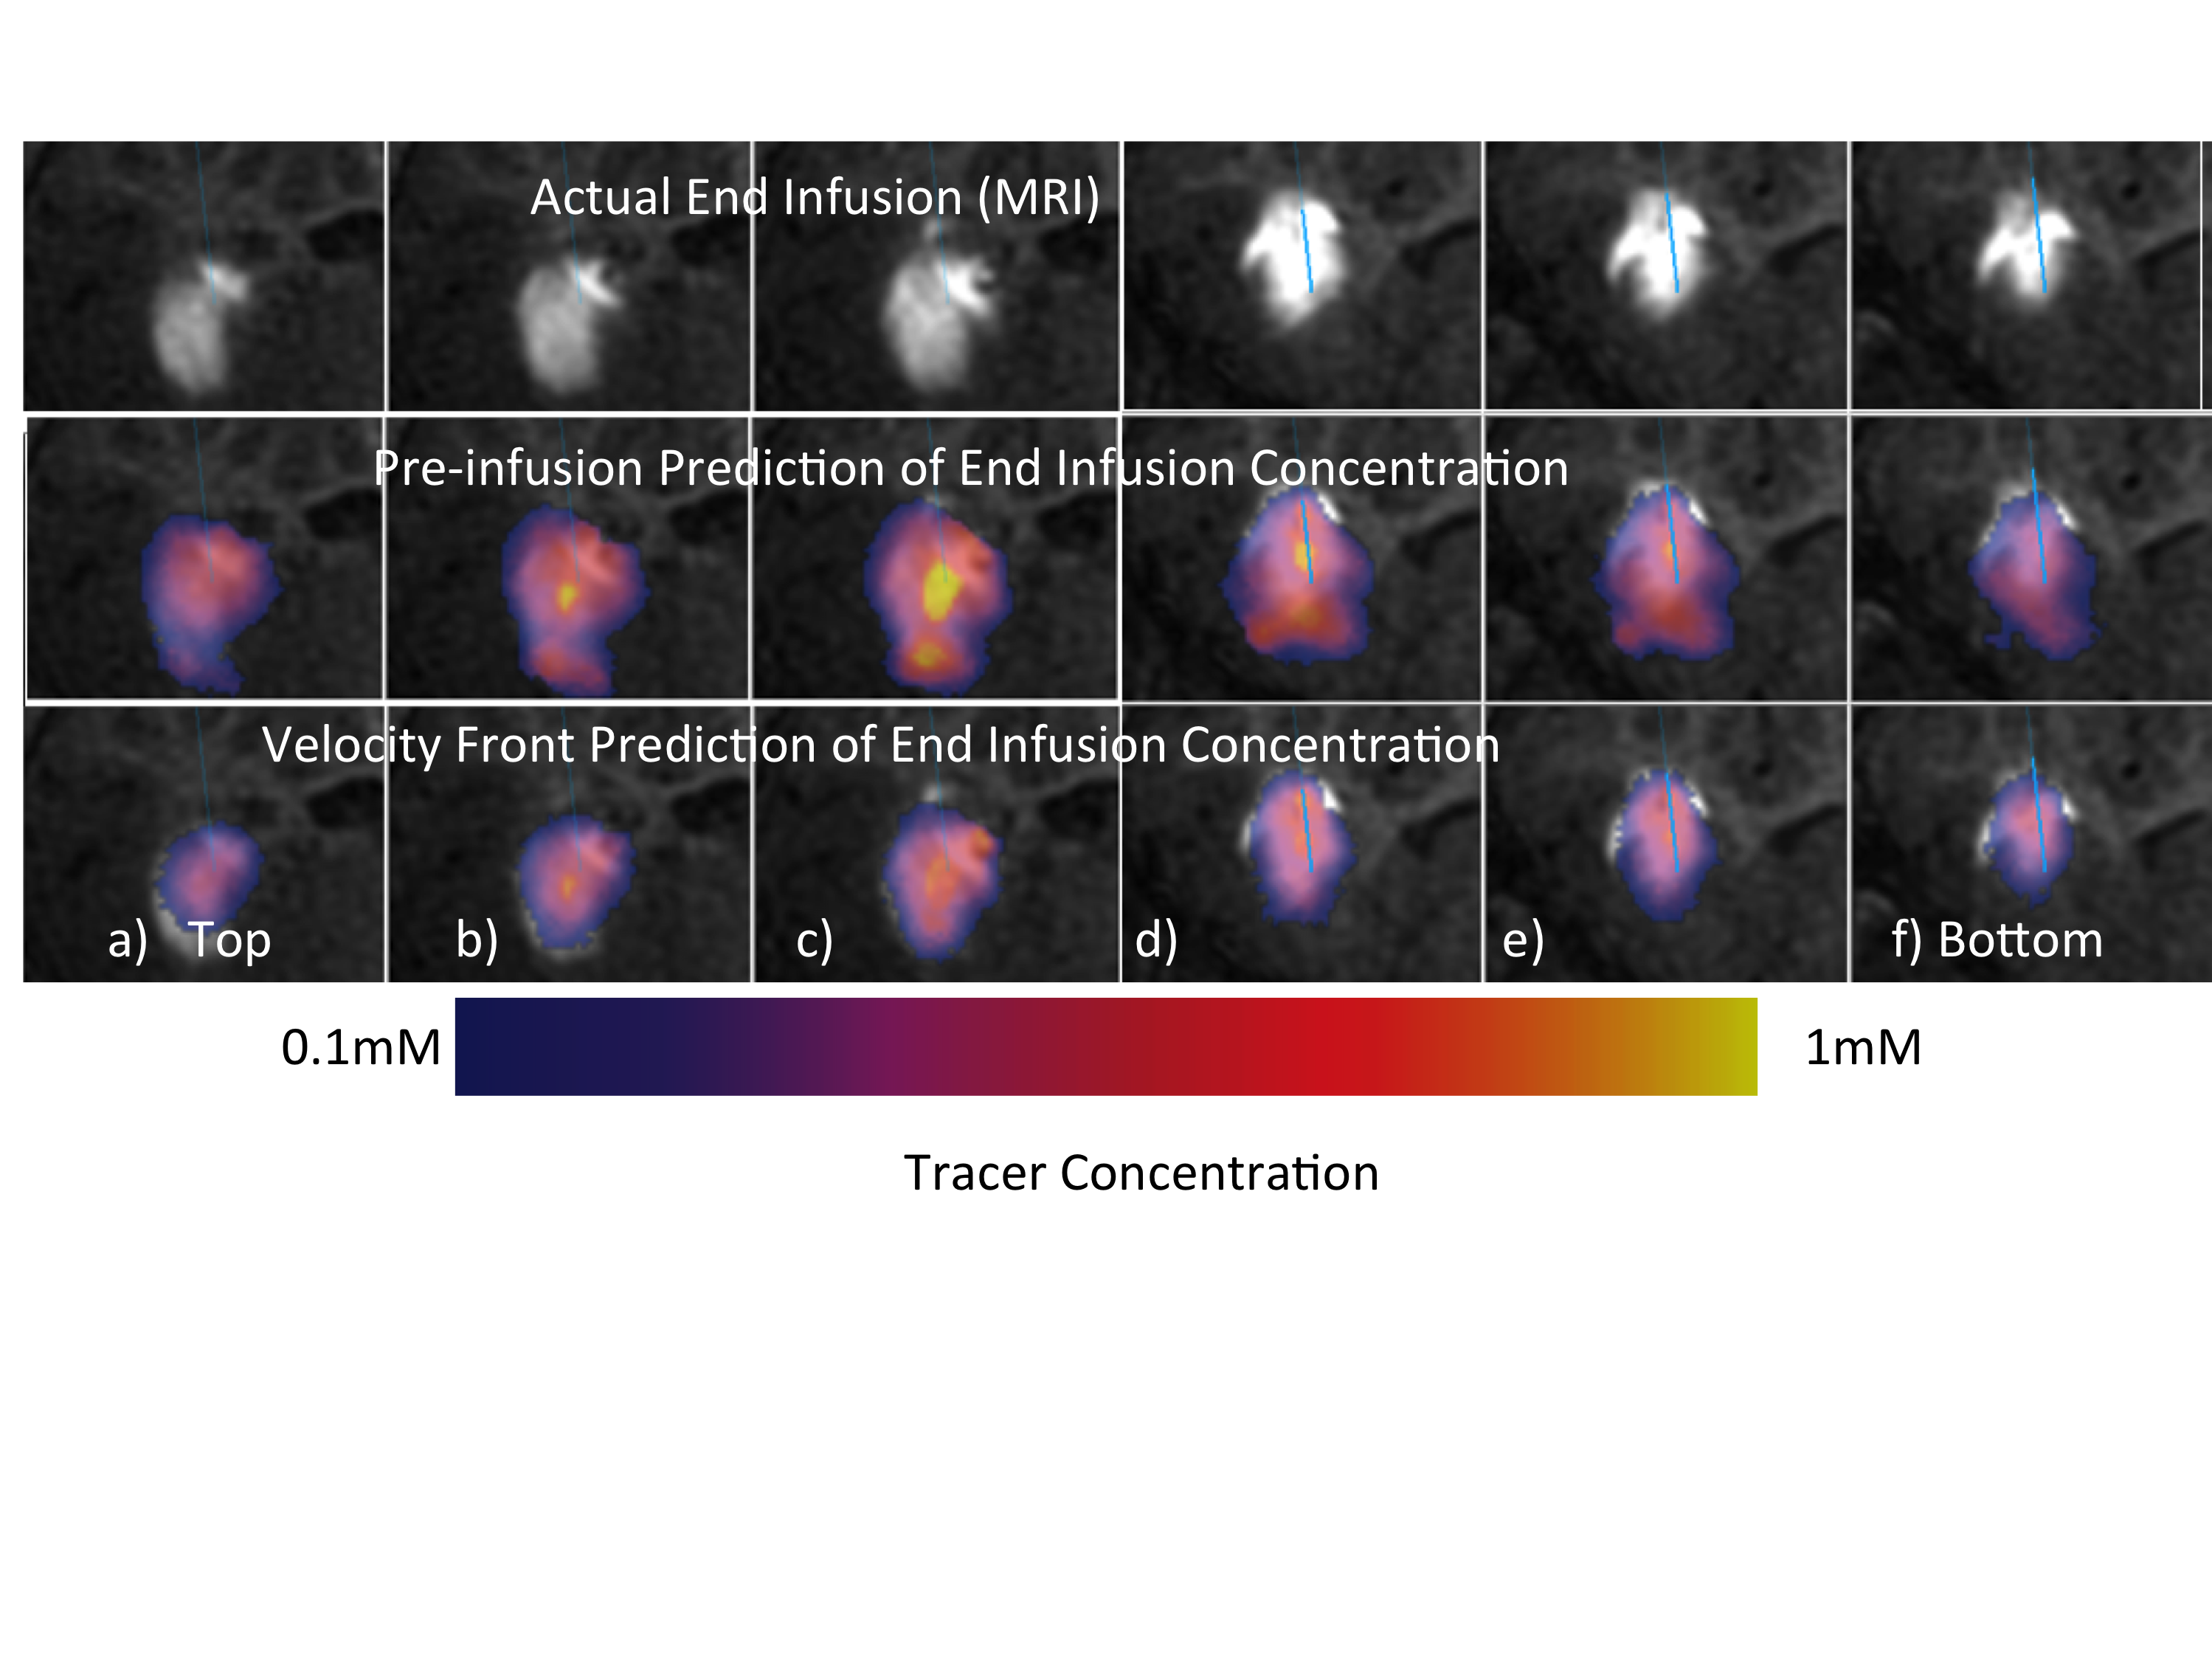
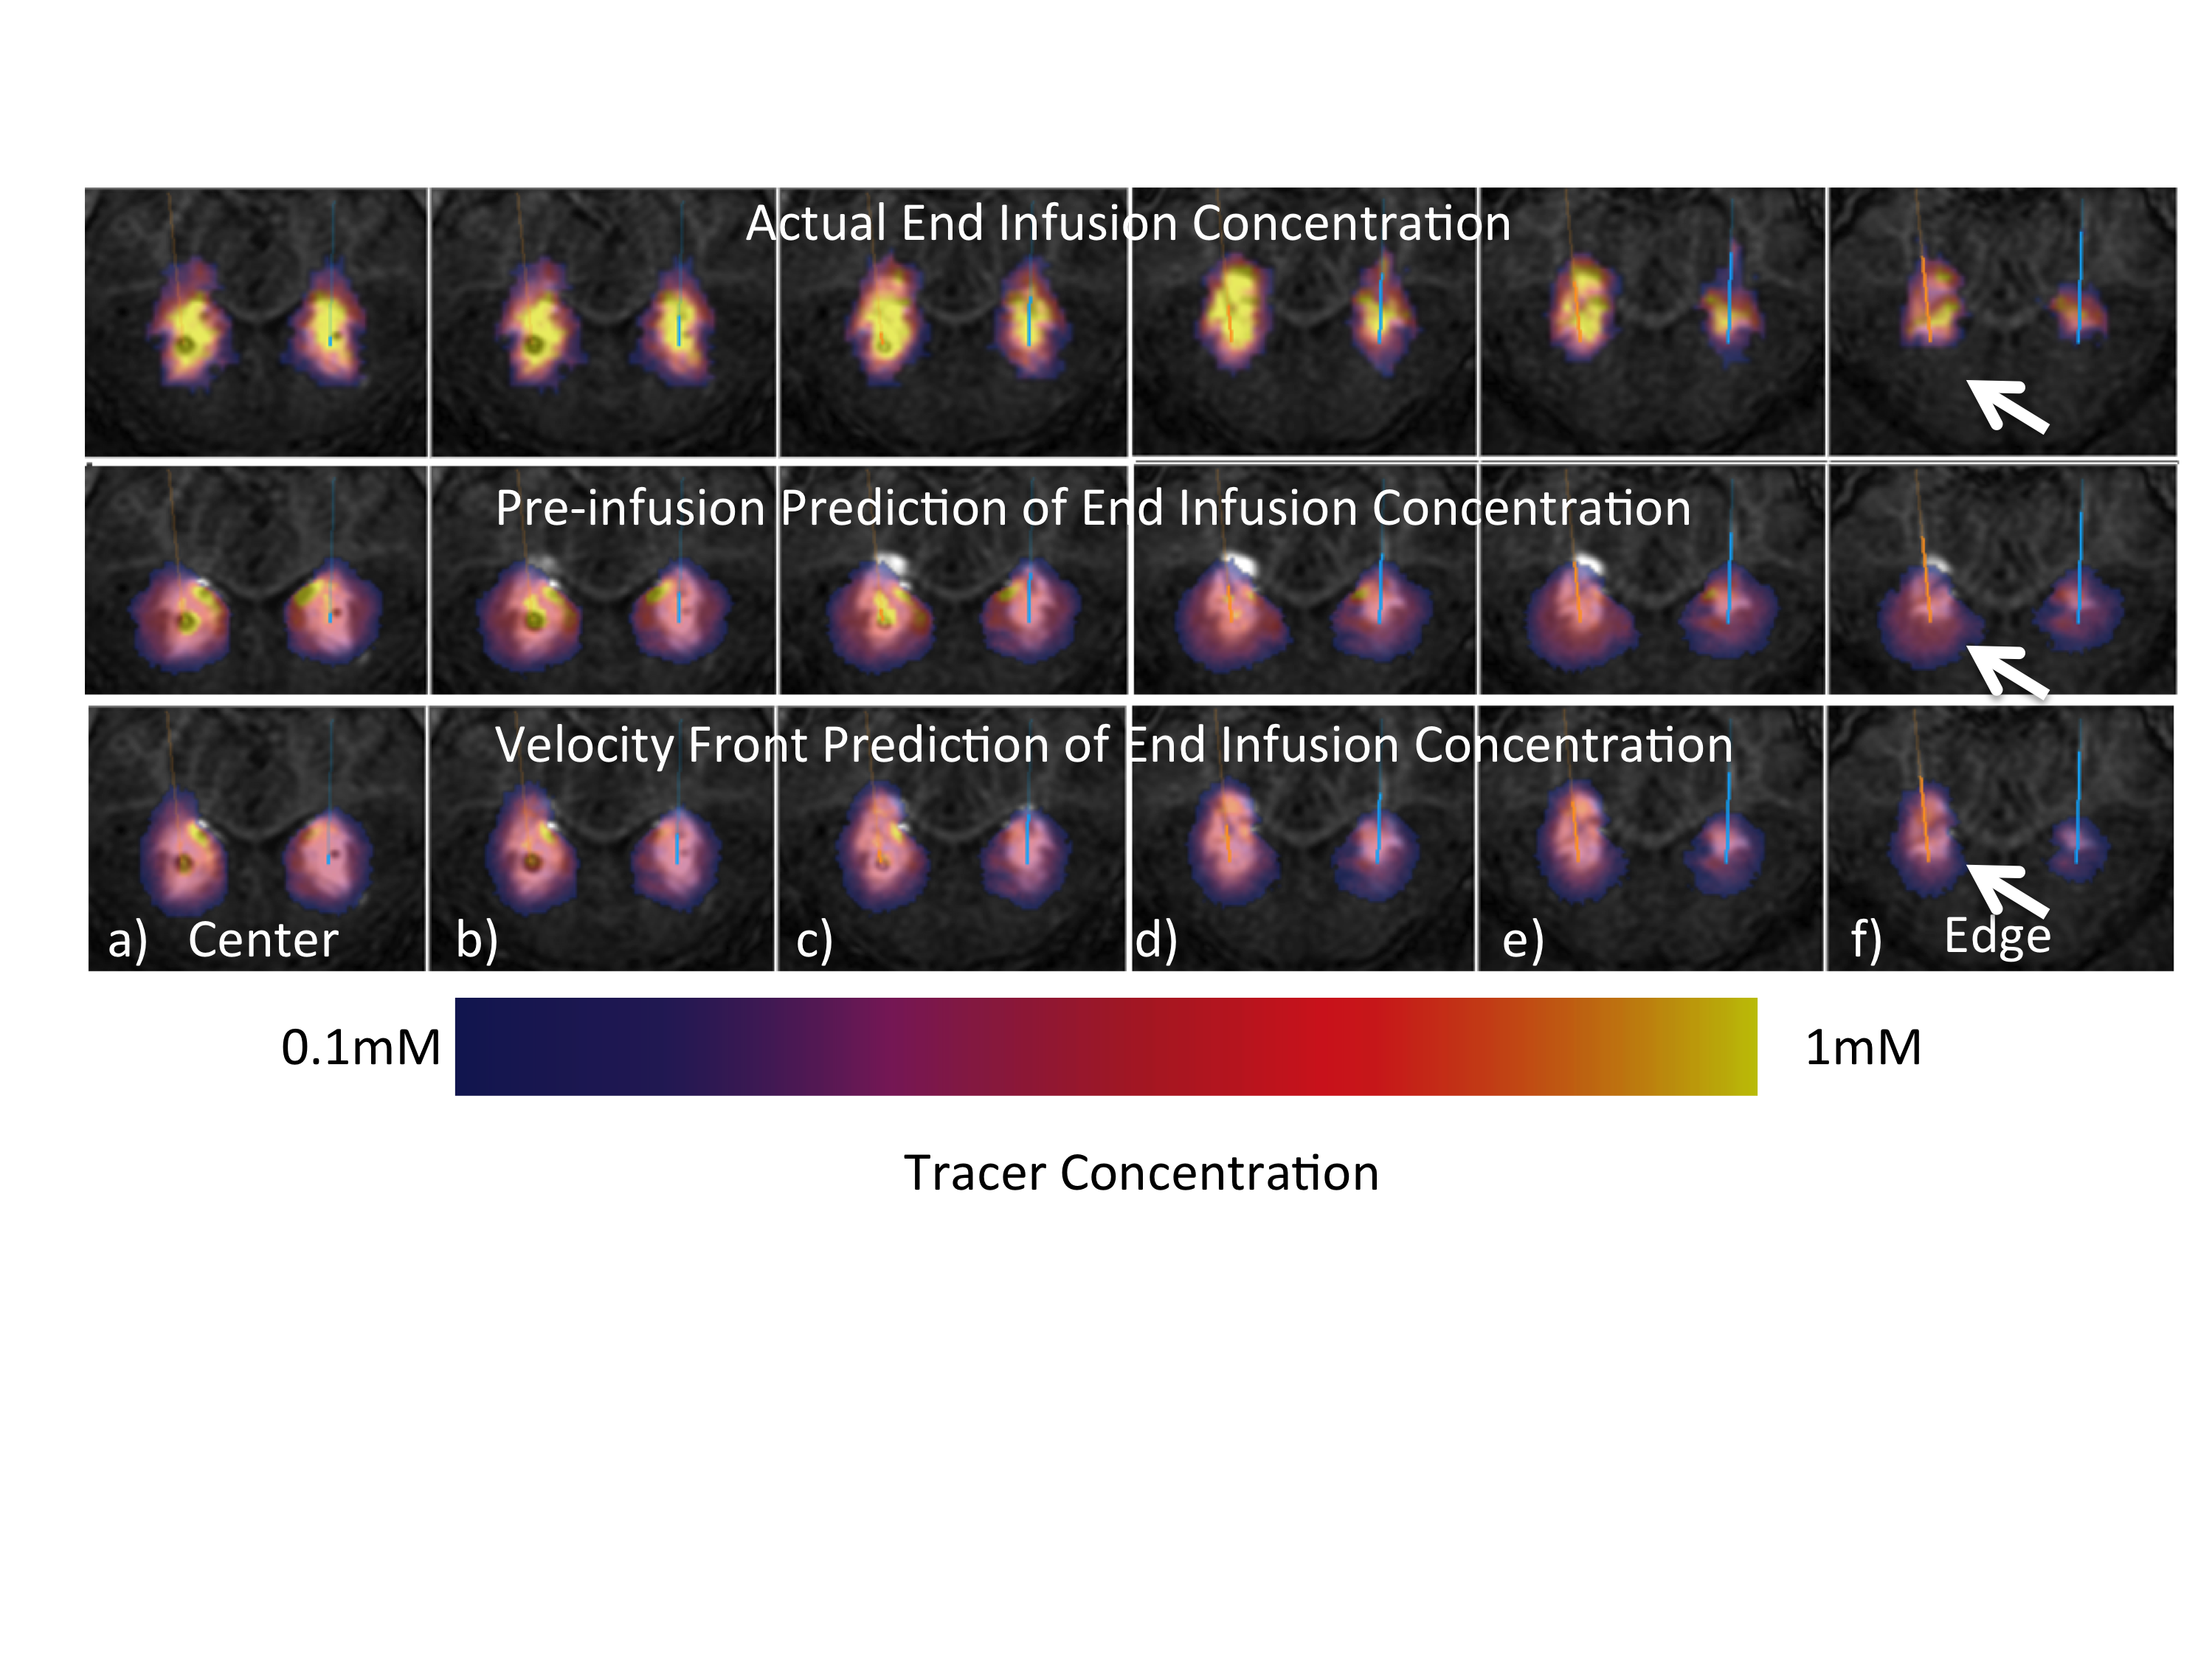
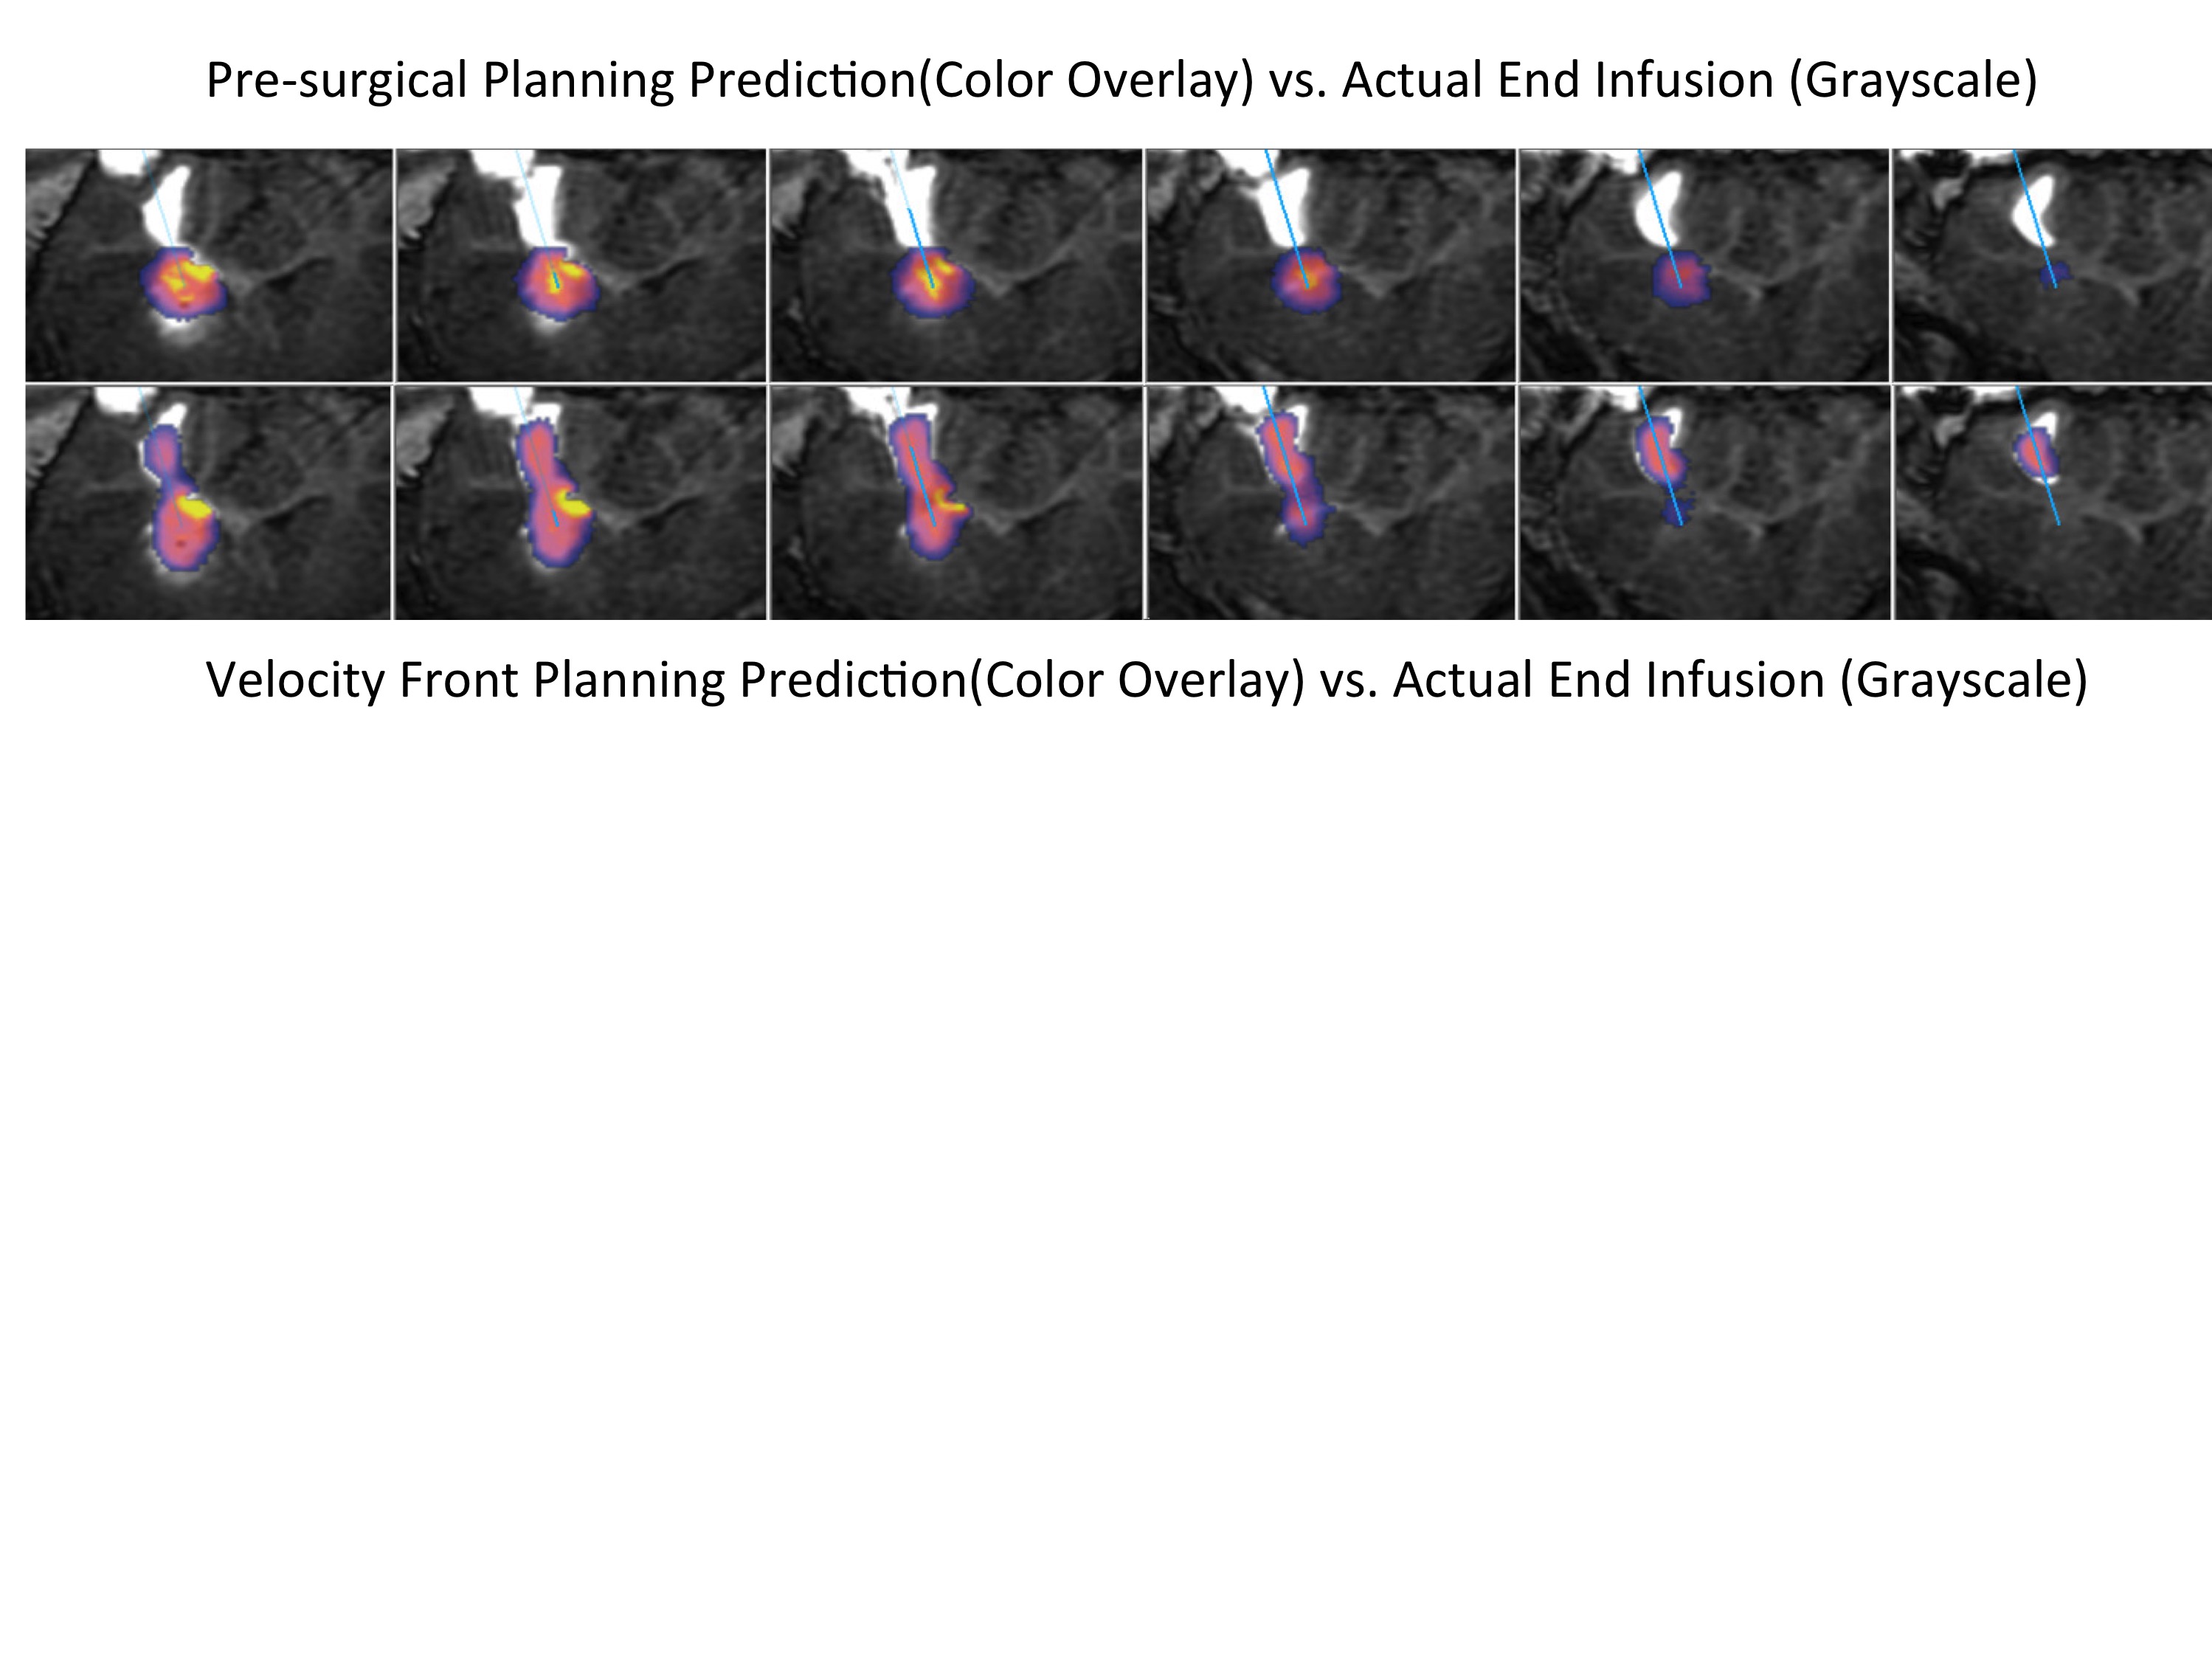
In general, the value of real-time MRI to enhance final drug distribution prediction is greater on edges of the infusion than in the center. In the case in Figure 3, the color overlay of the pre-surgical prediction (middle row) significantly extends beyond the grayscale enhancement that indicates the final distribution, particularly lower in the images. The infusion shape predicted from the proposed method (bottom row) matches much more closely with the actual infusion. In the surgical case in Figure 4, there is higher concordance between both predictions and the actual infusion, though the value of the proposed method is evident on the edge of the infusion (row f). The value of real-time monitoring is quite clear in the case of Figure 5, where unexpected backflow is captured by the proposed method and correctly estimates the infusion distribution (bottom row).
Discussion
Every catheter design offers different backflow characteristics [4, 7, 8]. While the commercial pre-operative planning system available today (Figure 1) accommodates only one catheter design [9], trials have been supplanted with more advanced designs [7, 10-12]. Our approach liberates the predictive algorithm from detailed accounting of the backflow characteristics and thus offers significantly greater utility.Conclusion
We have presented an advance in guided intraparenchymal drug delivery using real-time MRI monitoring to more accurately predict final drug distribution. Given the difficulty and variability of intraparenchymal drug distributions, MRI provides high added value to assist neurosurgeons in delivering the intended treatment.Acknowledgements
We gratefully acknowledge NIH funding 5R44CA177205-03. We also acknowledge Dan Consigny for his assistance in designing and executing the pre-clinical experiment.References
[1] R. Raghavan, Brady, Martin L., and Sampson, John H. , "Delivering therapy to target: improving the odds for successful drug development," Therapy Delivery, vol. 7, pp. 457 - 481, 2016.
[2] J. H. Sampson, G. Archer, C. Pedain, E. Wembacher-Schroder, M. Westphal, S. Kunwar, et al., "Poor drug distribution as a possible explanation for the results of the PRECISE trial," J Neurosurg, vol. 113, pp. 301-9, Aug 2010.
[3] M. Brady, R. Raghavan, A. L. Alexander, and W. F. Block, "Controlling Brain Infusion Distributions: Moving from Surgical Planning to Real-Time MR Guidance,," in International Society of Magnetic Resoance in Medicine, Honolulu, Hawaii, 2017, p. 5419.
[4] M. Brady, Raghavan, R, Alexander, A, Kubota, K, Sillay, K and Emborg, ME, "Pathways of infusate loss during convection-enhanced delivery into the putamen nucleus," Stereotact Funct Neurosurg, vol. 91, pp. 69-78, 2013.
[5] R. Raghavan and M. Brady, "Predictive models for pressure-driven fluid infusions into brain parenchyma," Phys Med Biol, vol. 56, pp. 6179-204, Oct 7 2011.
[6] N. H. Kalin, A. S. Fox, R. Kovner, M. K. Riedel, E. M. Fekete, P. H. Roseboom, et al., "Overexpressing Corticotropin-Releasing Factor in the Primate Amygdala Increases Anxious Temperament and Alters Its Neural Circuit," Biol Psychiatry, vol. 80, pp. 345-55, Sep 01 2016.
[7] M. Brady, Raghavan, R, Singh, D., Anand, PJ, Fleisher, AS, Mata, J, Broaddus, WC, and Olbricht, WL, "In vivo performance of a microfabricated catheter for intraparenchymal delivery," J Neurosci Methods, vol. 229, pp. 76-83, May 30 2014.
[8] M. L. Brady, Raghavan, R., Block, W., Grabow, B., Ross, C., Kubota, K., Alexander, A., and Emborg, M. E., "The Relation between Catheter Occlusion and Backflow during Intraparenchymal Cerebral Infusions," Stereotactic and Functional Neurosurgery, vol. 93, pp. 102 - 109, 2015.
Figures