0602
Assessing MR-guided catheter contact with the myocardium using device motion: A feasibility study1Medical Biophysics, University of Toronto, Toronto, ON, Canada, 2Sunnybrook Research Institute, Toronto, ON, Canada
Synopsis
Assessing contact of the catheter tip with the endocardial wall remains challenging during MR-guided electroanatomic voltage mapping (EAVM) of the heart. In this study we investigated whether the synchronicity of catheter motion with the beating heart can serve as an indicator of catheter-endocardium contact. The results from this study show that that synchronicity could potentially provide an indirect measure of endocardial contact and could serve a metric by which quality of EAVM data can be evaluated.
Introduction
Although radiofrequency (RF) ablation is a potentially effective curative therapy for arrhythmia in structural heart disease patients, the current success rate is low. In one cohort, 37% of acutely successful ventricular tachycardia ablation procedures resulted in recurrence during a 12±3-month follow-up1. Particularly in the absence of dedicated contact force sensing technology, a significant challenge is posed by the lack of information regarding the catheter tip interaction with the endocardium within the cardiac chamber during complex procedures requiring precise electrophysiology (EP) measurements and ablation.
Consistent contact between the catheter tip and the endocardial surface is needed for both accurate mapping of the endocardial surface and creation of deep ablation lesions. To better understand markers of catheter tip-endocardium contact, we studied catheter motion recorded during MR-guided EP studies in a pre-clinical model.
Methods
MR-guided RF ablation was performed in the left ventricles (LVs) of 5 healthy swine, which remained within the 1.5T wide-bore scanner (MR450w, GE Healthcare) throughout the experiment such that all images and catheter measurements were acquired in the scanner reference frame. Prior to catheter insertion, cine SSFP (slice thickness=6mm, TE/TR=2.0/5.8ms, FOV=260mm, matrix=192x160) images were acquired as anatomical roadmaps. A Vision-MR catheter (9F, Imricor Medical Systems) was tracked using a projection sequence2 implemented in RTHawk software (HeartVista Inc., Menlo Park, CA; FOV=60cm, resolution=1.17mm, flip angle=5°, TR=14.3ms, tracking rate=23fps) as it was navigated within the LV. The real-time catheter position was overlaid on static roadmap images in VURTIGO3 to aid catheter guidance during the experiment. RF ablation was delivered in the LV (30-35W for 90-120s).
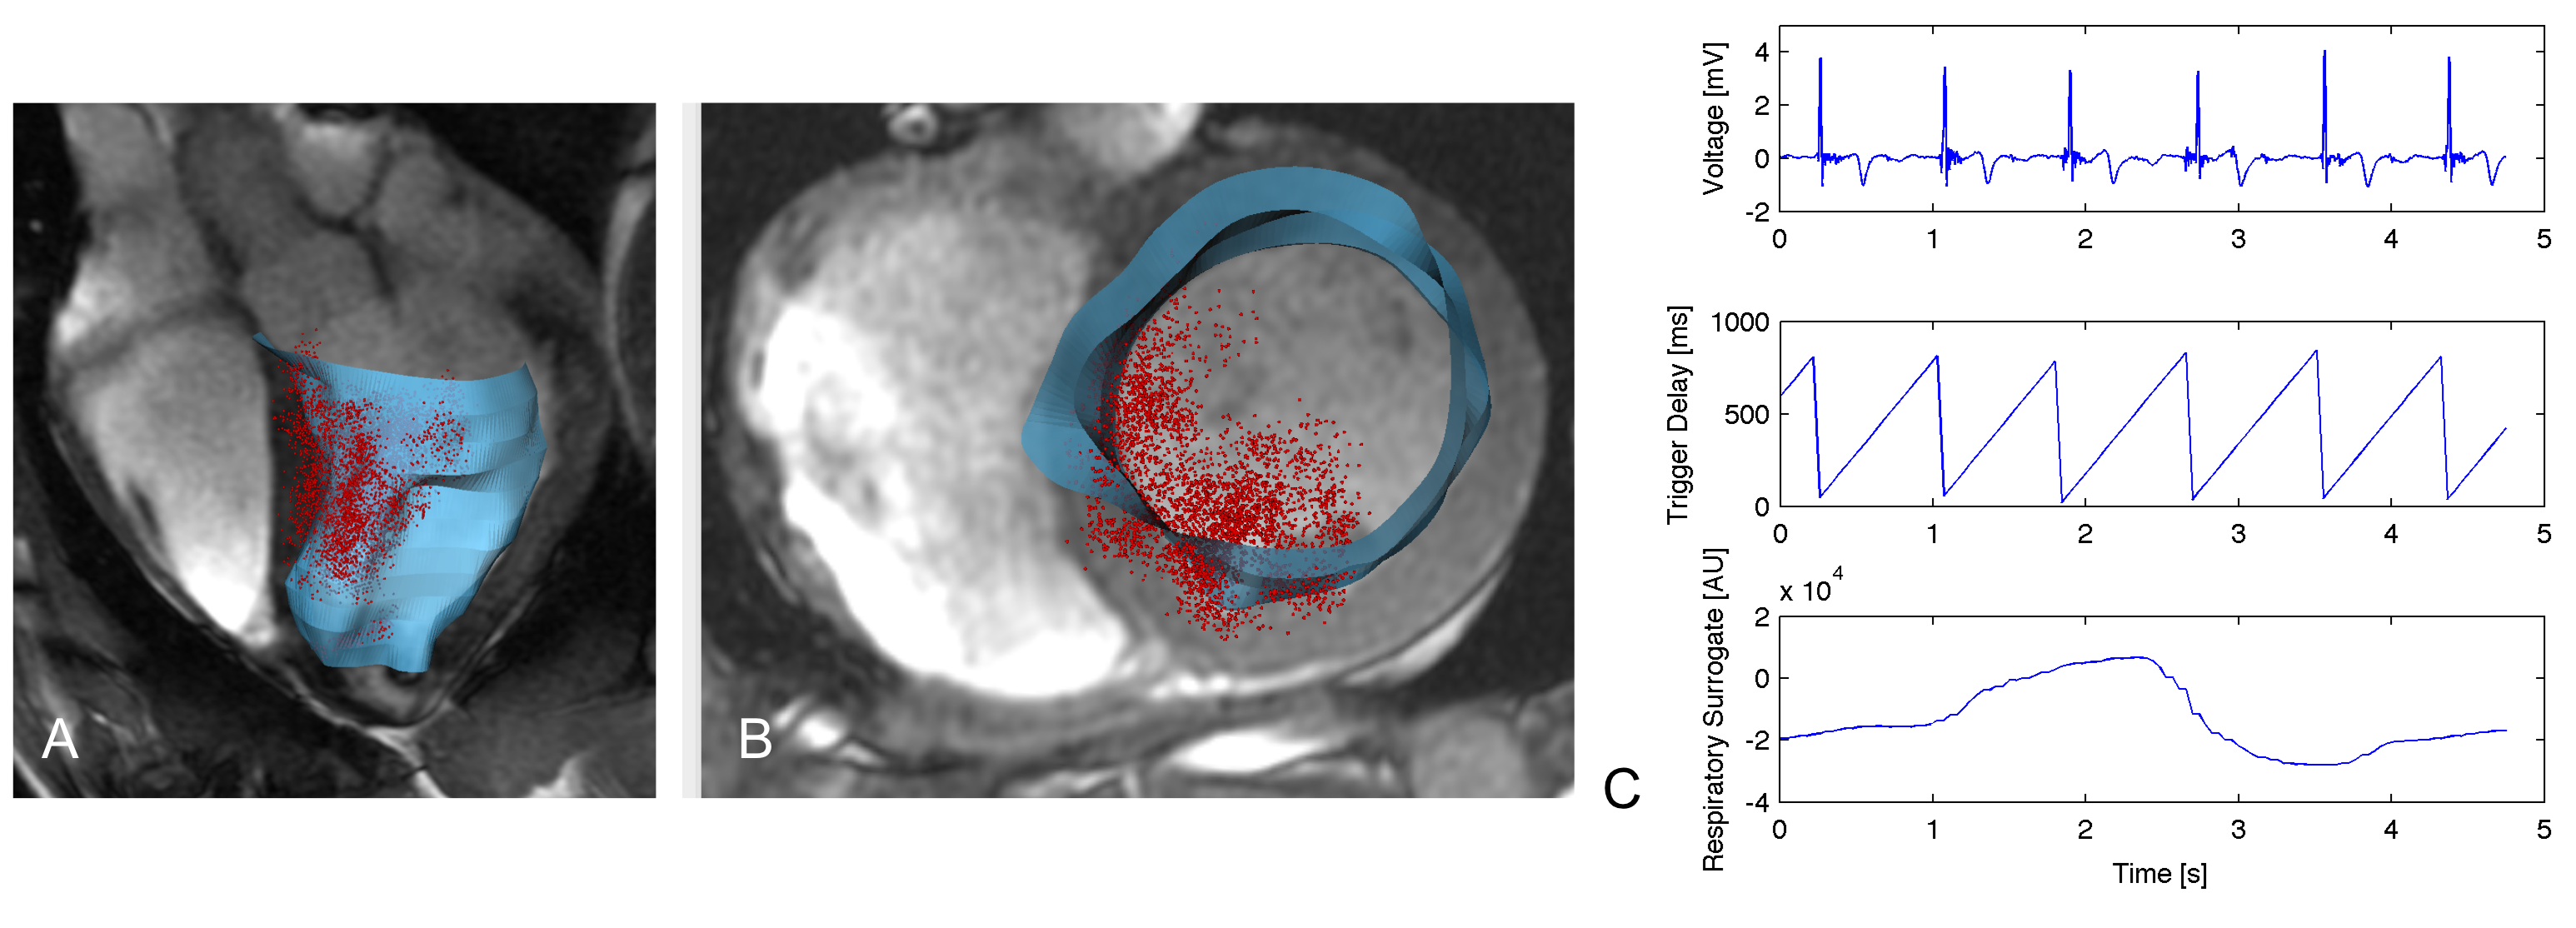
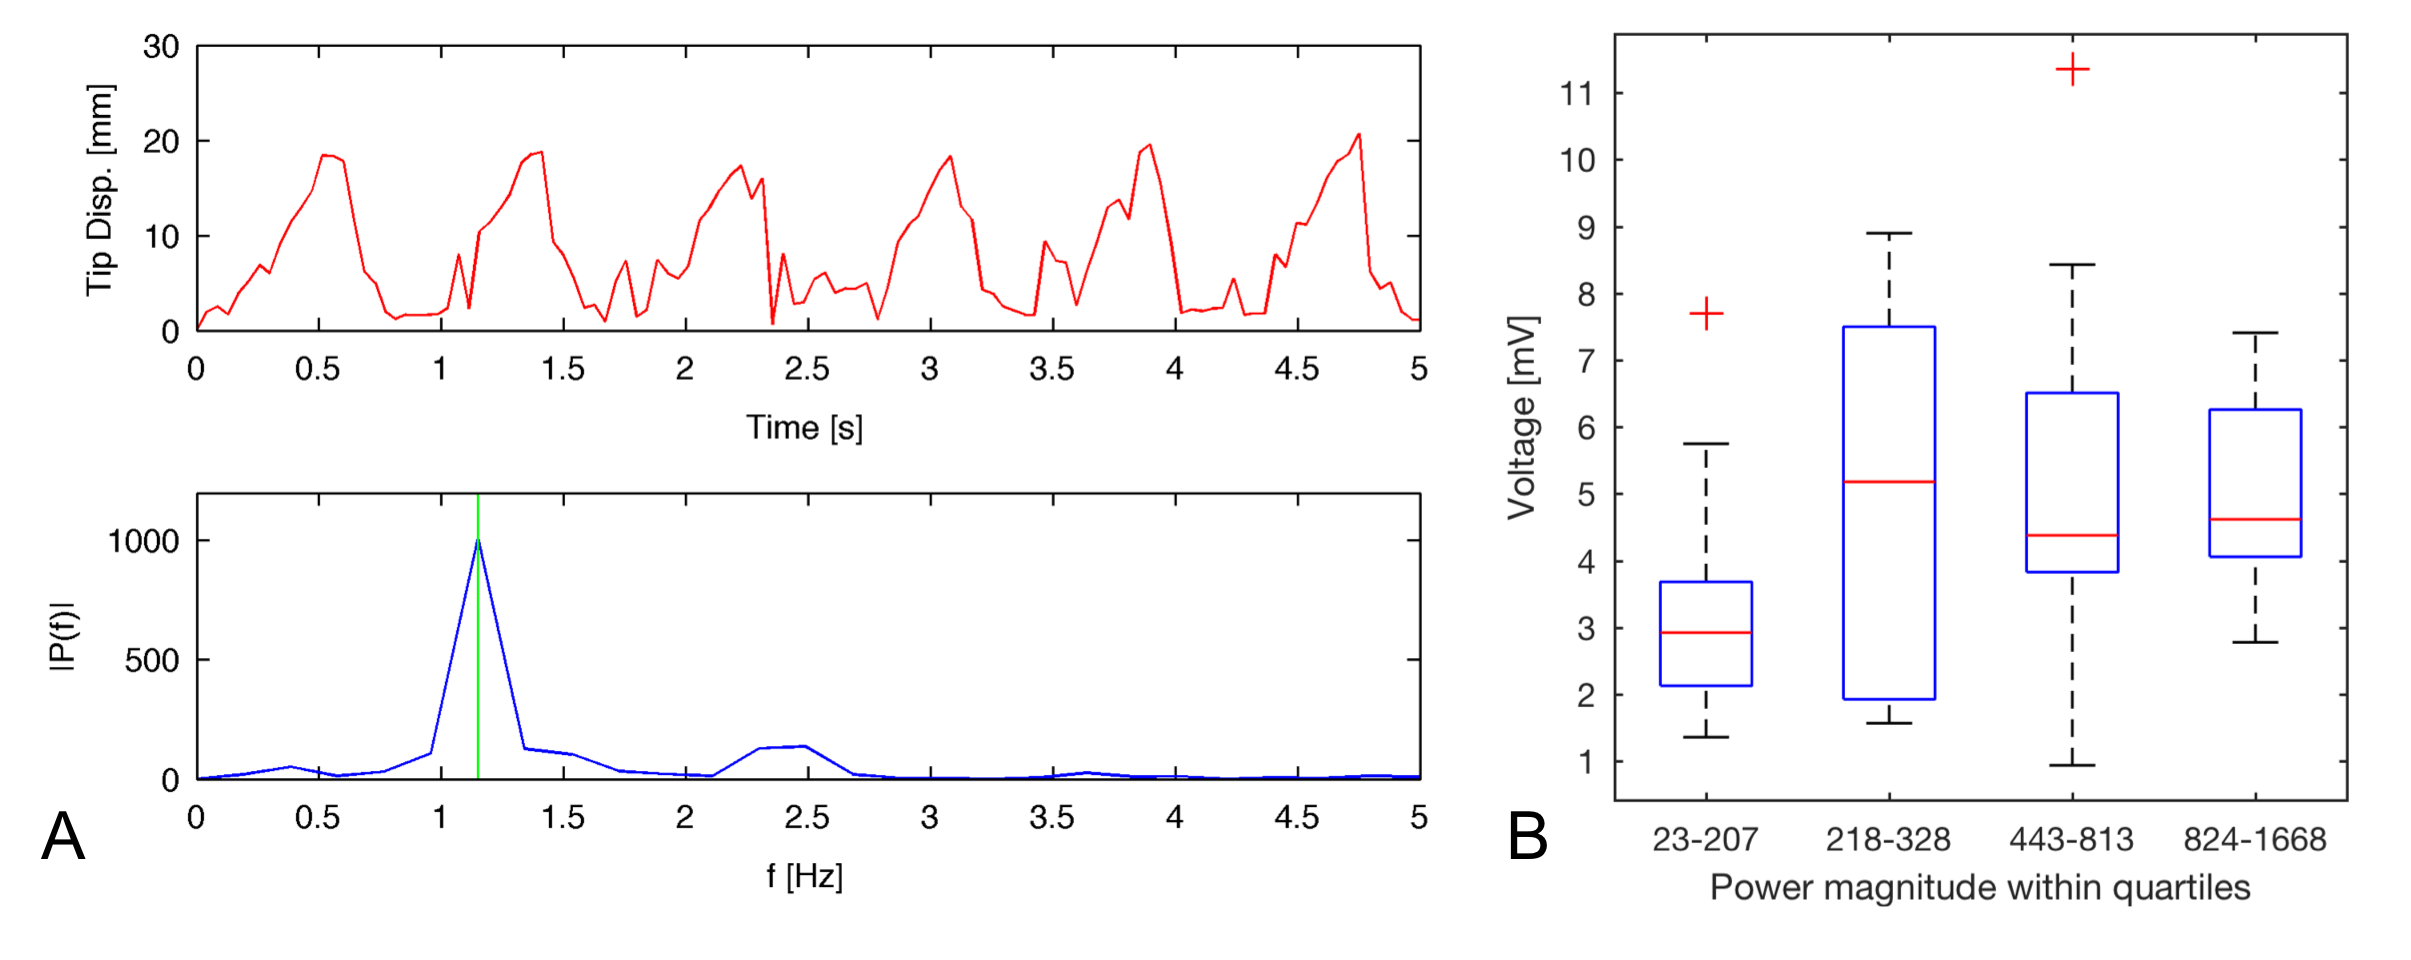
After ablation, electroanatomic voltage maps (EAVMs) were generated in the LV by probing the endocardial surface incrementally with the catheter tip. Each catheter position was associated with a bipolar intracardiac electrogram (EGM) and physiological data (cardiac and respiratory phase surrogates). EAVM data was analyzed retrospectively. The synchronicity of catheter motion with cardiac motion was assessed during EGM recording windows of 5s in healthy tissue using motion power at the fundamental frequency associated with cardiac motion (typically 1-2Hz, obtained from the simultaneous cardiac surrogate trace). An additional catheter-based measure, the bipolar EGM peak-to-peak voltage, was also calculated within each acquisition window.
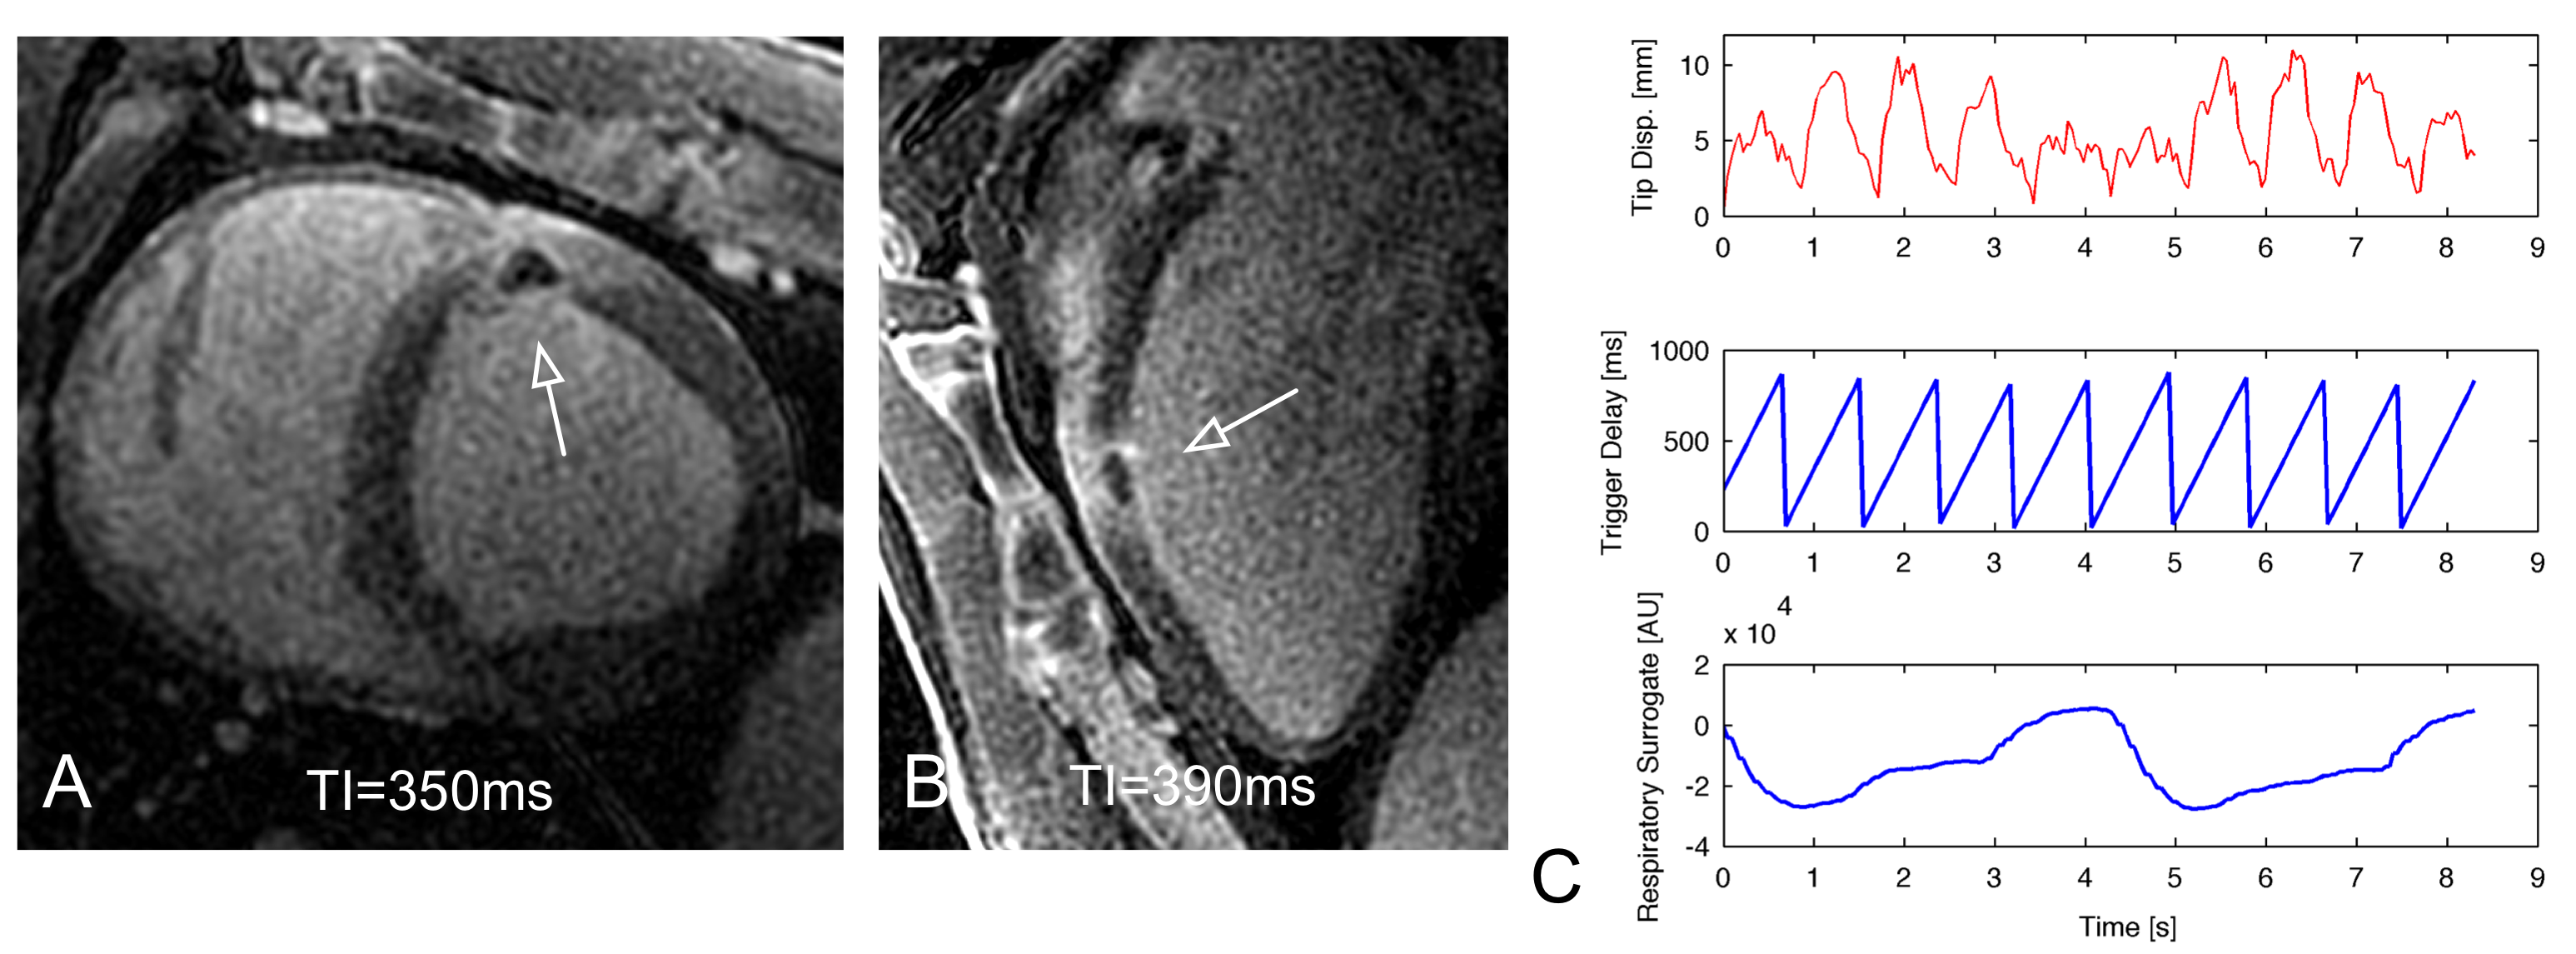
Following EAVM acquisition, a bolus of gadolinium contrast agent was injected and Multi-Contrast Late Enhancement (MCLE)4 (slice thickness=6mm, TE/TR=2.0/5.8ms, FOV=260mm, in-plane resolution=1.25x1.5mm) and respiratory-navigated 3D LGE (TI=250-350ms, FOV=340mm, resolution=1.1x1.1x2.6mm) were used to visualize the lesions. One animal was imaged in situ as it succumbed to arrhythmia before the conclusion of the in vivo study.
Results
Each EAVM consisted of 101-176 EGMs (e.g., Fig. 1). Within healthy (non-ablated) tissue, the mean EGM voltage was 3.8±2.0mV (n=433 healthy EGMs), similar to a prior reported value5. A trend toward increasing voltage (e.g., data from one animal’s EAVM, Fig. 2C) with catheter cardiac motion power was observed between the first interval in motion power (3.3±1.8mV) and the subsequent 3 intervals within which a consistent voltage was observed (mean 5.1±2.8mV). A similar trend was observed among all EAVM recordings for all animals (p=0.26). Recordings during ablation were associated with high motion power (n=5 ablations, median motion power 2.1E+03) and lesions were approximately 58±9% transmural.
Discussion
Prior work has established the connection between catheter motion and global cardiac motion6. Although preliminary analysis of the relationship between EGM voltage and catheter motion power shown in this study was non-significant, the relatively low voltage observed at low motion powers suggests that these very low powers indicate poor endocardial contact, potentially providing a threshold to identify low-quality EAVM measurements that should be discarded. Variability in voltage across EGM recordings might in part reflect situations where the catheter is moving due to wall motion but with inconsistent endocardial contact.
Future work will focus on comparisons of the catheter’s motion and patterns of wall motion seen in cine images, and investigate its potential as a more specific selector of contactConclusions
Catheter motion features such as synchronicity with known cardiac motion may be useful to identify and correct scenarios in which the catheter has inadequate endocardial contact. This information may be used prospectively to aid catheter manoeuvres during mapping and ablation steps in MR-guided interventions.Acknowledgements
No acknowledgement found.References
1. Tanner H, Hindricks G, Volkmer M, et al. Catheter Ablation of Recurrent Scar-Related Ventricular Tachycardia Using Electroanatomical Mapping and Irrigated Ablation Technology: Results of the Prospective Multicenter Euro-VT-Study. J Cardiovasc Electrophysiol. 2010;21:47-53. doi:10.1111/j.1540-8167.2009.01563.x.
2. Dumoulin CL, Souza SP, Darrow RD. Real-time position monitoring of invasive devices using magnetic resonance. Magn Reson Med. 1993;29(3):411-415.
3. Radau PE, Pintilie S, Flor R, et al. VURTIGO : Visualization Platform for Real-Time , MRI-Guided Cardiac Electroanatomic Mapping. Lect Notes Comput Sci. 2012;7085:244-253.
4. Detsky JS, Stainsby JA, Vijayaraghavan R, Graham JJ, Dick AJ, Wright GA. Inversion-recovery-prepared SSFP for cardiac-phase-resolved delayed-enhancement MRI. Magn Reson Med. 2007;58(2):365-372. doi:10.1002/mrm.21291.
5. Leshem E, Tschabrunn CM, Jang J, et al. High-Resolution Mapping of Ventricular Scar. JACC Clin Electrophysiol. 2017;3(3):220-231. doi:10.1016/j.jacep.2016.12.016.
6. Roujol S, Josephson ME, Anter E, Josephson ME, Nezafat R. Characterization of Respiratory and Cardiac Motion from Electro-Anatomical Mapping Data for Improved Fusion of MRI to Left Ventricular Electrograms. PLoS One. 2013;8(11). doi:10.1371/journal.pone.0078852.
Figures