0592
Integrated structural and functional connectivity analysis to characterize abnormalities in ADHD1Brigham and Women's Hospital, Boston, MA, United States, 2Harvard Medical School, Boston, MA, United States, 3Boston Children's Hospital, Boston, MA, United States
Synopsis
We introduce a novel approach for integrating novel diffusion MRI (dMRI) derived microstructural properties and resting state functional MRI (rsfMRI) derived functional measures to obtain a comprehensive understanding of brain abnormalities in neuropsychiatric disorders. We applied this methodology to study abnormalities in children with attention-deficit hyperactivity disorder (ADHD), providing a probabilistic view of the abnormal connections, thus accounting for the heterogeneity in the presentation of ADHD. We further show that the integrated analysis is significantly more sensitive than separate dMRI and rsfMRI analyses. Apart from known connections reported to be abnormal in the literature, we find several new abnormal connections in ADHD subjects with high probability.
Introduction
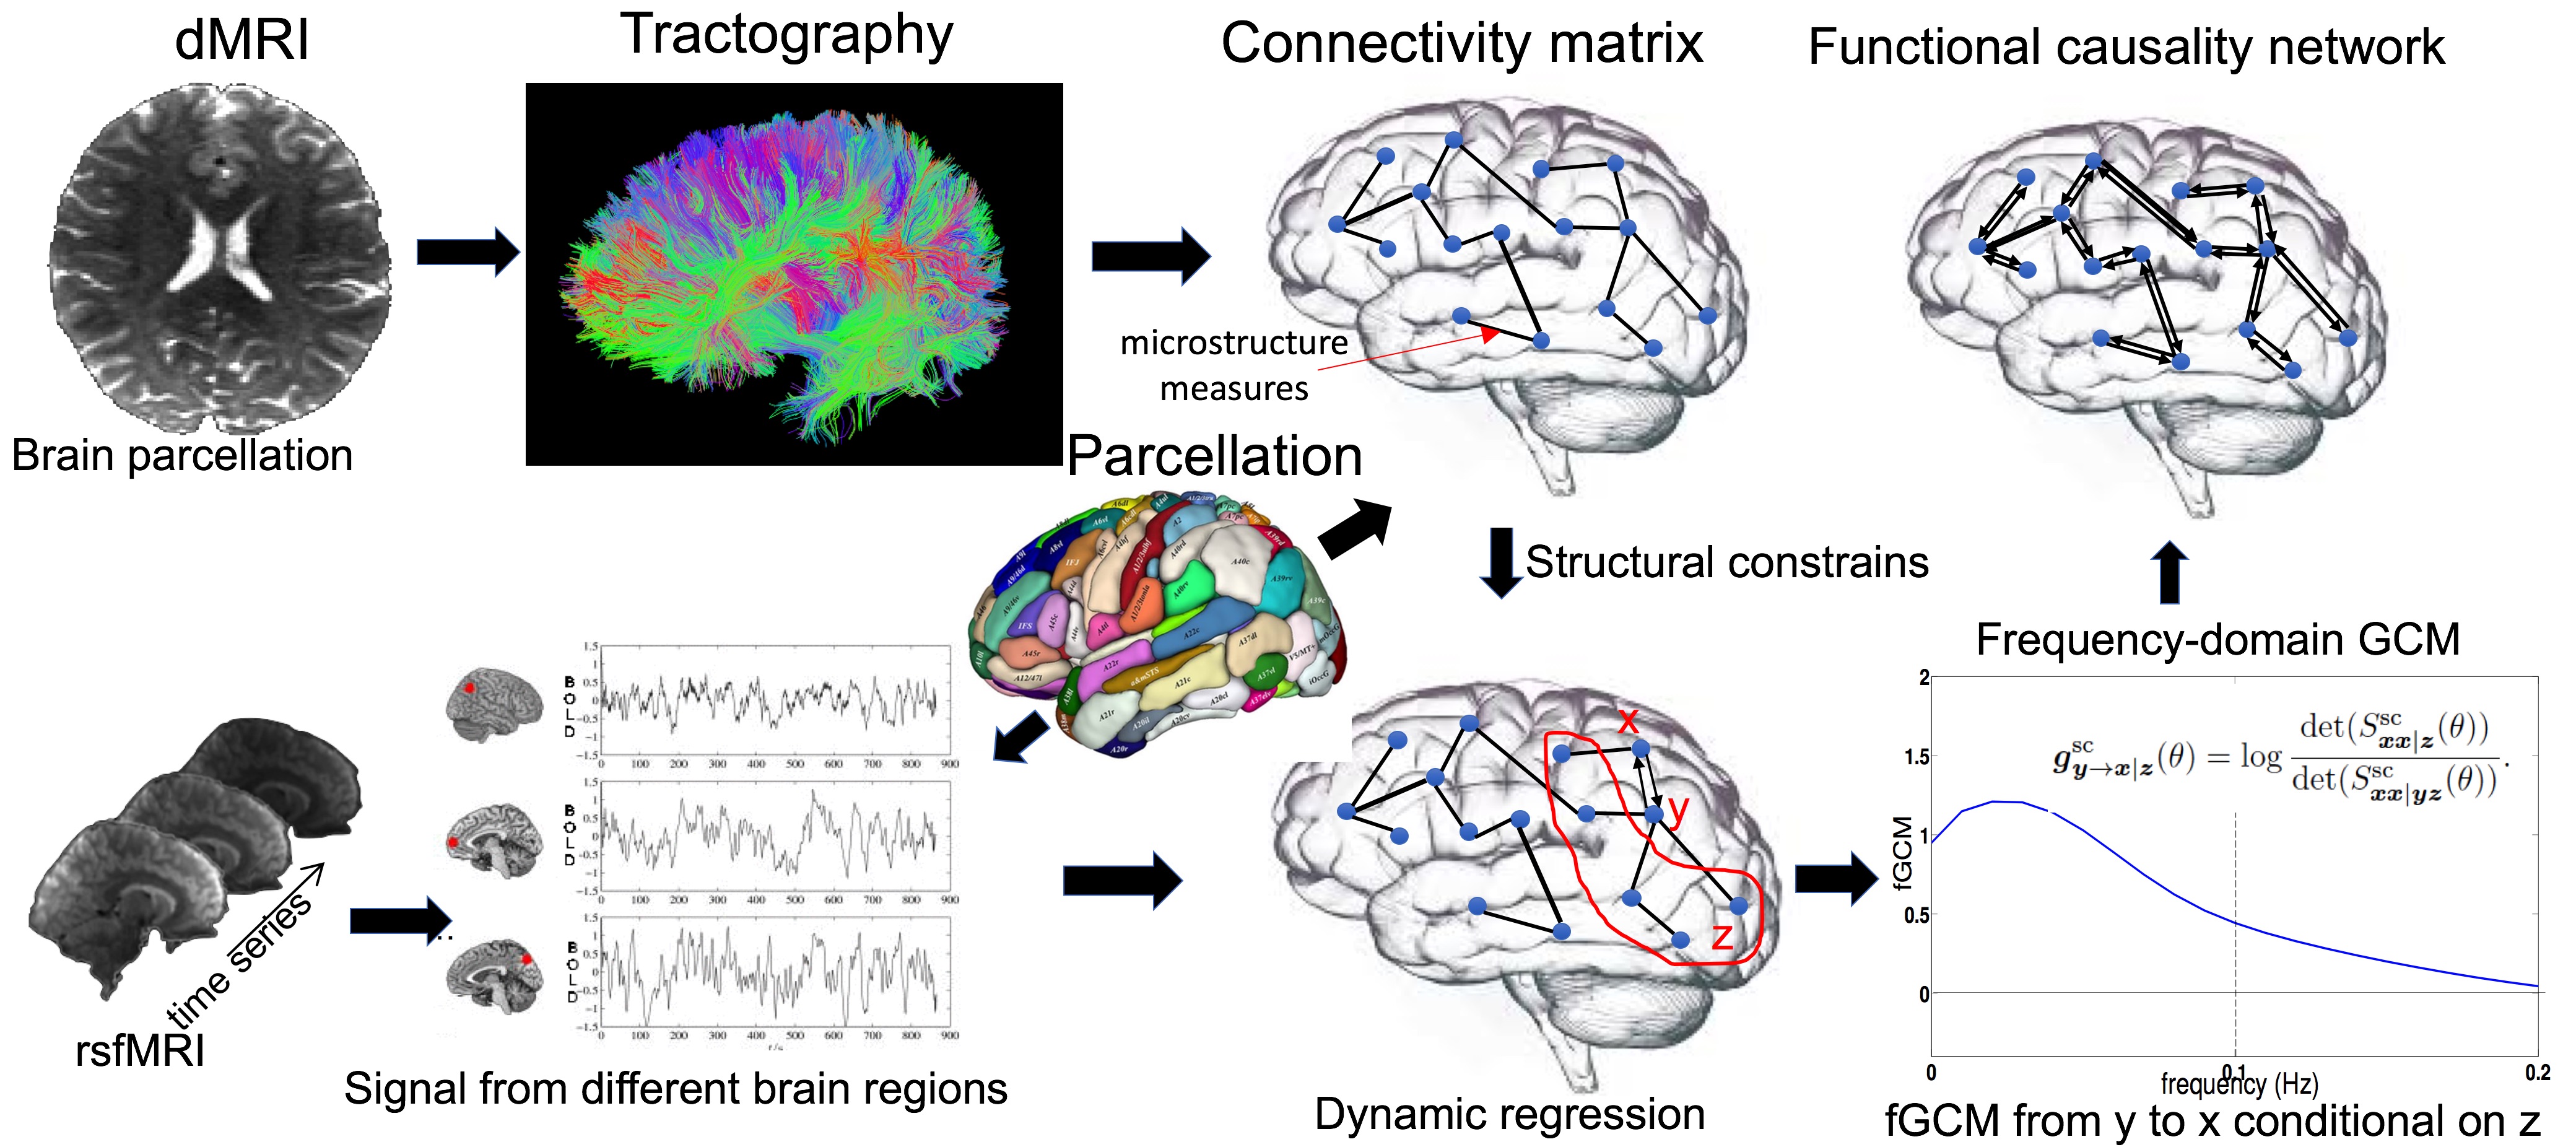
dMRI can provide important information about the microscopic organization of axons and cells in the human brain. On the other hand, rsfMRI provides information about the associated functional brain activity, with the structural connectivity forming the core underlying mechanism for functional connectivity. However, this biological fact has been ignored by most works. We estimate effective connectivity as a measure that accounts for the influence of one brain region on an another one owing to the underlying structural connection via the neuronal pathways. In this abstract, we introduce a novel approach for integrating novel dMRI and rsfMRI measures and show that it provides increased sensitivity to abnormalities in ADHD.Method
Data: Our study included 27 subjects with ADHD and 26 age-matched controls. Diffusion MRI was acquired from a Siemens Trio 3T MRI scanner using multi-slice acquisition (x2) at spatial resolution of 2x2x2 mm3; with 70 gradient directions spread over 3 b-value shells of 1000/2000/3000 s/mm2. The rsfMRI data was collected using the following parameters: TR/TE=1090/30 ms, voxel size=3x3x3 mm3, volume number=400. rsfMRI data was processed using the standard pipeline with slice-time correction, motion correction, temporal filtering, regression of nuisance signal using the SPM processing toolbox1. Moreover, a T1w MRI was acquired for all subjects to create brain parcellations using FreeSurfer2.
dMRI analysis: We used our multi-fiber UKF-tractorgraphy3 algorithm with a bi-exponential model to simultaneously estimate the model parameters and perform tractography. The method allowed robust computation of fiber bundle specific measure of return-to-axis probability (RTAP), which is inversely proportional to cellular cross-sectional area (or axonal density)4,5. We computed the connectivity matrix between the brain regions based on the FreeSurfer parcellations and the average RTAP value for each structural connection. A total of 1204 connections were identified between 89 cortical and subcortical regions.
rsfMRI analysis: Our novel analysis included using this connectivity matrix as a structural constraints to compute the conditional frequency-domain Granger causality measure (fGCM) between each pair of connected brain regions using our algorithm in6, as illustrated in Fig. 1. The novelty in our method is that the influence from other brain regions is regressed out when computing the causal relations between any two brain regions. Moreover, we take the average value of fGCM in the 0-0.1 Hz frequency interval to increase the specificity of fGCM to intrinsic brain activity7. Thus, each connected pair of brain regions, say x and y, is associated with two scalar measures, corresponding to the causal relations from x to y and from y to x, respectively.
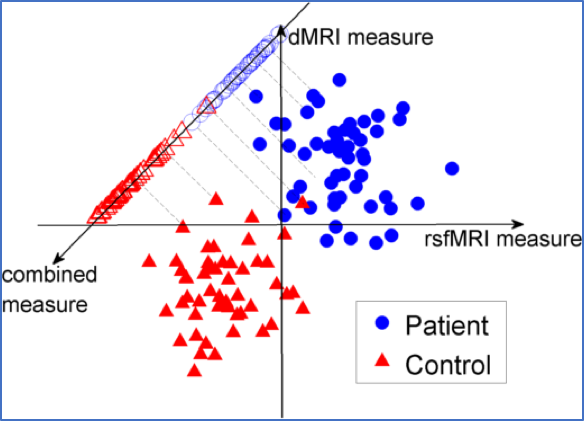
Integrated dMRI and rsfMRI analysis: We applied the linear discriminant analysis (LDA)8 to project the multidimensional dMRI-and-rsfMRI measures from each brain connection onto a one-dimensional line so that the projected measures from patients and controls are maximally different from each other, as illustrated in Fig. 2. Thus, the fused data maximally retains ADHD-related brain abnormalities.
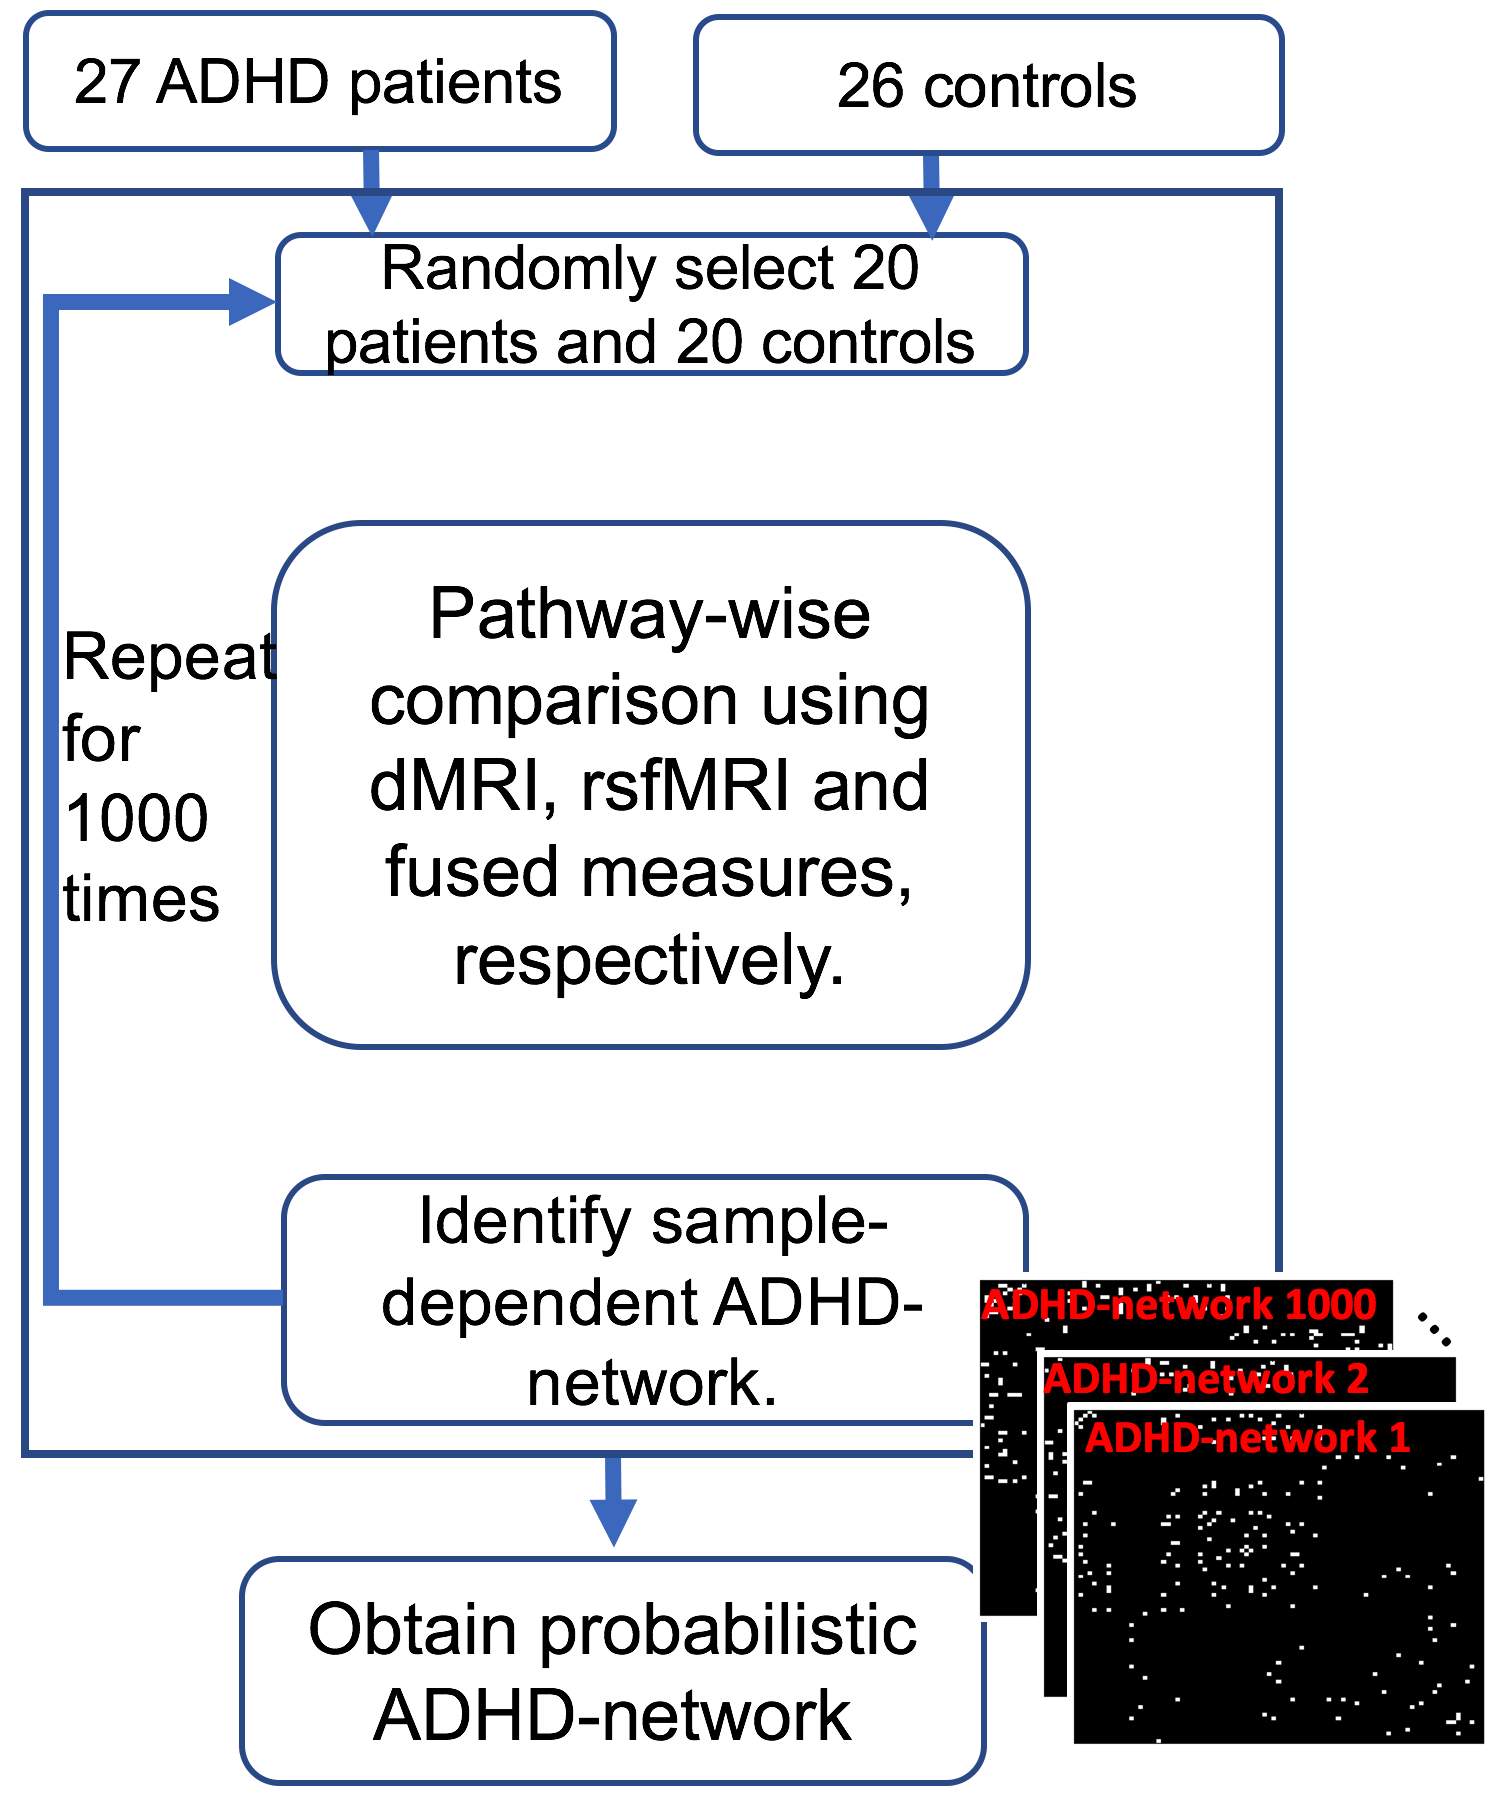
Randomized experiment and probabilistic ADHD-network: We used three experiments for identifying ADHD-related brain connection abnormalities; 1). using structural connectivity alone from dMRI (RTAP), 2). Using functional connectivity alone from rsfMRI and 3). finally the proposed integrated analysis of dMRI-and-rsfMRI, as illustrated in Fig. 3. In each experiment, we randomly selected 20 patients and 20 controls. We applied pathway-wise group comparisons to select the connections whose imaging measures are significantly different between the two groups. By selecting the connections with p<0.01 in permutation tests, without correcting for multiple comparisons, we obtain a sample-dependent ADHD-network. We note that, in the analysis of rsfMRI data, a connection was considered abnormal if either one of the two direction-dependent causality measures are abnormal. We repeated the randomized subject selection for 1000 times and computed the probability of abnormalities for each pathway.
Result
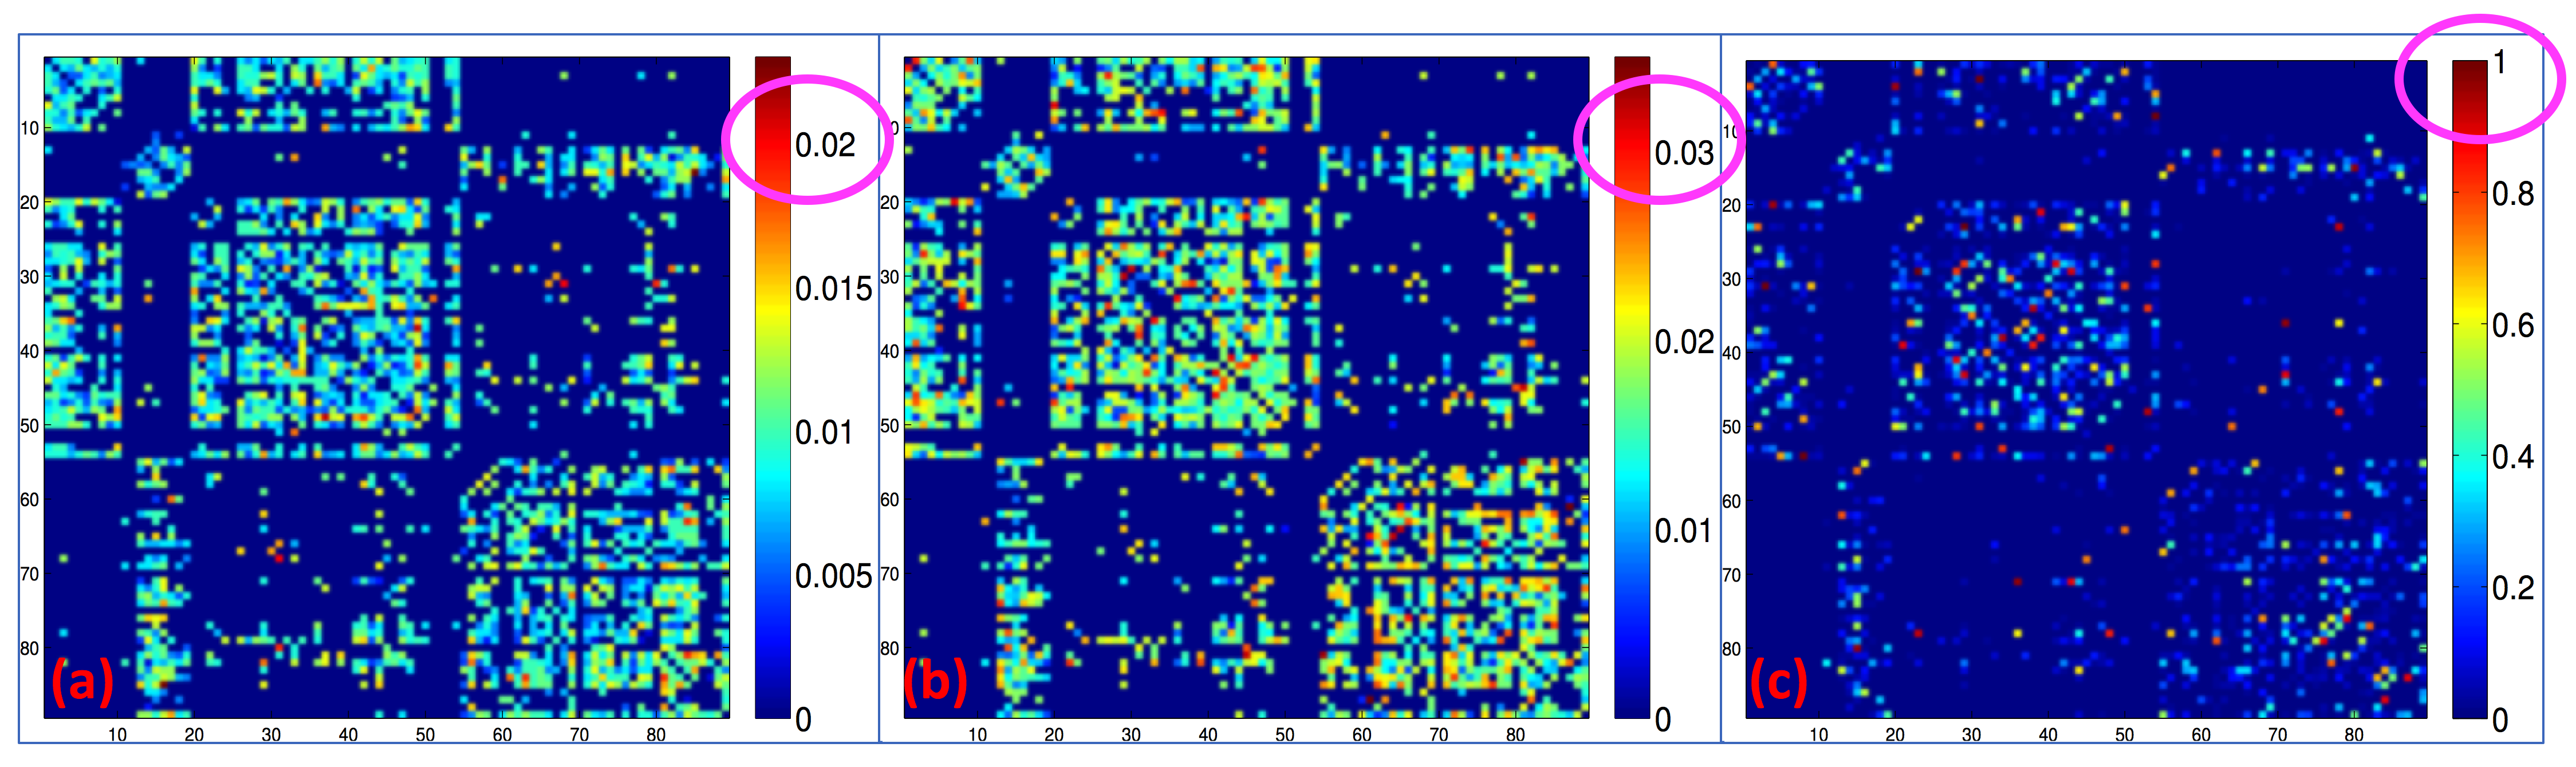
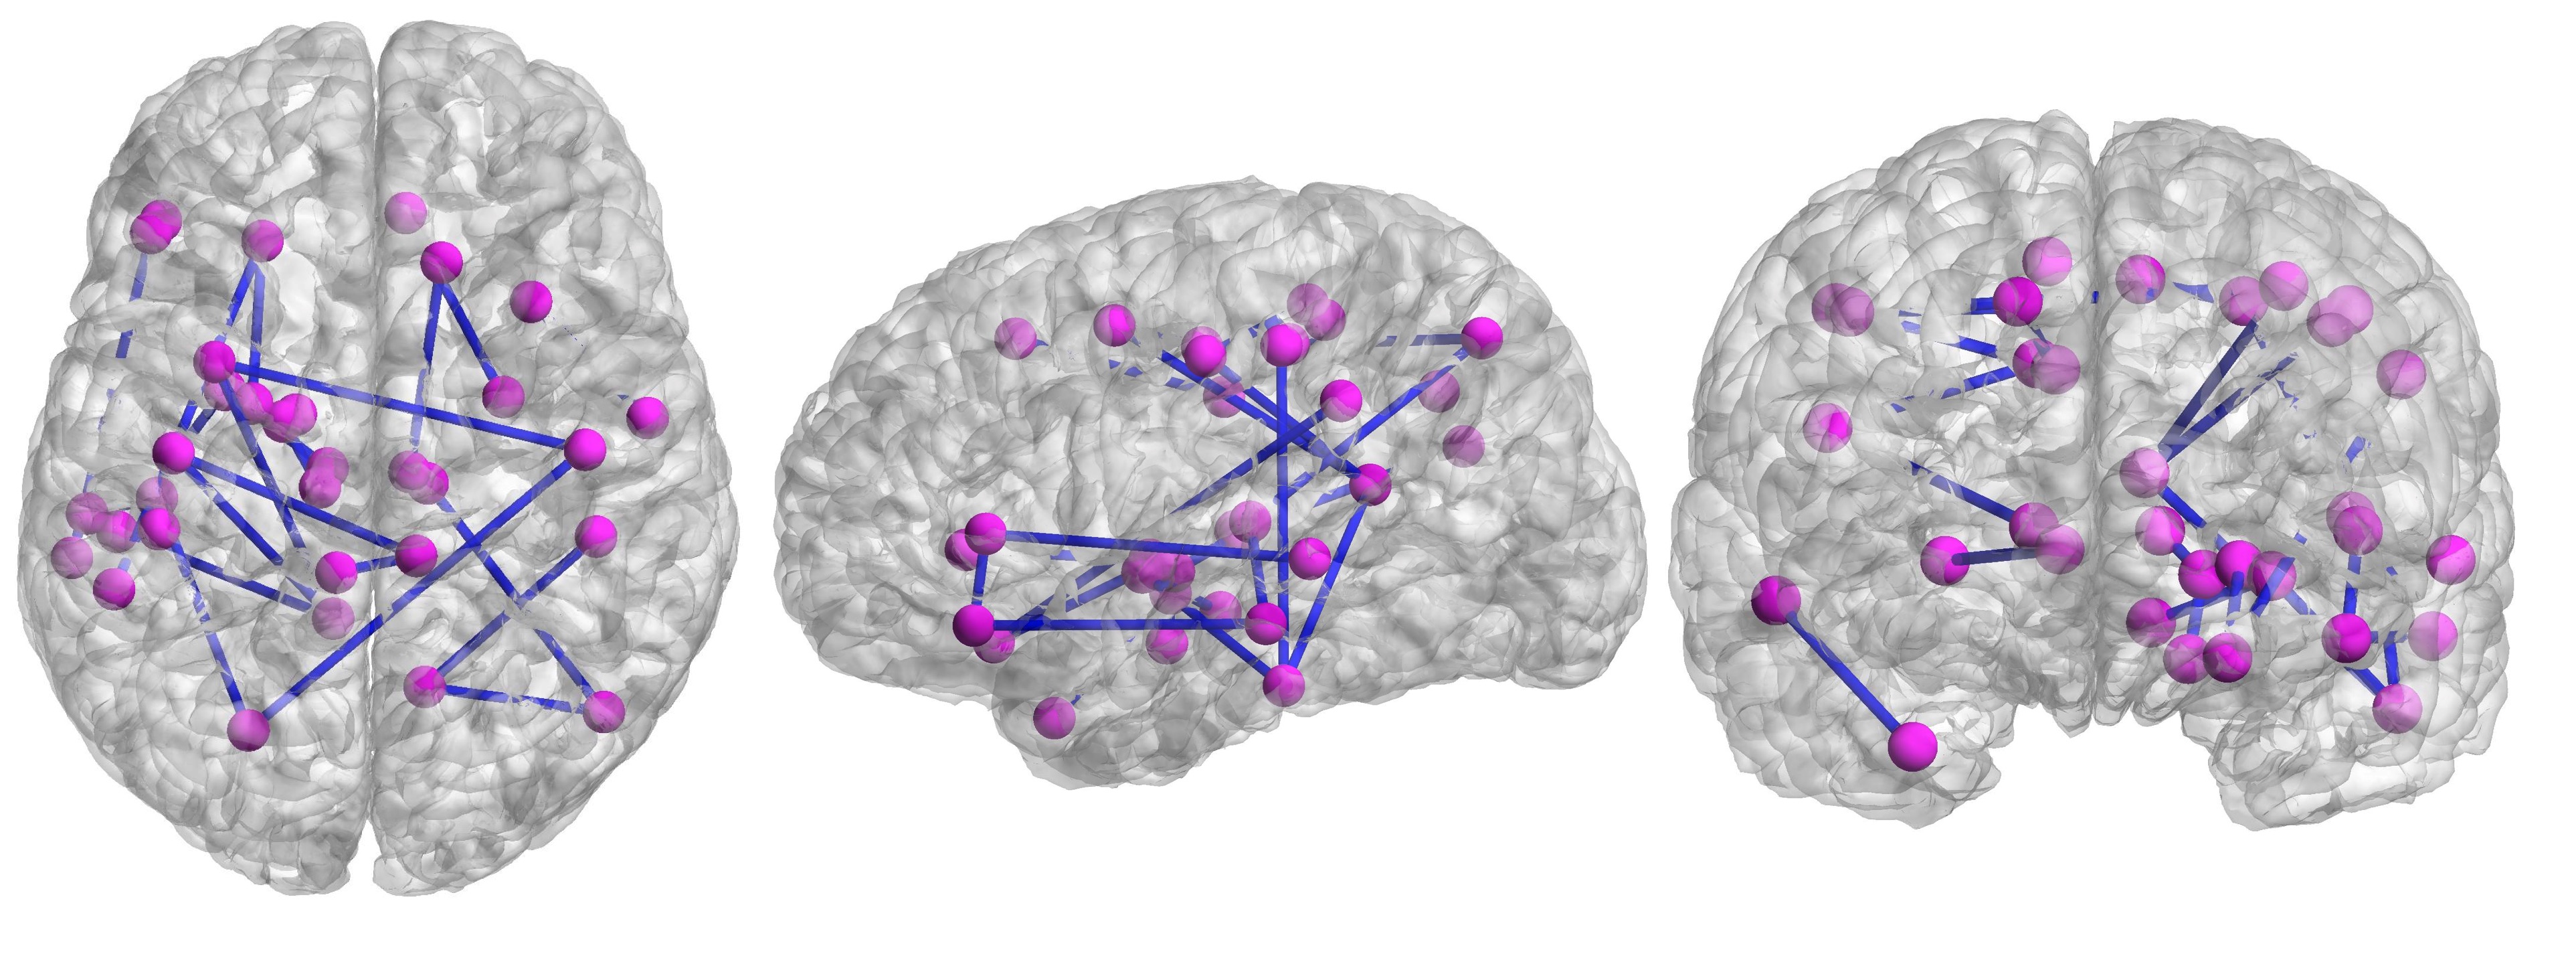
Fig. 4 illustrates the probabilistic ADHD-networks from the analysis of dMRI, rsfMRI and the integrated analysis. We note that both dMRI and rsfMRI did not provide any high-probability abnormal connection, with the highest probability being 2.3% and 3.5%, respectively. On the other hand, the integrated approach consistently identified several abnormal connections from the 1000 randomized experiment, with a total of 24 connections found to be abnormal with a probability of at-least 75% as illustrated in Fig. 5. We note that our result recovers several connections related to the thalamus and cingulate, which are known regions found to be abnormal in ADHD from previous studies9. Moreover, we also note an interesting observation that a subset of the high-probabilistic connections also form a connected subnetwork.Conclusion
The proposed approach of fusing multidimensional measures of tissue microstructure and functional causality significantly improved the sensitivity of brain abnormalities in ADHD. The proposed method is an important step towards a mechanistic and brain biology driven approach to understand abnormalities in neuropsychiatric disorders.Acknowledgements
The work was supported in by NIH under R01MH097979 (PI: Rathi), R01MH111917 (PI:Rathi), R01MH074794 (PI: Westin), and P41EB015902 (PI:Kikinis).References
- SPM: http://www.fil.ion.ucl.ac.uk/spm/
- Fischl, B., FreeSurfer. NeuroImage. 2012; 62(2): 774-781.
- Rathi, Y., Gagoski, B., Setsompop, K., Michailovich, O., Grant, P. E., & Westin, C. F. (2013, September). Diffusion propagator estimation from sparse measurements in a tractography framework. In International Conference on Medical Image Computing and Computer-Assisted Intervention (pp. 510-517). Springer, Berlin, Heidelberg.
- Özarslan, E., Koay, C.G., Shepherd, T.M., Komlosh, M.E., İrfanoğlu, M.O., Pierpaoli, C., Basser, P.J., Mean apparent propagator (MAP) MRI: a novel diffusion imaging method for mapping tissue microstructure. NeuroImage. 2013; 78:16-32.
- Ning, L., Westin, C.-F., and Rathi, Y., Estimating diffusion propagator and its moments using directional radial basis functions. IEEE Transactions on Medical Imaging. 2015; 34(9):1–21.
- Ning, L., and Rathi, Y., A dynamic regression approach for frequency-domain partial coherence and causality analysis of functional brain networks. IEEE Trans Med Imaging. 2017c, doi: 10.1109/TMI.2017.2739740.
- van Dijk, K., Hedden, T., Venkataraman, A., Evans, K., Lazar, S., Buckner, R.: Intrinsic functional connectivity as a tool for human connectomics: theory, properties, and optimization. J. Neurophysiol, 2010; 103(1), 297–321.
- McLachlan, G. J. Discriminant Analysis and Statistical Pattern Recognition. 2004. Wiley Interscience.
- Makris, N., Biederman, J., Monuteaux, M.C., Siderman, L.J., Towards conceptualizing a neural systems-based anatomy of attention-deficit/hyperactivity disorder. Developmental Neuroscience. 2009; 31:36-49.
Figures