0591
Early Development of Modular Organization in Brain Functional Networks at Multiple Scales1Sun Yat-Sen University, Guangzhou, China, 2University of North Carolina at Chapel Hill, Chapel Hill, NC, United States, 3South China University of Technology, Guangzhou, China
Synopsis
Increasing studies focus on delineating the development of brain networks of infants by detecting the corresponding modular organization. However, in these papers, the adopted module detection method, i.e., maximizing modularity, has a resolution limit, such that modular structures could only be investigated at a particular scale. To address this issue, by leveraging a novel multi-resolution modularity detection method, we explored the development of
Introduction
The first 2 postnatal years is a critical and dynamic period of human brain development, where subtle changes could exert profound influences on later life. Increasing studies thus have devoted to delineate how the brain develops in this period. To investigate infant brain development, functional networks are widely used based on resting-state functional magnetic resonance imaging (rs-fMRI). Modular organization, as one of the important network measures, could provide valuable information to improve our understandings of brain functions. Although several studies have focused on this field 1-2, the existing methods based on modularity maximization allow investigating the modular organization only at a particular scale. Such approaches cannot address the possibility that modules exist over a wide range of scales (where the scale indicates the spatial size of the detected modules), i.e., multi-scale modular structure. To address this issue, by adopting a novel multi-resolution modularity maximization method, this study uncovered the development of modular organization of brain functional networks in the first 2 postnatal years across multiple spatial scales, ranging from small modules comprised by only a few regions to large modules made up of many regions.Methods
Seventy-two typically developing infants with 90 longitudinal rs-fMRI scans, i.e., neonates (N = 33), 1-year-olds (N = 35), and 2-years-olds (N = 29), were recruited in this study. Data preprocessing was detailed in the paper of Gao et al 3. To construct the brain functional networks, we first parcellated the whole brain into 180 regions (excluding the cerebellum) by combining the template provided by Craddock et al 4. For each scan, a functional network was constructed by using each brain region as a node and the Pearson’s correlation coefficients between any pair of brain regions as an edge. For group analysis, we averaged the functional brain networks across all subjects to obtain a group-level representative network. Since the subjects were scanned at 0, 1, and 2 years of age, three group-level networks were constructed accordingly. To keep the sparsity of functional networks, we only kept the top 10% strongest positive connections for the following group-level module detection. Based on the constructed group-level networks, the multi-resolution modularity maximization method 5 was adopted to detect the modular structures at each age group. In this method, by introducing a resolution parameter γ into the modularity measurement, the modules could be uncovered at different scales by tuning the γ. A small value of γ indicates that the modules will be obtained at a coarser scale, while a large value of γ indicates that the modules will be obtained at a finer scale. In this study, the range of γ was set from 0.5 to 3.0 with an interval of 0.5.Results
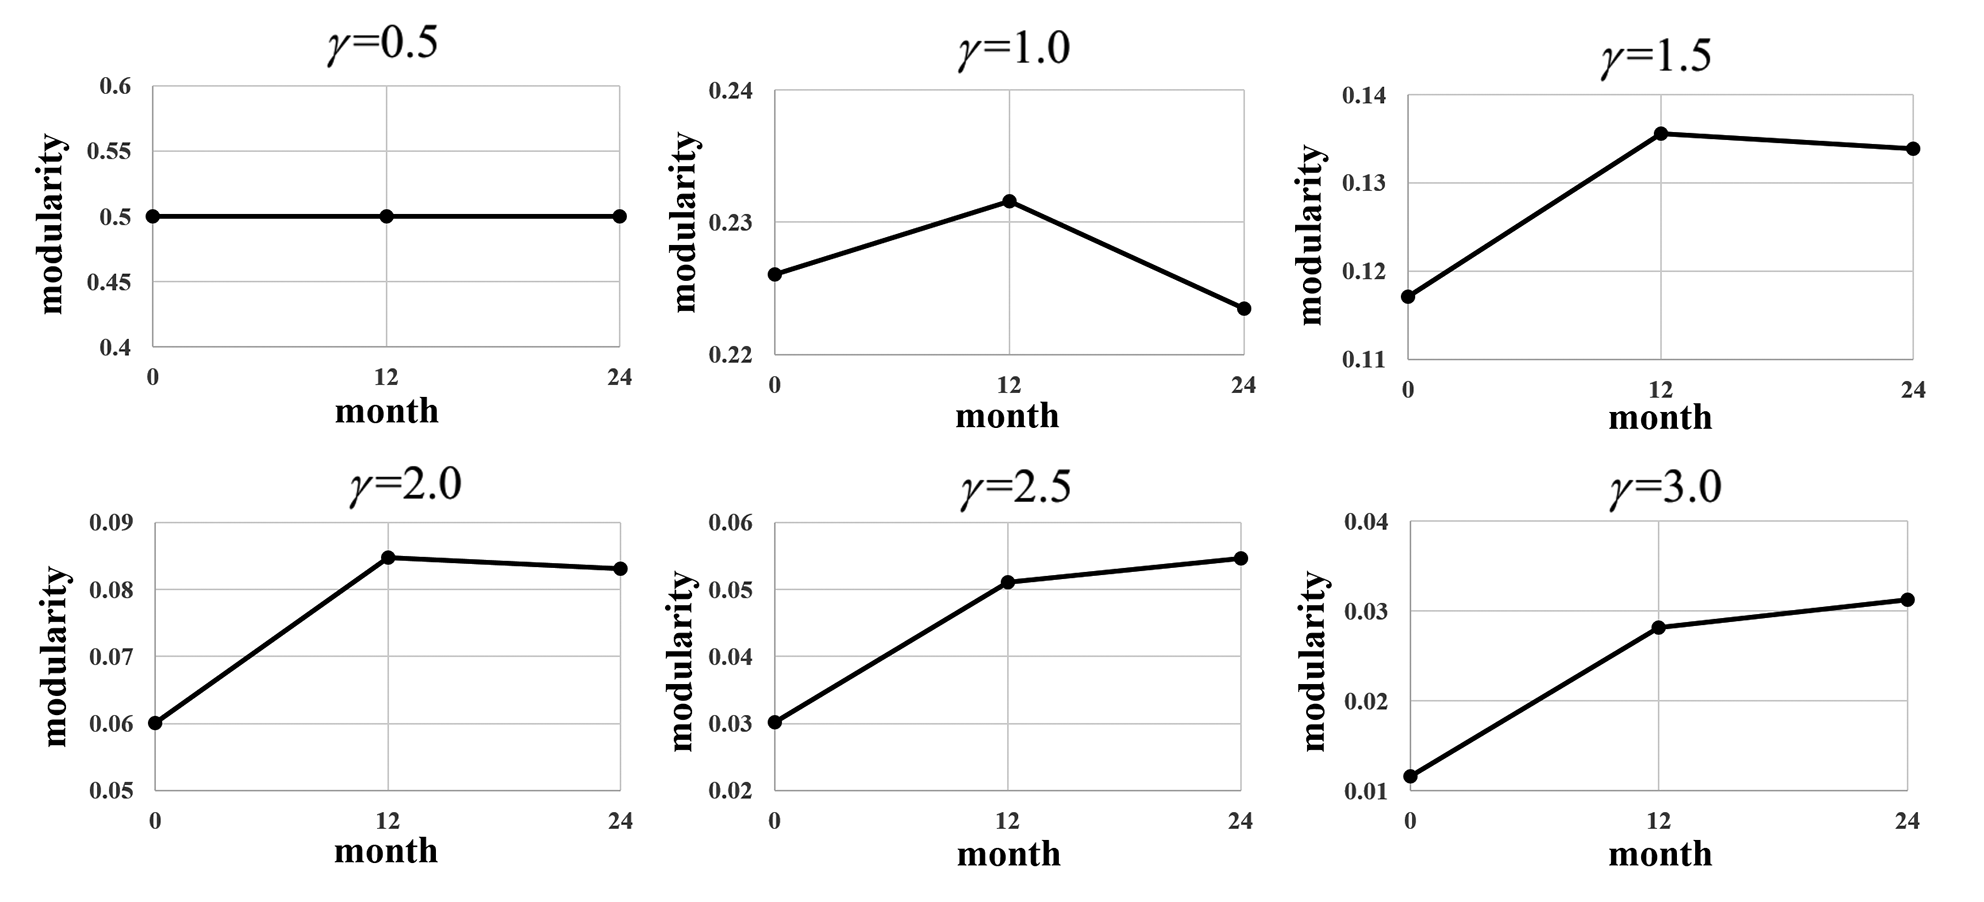
By changing the values of γ from 0.5 to 3.0, we detected modular structures of functional networks at each age at six scales and plotted the corresponding modularity changing curves in Fig. 1. The tendencies of modularity during development mainly included three types: 1) always keeping flat (γ = 0.5); 2) first increasing and then decreasing (γ = 1.0); 3) first increasing and then keeping flat (γ > 1.0). Such results reflected a scale-specific developmental pattern of modular structures in the first 2 years of life.
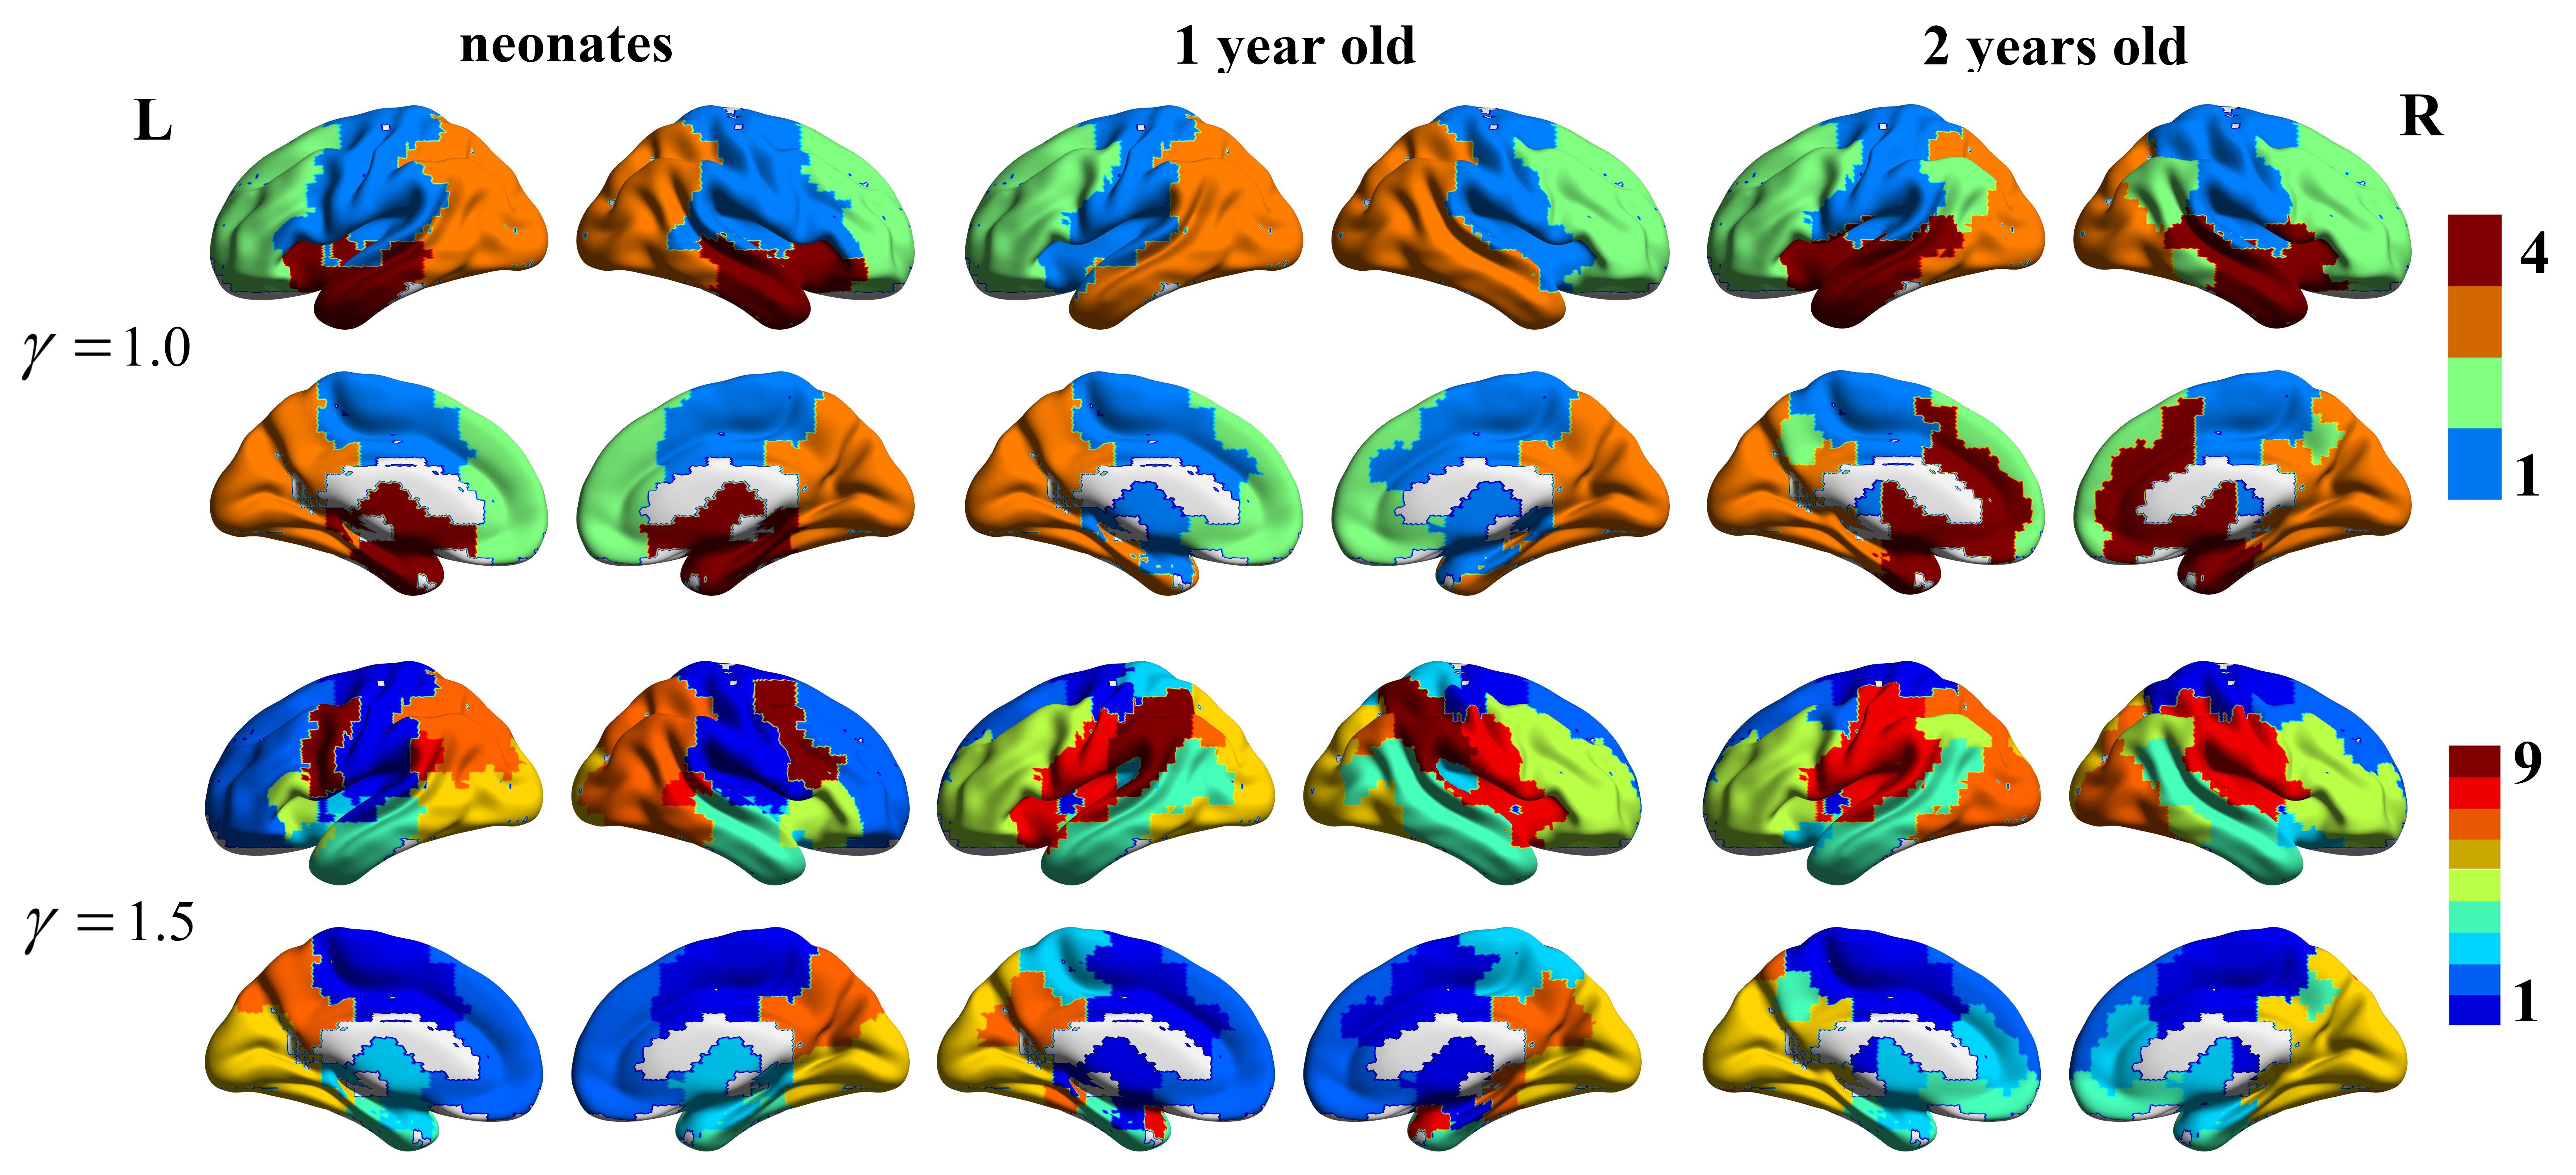
For each modularity development type, we selected a representative case to visualize the detected modular structures in the anatomical space as shown in Fig. 2. Since only one module was detected at all ages when setting γ as 0.5, the corresponding module partition was not shown for this γ value. From Fig. 2, we found that, with the increase of γ, the number of the detected modules was increased for each age group, indicating that the module detection was changed from coarser to finer. At a coarser scale (γ = 1.0), we can see that the frontal areas and a part of the parietal areas were merged to one module at 2 years of age, indicating that the intrinsic functional connectivity between these two areas was strengthened during the development. At a finer scale (γ = 1.5), with the development, we found a gradual generation of the high-order cognitive function related networks, including the default mode network and the frontal-parietal network. In summary, different modular scales could reveal different developmental patterns of brain functional networks in infants.
Conclusions
Our findings suggest that the modular organization of brain functional networks has scale-specific developmental patterns in the first 2 postnatal years. Different scales provide different perspectives for characterizing early development of human brain modular structures.Acknowledgements
This study was supported in part by NIH grants (MH100217, MH108914, MH107815, and MH110274).References
[1] van den Heuvel, M.P., Kersbergen, K.J., de Reus, M.A, et al. 2015. The neonatal connectome during preterm brain development. Cerebral Cortex 2015; 25: 3000-3013.
[2] Cao, M., Huang, H., He, Y. Developmental Connectomics from Infancy through Early Childhood. Trends in Neurosciences 2017; 40: 494-506.
[3] Gao, W., Alcauter, S., Elton, A., et al. Functional network development during the first year: relative sequence and socioeconomic correlations. Cerebral Cortex 2015; 25: 2919-298.
[4] Craddock, R.C., James, G.A., Holtzheimer, P.E. et al. A whole brain fMRI atlas generated via spatially constrained spectral clustering. Human Brain Mapping 2015; 33: 1914-1928.
[5] Reichardt J, Bornholdt S. Statistical mechanics of community detection. Phys. Rev. E. 2006; 74(1): 016110.
Figures