0587
Compartmental brain sodium concentrations in human brain tissues in white matter and grey matter: a multi-echo ultra-high field 23Na-MRI study1CRMBM, Aix-Marseille University, Marseille, France, 2CEMEREM, APHM Hôpitaux de la Timone, Marseille, France, 3Institute of Radiology, University Hospital Erlangen, Erlangen, Germany, 4German Cancer Research Centre, Division of Medical Physics in Radiology, Heidelberg, Germany
Synopsis
Using multi-echo 23Na-MRI at 7T acquired in 13 healthy subjects and modelling the relationship between signal and reference concentration and applying it to in vivo 23Na-MRI signal, we quantify both T2* decay times and concentrations associated with short and long components for the first time. Relaxation times and concentrations differed between grey and white matter and subregions of differing tissues, suggesting sensitivity of 23Na toward features of tissue composition. As such, these results raise the prospect of multi-echo 23Na-MRI as an adjunct source of information on biochemical mechanisms in both physiological and pathophysiological states.
Introduction
Sodium ion transmembrane homeostasis is a precondition for several critical neuronal functions, subject to pathological modification as shown by 23Na-MRI methods including ultra-short echo times (UTE, ~0.2ms), multiple quantum filtering (MQF) or inversion recovery (IR)1. However, uncertainty can arise in in vivo 23Na estimates from signal losses given the rapidity of T2* decay given biexponential relaxation with both short (T2*short) and long (T2*long) components. Existing approaches attempt to minimize uncertainty but are insensible to different compartments (UTE), or weight toward rapidly relaxing components but suffer from strong SNR and resolution penalties (MQF), or are not easily amenable to providing quantitative estimates of sodium (IR). In contrast, we build on previous work by characterizing the decay curve directly via multi-echo imaging with the requisite number, distribution and range to assess the distribution of both2,3 in vivo T2*short and T2*long and in variation between grey (GM) and white matter (WM) and subregions for the first time4,5. Furthermore, by modelling the relationship between signal and reference concentration and applying it to in vivo 23Na-MRI signal, we quantify Na concentrations associated with short and long components for the first time.Methods
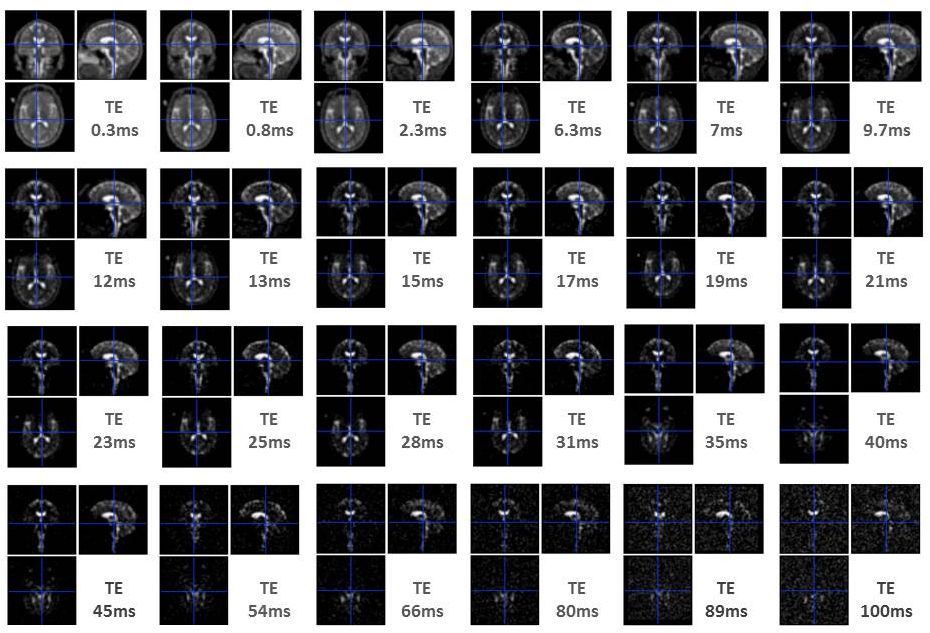
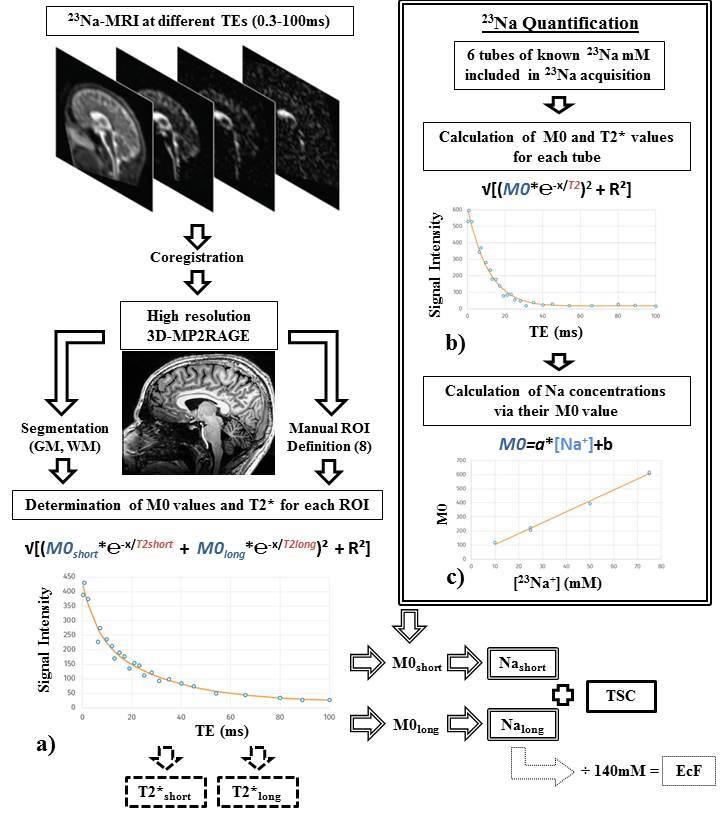
23Na-MRI from 13 healthy subjects was acquired at 7T using a multi-echo (24 TEs, 0.3 ms-100 ms (Figure 1)) density adapted 3D projection reconstruction pulse sequence (TR=120 ms, 10000 spokes, 3.5mm3 resolution, 60 mins). Six tubes of 2% agar gel doped with a range of sodium concentrations (10-75 mM) were arrayed in the FOV. A high-resolution 1H MRI 3D-MP2RAGE (TR=5000ms / TE=3ms / TI1=900ms / TI2=2750ms, 256 slices, 0.6mm3 isotropic resolution, 10 mins) was was used to define subject masks for GM, WM (SPM12, 0.9 tissue probability threshold) and 8 manually-defined regional ROIs (FSL 6.0). A biexponential fitting procedure was applied to the images of different TE derived from each individual to obtain T2*short and T2*long relaxation times for each ROI (Figure 2a). We measured M0 and the time of transverse relaxation (T2*) for a given reference tube across the 24 TEs, through monoexponential fitting via MATLAB (R2012a, MathWorks), and modelled a linear relationship between obtained M0 and known concentrations across all tubes (Figure 2b,c). Applying this to parameters estimated from the biexponential model of in vivo data, yielded quantitative estimates (Nashort and Nalong) for each brain ROI. To permit literature comparisons, total sodium concentrations (TSC) and extracellular fractions (EcF) were also calculated. Two ANOVAs (JMP v.9) were applied to investigate factors of interest Tissue Type (2 levels: GM, WM) and Region (8 levels), in addition to Sex and Age. Factors of interest were further investigated via non-parametric Steel-Dwass tests.Results
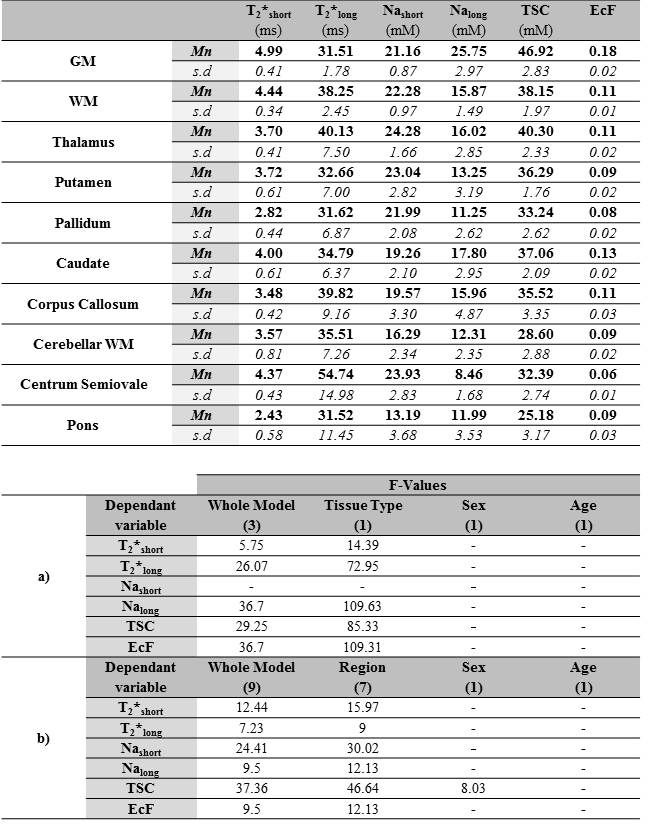
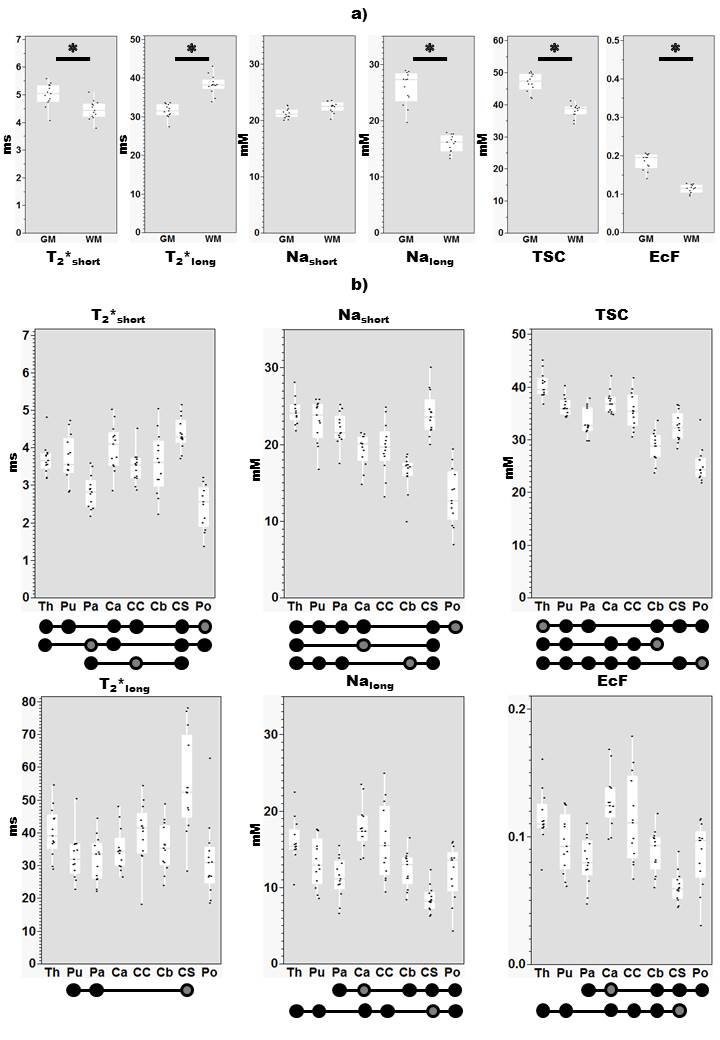
See Figure 3 for mean estimates of each parameter. Effect of Tissue type was significant for all parameters except Nashort (Figure 3, bottom), while post-hoc tests (Figure 4a) reveal relative levels GM>WM for Nalong, T2*short, EcF and TSC and WM>GM for T2*long. Effect of Region was significant for all parameters, and a significant effect of Sex was also observed for TSC. Overall, post-hoc (Figure 4b) tests revealed substantial variation for each parameter between subcortical regions, in addition to wide distributions between subjects for certain structures (especially centrum semiovale and corpus callosum (CC)) for certain parameters (T2*long, EcF).Discussion
The current data suggest that GM & WM give rise to different time constants of decay, which, given regional variation, may reflect the influence of tissue composition on observed relaxation. This would be consistent with observed differences in relative fluid content6–8 and tissue density including the distribution, relative density and structure of neuronal and glial subtypes9–12 influencing the volume of intra-/extracellular spaces13. For example, a restricted sodium pool determined mainly by the highly anisotropic14 axonal environment and small-bodied15 oligodendrocytes, versus a wider variety of cellular environments in GM, could lead to shorter estimates of T2*short in WM and in axon/myelin-rich structures such as the pallidum, pons or CC. Consistency with previous estimates of EcF and TSC in GM vs WM and various regions16–19 in controls samples, as well as ‘bound’ sodium estimates via 23Na-MRI IR at 3T20,21 and MQF at 7T22,23, suggests that the current methods appropriately characterize the compartmental and overall 23Na signal. Crucially, the current methods achieve this without a high SNR penalty and permit quantification.Conclusion
We provide the first 23Na-MRI data to address regional variation in T2*short at UHF, and to quantify the 23Na concentrations associated with short and long components. This provides a foundation for investigating alterations due to disease processes and the factors underlying normal ionic homeostatic mechanisms as imaged by 23Na-MRI.Acknowledgements
This work was supported by the ANR grant ‘NEUROintraSOD-7T’.References
1. Thulborn, K. R. Quantitative Sodium MR Imaging: A Review of its Evolving Role in Medicine. NeuroImage (2016). doi:10.1016/j.neuroimage.2016.11.056
2. Bartha, R. & Menon, R. S. Long component time constant of 23Na T*2 relaxation in healthy human brain. Magn. Reson. Med. 52, 407–410 (2004).
3. Fleysher, L., Oesingmann, N., Stoeckel, B., Grossman, R. I. & Inglese, M. Sodium long-component T(2)(*) mapping in human brain at 7 Tesla. Magn. Reson. Med. 62, 1338–1341 (2009).
4. Nagel, A. M. et al. The potential of relaxation-weighted sodium magnetic resonance imaging as demonstrated on brain tumors. Invest. Radiol. 46, 539–547 (2011).
5. Blunck, Y. et al. 3D-multi-echo radial imaging of (23) Na (3D-MERINA) for time-efficient multi-parameter tissue compartment mapping. Magn. Reson. Med. (2017). doi:10.1002/mrm.26848
6. Koessler, L. et al. In-vivo measurements of human brain tissue conductivity using focal electrical current injection through intracerebral multicontact electrodes. Hum. Brain Mapp. 38, 974–986 (2017).
7. Gelman, N., Ewing, J. R., Gorell, J. M., Spickler, E. M. & Solomon, E. G. Interregional variation of longitudinal relaxation rates in human brain at 3.0 T: relation to estimated iron and water contents. Magn. Reson. Med. 45, 71–79 (2001).
8. Krebs, N. et al. Assessment of trace elements in human brain using inductively coupled plasma mass spectrometry. J. Trace Elem. Med. Biol. Organ Soc. Miner. Trace Elem. GMS 28, 1–7 (2014).
9. von Bartheld, C. S., Bahney, J. & Herculano-Houzel, S. The search for true numbers of neurons and glial cells in the human brain: A review of 150 years of cell counting. J. Comp. Neurol. 524, 3865–3895 (2016).
10. Mota, B. & Herculano-Houzel, S. All brains are made of this: a fundamental building block of brain matter with matching neuronal and glial masses. Front. Neuroanat. 8, 127 (2014).
11. Herculano-Houzel, S. The glia/neuron ratio: how it varies uniformly across brain structures and species and what that means for brain physiology and evolution. Glia 62, 1377–1391 (2014).
12. Azevedo, F. A. C. et al. Equal numbers of neuronal and nonneuronal cells make the human brain an isometrically scaled-up primate brain. J. Comp. Neurol. 513, 532–541 (2009).
13. Syková, E. & Nicholson, C. Diffusion in brain extracellular space. Physiol. Rev. 88, 1277–1340 (2008).
14. Assaf, Y. & Pasternak, O. Diffusion tensor imaging (DTI)-based white matter mapping in brain research: a review. J. Mol. Neurosci. MN 34, 51–61 (2008).
15. Pelvig, D. P., Pakkenberg, H., Stark, A. K. & Pakkenberg, B. Neocortical glial cell numbers in human brains. Neurobiol. Aging 29, 1754–1762 (2008).
16. Madelin, G., Lee, J.-S., Regatte, R. R. & Jerschow, A. Sodium MRI: methods and applications. Prog. Nucl. Magn. Reson. Spectrosc. 79, 14–47 (2014).
17. Inglese, M. et al. Brain tissue sodium concentration in multiple sclerosis: a sodium imaging study at 3 tesla. Brain J. Neurol. 133, 847–857 (2010).
18. Reetz, K. et al. Increased brain tissue sodium concentration in Huntington’s Disease - a sodium imaging study at 4 T. NeuroImage 63, 517–524 (2012).
19. Zaaraoui, W. et al. Distribution of brain sodium accumulation correlates with disability in multiple sclerosis: a cross-sectional 23Na MR imaging study. Radiology 264, 859–867 (2012).
20. Madelin, G., Kline, R., Walvick, R. & Regatte, R. R. A method for estimating intracellular sodium concentration and extracellular volume fraction in brain in vivo using sodium magnetic resonance imaging. Sci. Rep. 4, 4763 (2014).
21. Madelin, G., Babb, J., Xia, D. & Regatte, R. R. Repeatability of quantitative sodium magnetic resonance imaging for estimating pseudo-intracellular sodium concentration and pseudo-extracellular volume fraction in brain at 3 T. PloS One 10, e0118692 (2015).
22. Petracca, M. et al. Brain intra- and extracellular sodium concentration in multiple sclerosis: a 7 T MRI study. Brain J. Neurol. 139, 795–806 (2016).
23. Fleysher, L. et al. Noninvasive quantification of intracellular sodium in human brain using ultrahigh-field MRI. NMR Biomed. 26, 9–19 (2013).
Figures