0584
Interpreting fast and slow 23Na relaxation rates in human brain: comparisons with tissue microstructure at 7 Tesla.1University of Melbourne, Melbourne, Australia
Synopsis
23Na, a quadrupolar nucleus, exhibits bi-exponential relaxation in brain tissue. This study aimed to compare fast and slow sodium T2* relaxation times obtained using a 3D multi-echo radial sequence, to measures of tissue microstructure derived from advanced diffusion MRI and proton T1 mapping at 7T. We observed significant correlations between sodium T2* relaxation times and all measures of fibre and cellular density and T1. The results suggest that relative contribution of quadrupolar and dipolar relaxation pathways are related to the underlying tissue microstructure.
Introduction
Changes in intra-cellular sodium in the brain may be a marker for pathophysiology2. Sodium MR relaxation can potentially provide information regarding changes in intra-cellular sodium. In anisotropic tissue environments (e.g. white matter), alignment of structures and local electric fields lead to bi-exponential signal decay (fast and slow T2*). Recent advances in multi-echo Na acquisition schemes now enable quantitative sodium relaxometry1. Exploration of the relationships between fast and slow sodium relaxation and tissue microstructural properties using more established techniques has yet to be performed. This study aimed to compare fast and slow T2* sodium relaxation rates to advanced diffusion MRI microstructural parameters and T1 mapping in six healthy human subjects.Methods
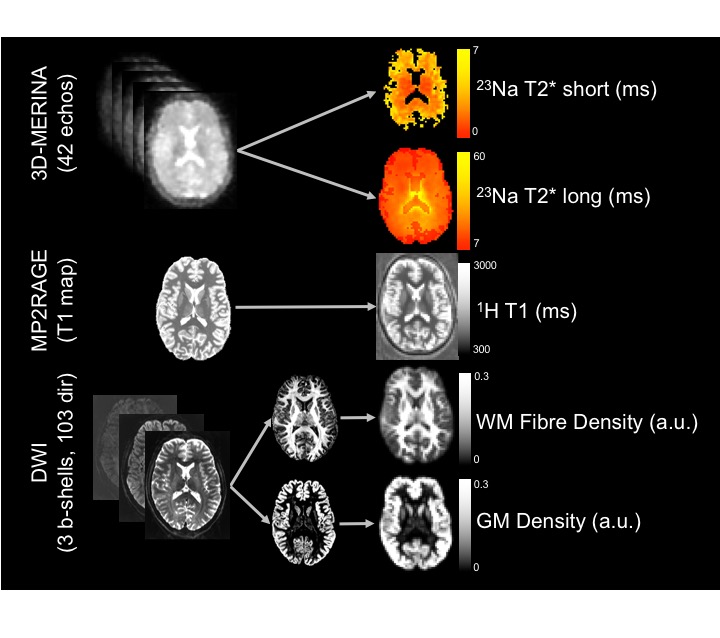
Subjects were imaged using a 7T MRI scanner (Siemens Healthcare, Erlangen, Germany) with a single channel 23Na head coil (QED, Mayfield Village, Ohio USA) and a 32-channel 1H head coil (Nova Medical, MA, USA). Figure 1 summarises image acquisition and analysis. Sequences included: (a) 3D multi-echo radial UTE sequence (3D-MERINA)1, (b) MP2RAGE (1mm3 isotropic resolution), and (c) multi-shell diffusion weighted sequence based on Vu et al.3 (b=0/1000/2000/3000s/mm2, 103 directions, 1.25mm3 isotropic resolution). Raw multi-echo sodium data was reconstructed to 3.15mm3 isotropic Cartesian voxels and fitted with a bi-exponential signal model accounting for Rician noise1. MP2RAGE T1 maps were affine registered to sodium4. Raw DWI data was processed using MRtrix 3.0 and multi-shell multi-tissue constrained spherical deconvolution (MSMT-CSD)5 to obtain maps of white matter (WM) fibre density and grey matter (GM) density. B0 scans were affine registered to sodium4. Sodium fast and slow T2* values were compared voxelwise to diffusion and proton T1 maps using linear regression analysis.Results
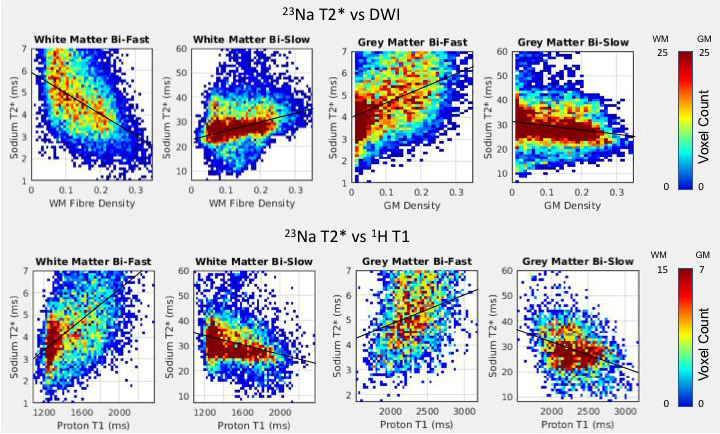
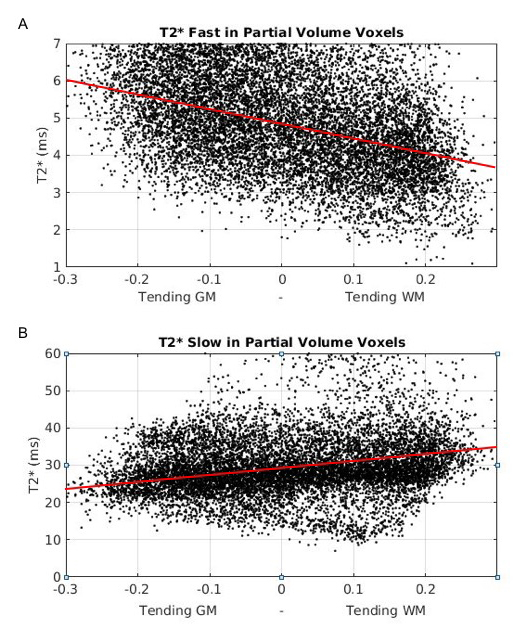
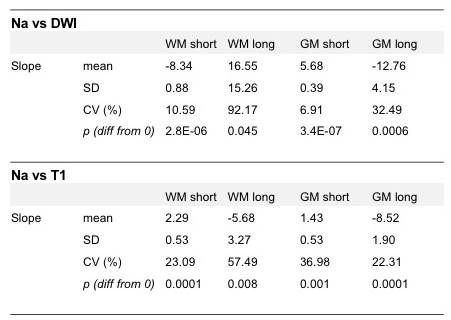
Mean±SD fast and slow T2* rates across WM and GM were assessed across participants: T2* fast WM = 4.20±0.72ms; T2* fast GM = 4.32±0.74ms; T2* slow WM = 29.50±1.24ms; T2* slow GM = 29.32±1.15ms. Relationships between sodium T2* relaxation rates and WM and GM microstructural properties were assessed within subjects (Fig. 2). In WM, fast T2* was lower in regions of high fibre density and low T1. Slow T2* was higher in voxels with higher fibre density and lower T1. In GM, fast T2* was higher in voxels of high GM density and high T1. Slow T2* was lower in voxels with higher GM density and higher T1. Table 1 shows inter-subject variation in regression slopes. In voxels containing partial volume of both WM and GM T2* rates were dependent on partial volume (Fig. 3) (mean±SD regression slopes across subjects for fast T2* vs partial volume = -3.76±0.21; for slow T2* = 7.15±4.53).Conclusions
Variations in fast and slow sodium relaxation constants are attributable to underlying tissue microstructure. Fast T2* relaxation is associated with axonal fibre density in WM reflecting the greater density of anisotropic structures in the local molecular environment. Increasing Slow T2* rates in more dense WM could reflect less mixing of intra- and extra-cellular pools across heavily myelinated axons. Future work will explore these relationships further in pathological brain tissue.Acknowledgements
This work was supported by Melbourne Neuroscience Institute, University of Melbourne. We acknowledge the facilities, and the scientific and technical assistance of the Australian National Imaging Facility at the Melbourne Brain Centre Imaging Unit. The Australian National Imaging Facility is funded by the Australian Government NCRIS program. The work was also supported by a research collaboration agreement with Siemens Healthcare. The MP2RAGE data was acquired with a prototype sequence provided by Siemens Healthcare.References
1. Blunck Y, Josan S, Taqdees SW, et al. 3D-multi-echo radial imaging of 23 Na (3D-MERINA) for time-efficient multi-parameter tissue compartment mapping. Magn Reson Med. 2017 Jul 28.
2. Shah NJ, Worthoff WA, Langen KJ. Imaging of sodium in the brain: a brief review. NMR Biomed. 2016 Feb;29(2):162-74.
3. Vu AT, Auerbach E, Lenglet C, et al. High resolution whole brain diffusion imaging at 7T for the Human Connectome Project. Neuroimage. 2015 Nov 15;122:318-31.
4. Jenkinson M, Bannister P, Brady M, Smith S. Improved optimization for the robust and accurate linear registration and motion correction of brain images. Neuroimage. 2002 Oct;17(2):825-41.
5. Jeurissen B, Tournier JD, Dhollander T, Connelly A, Sijbers J. Multi-tissue constrained spherical deconvolution for improved analysis of multi-shell diffusion MRI data. Neuroimage. 2014 Dec;103:411-26.
Figures