0583
$$$^{31}$$$P MRSI of asymptomatic C9orf72 carriers and non-carriers at 7 Tesla1Department of Translational Research and New Technologies in Medicine and Surgery, University of Pisa, Pisa, Italy, 2Radiology/Centre for Image Sciences, University Medical Centre Utrecht, Utrecht, Netherlands, 3Neurology, Brain Center Rudolf Magnus, University Medical Centre Utrecht, Utrecht, Netherlands
Synopsis
Amyotrophic Lateral Sclerosis (ALS) is a progressive neurodegenerative disease with a largely unknown pathogenesis. The most common gene mutation in both familial and sporadic ALS is the C9orf72 repeat expansion. Investigating asymptomatic carriers of this mutation might give more insight into possible preclinical brain alterations. Using whole brain 31P MRSI at 7T, glycerophosphoethanolamine-to-phosphocreatine ratio (GPE/PCr) and uridine diphosphoglucose-to-phosphocreatine ratio (UDPG/PCr) were found to be higher in a number of brain regions in asymptomatic carriers compared with asymptomatic non-carriers. The increased GPE/PCr and UDPG/PCR might respectively indicate an increased catabolism of the cell membranes and an imbalance of energy metabolism.
Introduction
Amyotrophic Lateral Sclerosis (ALS) is a fatal neurological disease characterised by upper and lower motor neuron degeneration and highly heterogeneous clinical presentation1. The pathogenesis of the disease is still largely unknown, making the development of disease-modifying therapies difficult. It is generally accepted that ALS is a complex disease caused by both genetic and environmental factors in a multistep fashion2. The hexanucleotide repeat expansion in the C9orf72 gene is the most common mutation in both familial and sporadic ALS, whilst rare in the healthy population without a family history of ALS or frontotemporal dementia (FTD)3. Asymptomatic carriers were recently shown to have morphometric and metabolic brain alterations compared to non-carriers4,5. Based on these premises, asymptomatic carriers are the ideal population to investigate pre-symptomatic metabolic changes in the brain. The goal of this study is to investigate the phospholipid and energy metabolism in asymptomatic C9orf72 repeat expansion carriers and non-carriers using 31P MRSI.Methods
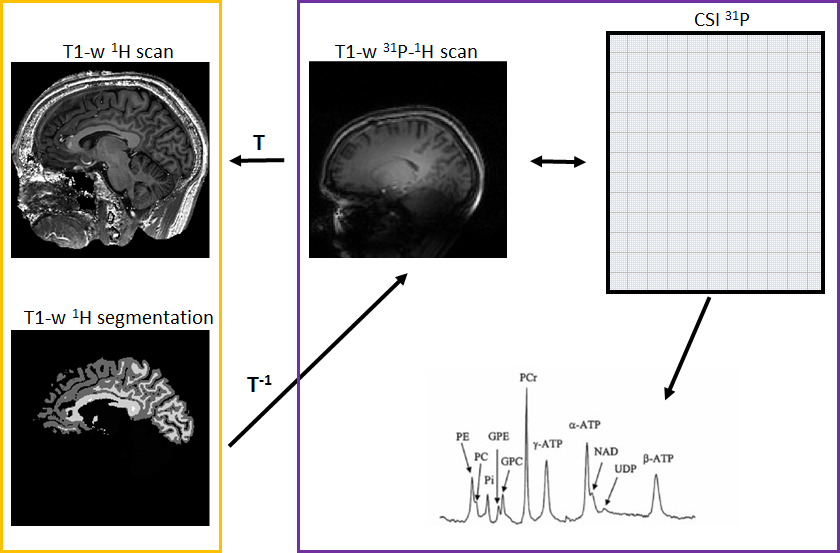
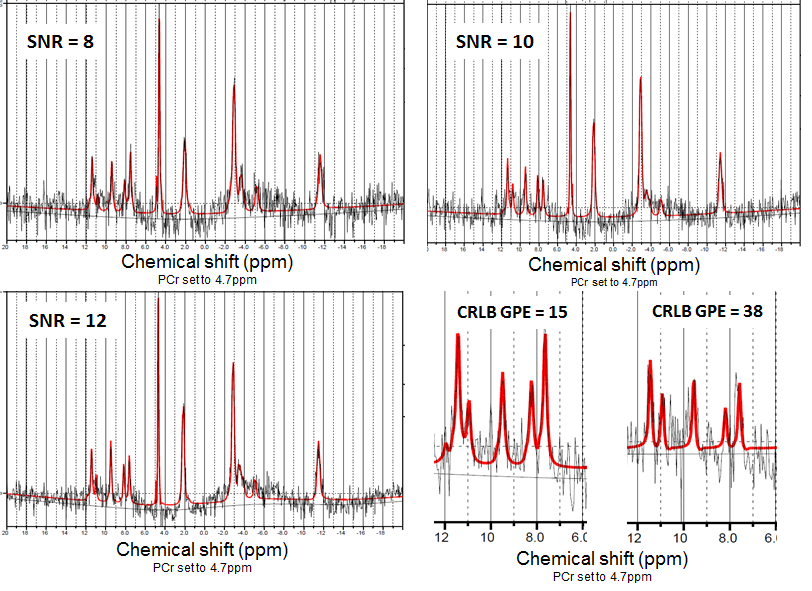
We enrolled 11 C9orf72 expansion carriers and 14 non-carriers from the same large family with a history of ALS. Each subject underwent MR examination of the brain using a 7 Tesla Philips Achieva System. Three sets of data were acquired per subject: i) a whole brain high-resolution T1-weighted sequence (spatial resolution = 1x1x1 mm3) using a 1H quadrature head coil with 32 receive channels (Nova), ii) a low-resolution T1-weighted scan and iii) a whole brain 31P MRSI (pulse acquire MRSI, TR 100ms, flip angle 15o, voxel size = 21.36x21.36x21mm3) using a home-build 31P-1H double tuned quadrature head coil. To compare the metabolic profile of different brain regions between carriers and non-carriers, the high-resolution T1-weighted scans were segmented using FreeSurfer (http://surfer.nmr.mgh.harvard.edu/) and linearly registered to the low-resolution T1-weighted scan using FSL (FMRIB, Oxford, UK) (Fig.1). Seventeen brain regions were investigated: corpus callosum, left and right centrum semiovale, white matter of the left and right frontal, parietal, temporal, insular and occipital lobes, white matter of the left and right cingulum, left and right basal ganglia. MRSI data was hamming filtered and subsequently fitted using LCModel6 and linearly registered to segmented T1 data. Quality control of the spectra was performed for each region of interest, and only spectra with SNR ≥ 10 and FWHM ≤ 0.155 ppm were selected. In these spectra, only metabolites with Cramér-Rao lower bounds ≤ 15% were used for further analysis (Fig.2). The ratios of the metabolites adenosine triphosphate (ATP), glycerophosphocholine (GPC), glycerophosphoethanolamine (GPE), phosphoethanolamine (PE), inorganic phosphate (Pi) and uridine diphosphoglucose (UDPG) to phosphocreatine (PCr) were investigated. These ratios were compared between groups with linear mixed models, using age and gender as covariates and kinship as random effect to incorporate dependencies within the pedigree. Results were weighted for proportion of the ROI within each MRSI voxel. Bootstrapping (1000 simulations) was used to determine 95% confidence intervals and p-values. Results were corrected for multiple testing by false discovery rate, and adjusted p-values <0.05 were considered statistically significant.Results
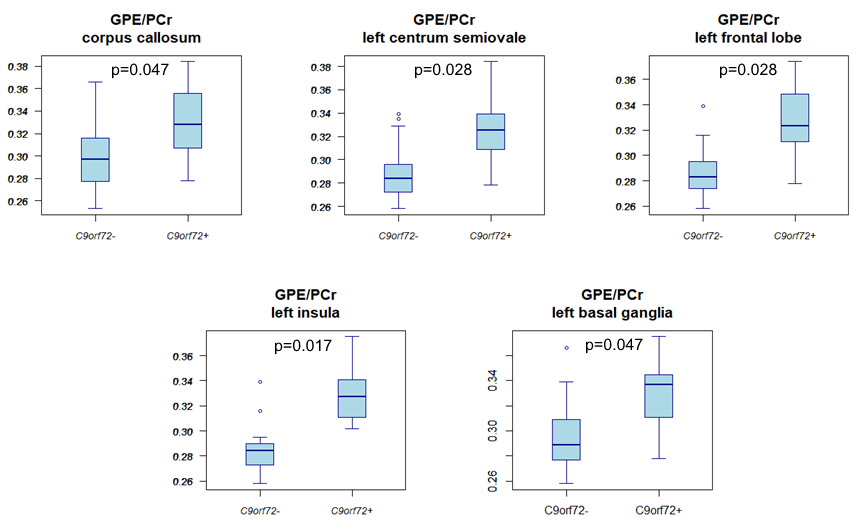
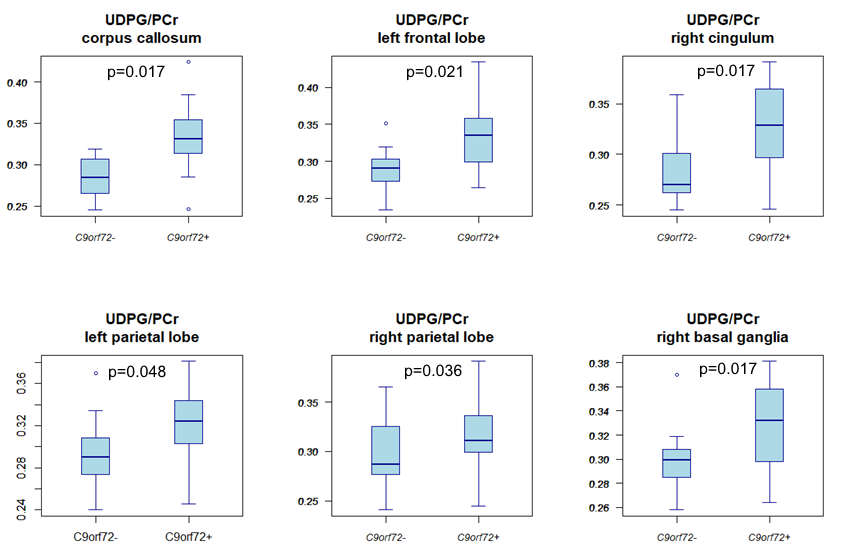
Compared to non-carriers, carriers showed a higher GPE/PCr ratio in the corpus callosum, left centrum semiovale, left frontal and insular lobe white matter, and the left basal ganglia (Fig.3). Carriers also had a higher UDPG/PCr ratio in the corpus callosum, the white matter of the left frontal lobe, left and right parietal lobes and right cingulum, right centrum semiovale, and in the right basal ganglia (Fig.4).Discussion
The present study showed significant differences in GPE/PCr and UDPG/PCr between asymptomatic carriers and non-carriers in multiple brain regions that were previously reported to be related to the C9orf72 repeat expansion4. Based on the physiological role of GPE, that represents one of the cell membrane degradation products, we could hypothesize that the increased level of this metabolite ratio in carriers is the consequence of an increased cell membrane catabolism. UDPG, which is a precursor of glycogen, was increased in carriers and because of its role in energy homeostasis, might reflect an increased metabolism in carriers. Although other hypothesis might be possible as well, the increased metabolism in carriers is in accordance with previous findings of increased glutamate concentration in asymptomatic carriers5.Conclusion
The presented results suggest an increased cell membrane breakdown in the brain tissue of asymptomatic C9orf72 expansion carriers, and possibly an increased energy metabolism.Acknowledgements
No acknowledgement found.References
1. Kiernan MC, Vucic S, Cheah BC, et al. Amyotrophic lateral sclerosis. Lancet 2011;377(9769):942-955.
2. Al-Chalabi A, Calvo A, Chio A, et al. Analysis of amyotrophic lateral sclerosis as a multistep process: a population-based modelling study. Lancet Neurol. 2014 Nov;13(11):1108-1113
3. Majounie E, Renton AE, Mok K, et al. Frequency of the C9orf72 hexanucleotide repeat expansion in patients with amyotrophic lateral sclerosis and frontotemporal dementia: a cross-sectional study. Lancet Neurol. 2012 Apr;11(4):323-330.
4. Walhout R, Schmidt R, Westeneng HJ, et al. Brain morphologic changes in asymptomatic C9orf72 repeat expansion carriers. Neurology. 2015 Nov 17;85(20):1780-1788.
5. Westeneng HJ, Wismans C, Nitert AD, et al. Metabolic differences between asymptomatic C9orf72 carriers and non-carriers assessed by brain 7T MRSI. In Proceedings of the 25th Annual Meeting of the International Society for Magnetic Resonance in Medicine (ISMRM), Honolulu, Hawaii, USA, April 2017.
6. Provencher SW. Automatic quantitation of localized in vivo 1H spectra with LCModel. NMR Biomed. 2001; 14(4): 260-4.
Figures