0581
Ultra-high resolution MR spectroscopic imaging at 7 Tesla in Multiple Sclerosis: Initial results and comparison with clinical MR imaging1High-field MR Center, Department of Biomedical Imaging and Image-guided Therapy, Medical University of Vienna, Vienna, Austria, 2Christian Doppler Laboratory for Clinical Molecular MR Imaging, Vienna, Austria, 3Athinoula A. Martinos Center for Biomedical Imaging, Department of Radiology, Massachusetts General Hospital, Harvard Medical School, Boston, MA, United States, 4Center for Brain Research, Medical University of Vienna, Vienna, Austria, 5Russell H. Morgan Department of Radiology and Radiological Science, The Johns Hopkins University School of Medicine, Baltimore, MD, United States, 6F. M. Kirby Research Center for Functional Brain Imaging, Kennedy Krieger Institute, Baltimore, MD, United States, 7Comenius University in Bratislava, Martin, Slovakia, 8Department of Neurology, Medical University of Vienna, Vienna, Austria
Synopsis
Conventional T1/T2-weighted MRI has become indispensable for Multiple Sclerosis(MS) diagnosis and treatment monitoring, although it reflects only general macroscopic tissue damage. MRSI allows the additional mapping of pathological processes in MS on a biochemical level. In 39 relapsing-remitting MS patients and an age/sex-matched control group(n=10), we show that clinically feasible ultra-high resolution (100x100 matrix) FID-MRSI in ~6min reveals even well-delineated (sub-)cortical MS lesions down to ~3mm in regions inconspicuous on conventional MRI. Regions of mIns were often larger than on FLAIR and NAA maps, suggesting that mIns increase may be an earlier imaging biomarker for neuroinflammation/lesion development than conventional MRI.
Introduction
Conventional T1/T2-weighted MRI has become indispensable for Multiple Sclerosis(MS) diagnosis and treatment monitoring. While it is a well-accepted diagnostic tool in early stages of MS, it is unable to explain the severity and nature of many clinical signs and symptoms during progressive stages[1]. This is not surprising, considering that T2-lesions are only simple expressions of general macroscopic tissue damage.
MR spectroscopic imaging(MRSI) allows the mapping of pathological processes in MS on a biochemical level[2] Axonal loss/neuronal damage are reflected by decreased N-acetylaspartate(NAA), mitochondrial dysfunction by decreased creatine(Cr), and inflammation with subsequent glial activation by elevated myo-inositol(mIns), glutamine(Gln), Cr, and Cho. Increased glutathione(GSH) reflects oxidative stress. Demyelination processes lead to altered Cho, mobile macromolecules(MMs) and lipids(Lip), while increased glutamate(Glu) leads to excitotoxicity[2].
Despite this potential, early promises of MRS as a clinical tool remained largely unfulfilled due to technical limitations including (i) small VOI coverage(especially in SVS studies), (ii) low spatial resolution, (iii) low SNR(especially for J-coupled metabolites), and (iv) long scan times.
Recent progress in 7T MRSI development promises to overcome these limitations. Free induction decay (FID-)MRSI with matrix sizes of 100×100 provides high-resolution whole-brain slice mapping of 6-8 chemical compounds in clinically attractive ~6min[3,4].
The purpose of our study was to evaluate the clinical potential of ultra-high resolution FID-MRSI in relapsing-remitting MS(RRMS) as adjunct to conventional MRI.
Methods
39 RRMS patients(21 male/18 female; age 33±8years old), and a sex/age-matched group of 10 healthy controls(5 male/5 female, 33±9 years old) were scanned at 7T (Siemens, Erlangen, Germany).
FID-MRSI was performed with TR/TE* 200/1.3ms; FOV 220×220mm²; matrix size 100×100; 8mm slice thickness; 29° flip angle; 3kHz spectral bandwidth; 1024 samples; WET water suppression; 6-fold 2D-CAIPIRINHA acceleration; 6:06min scan time.
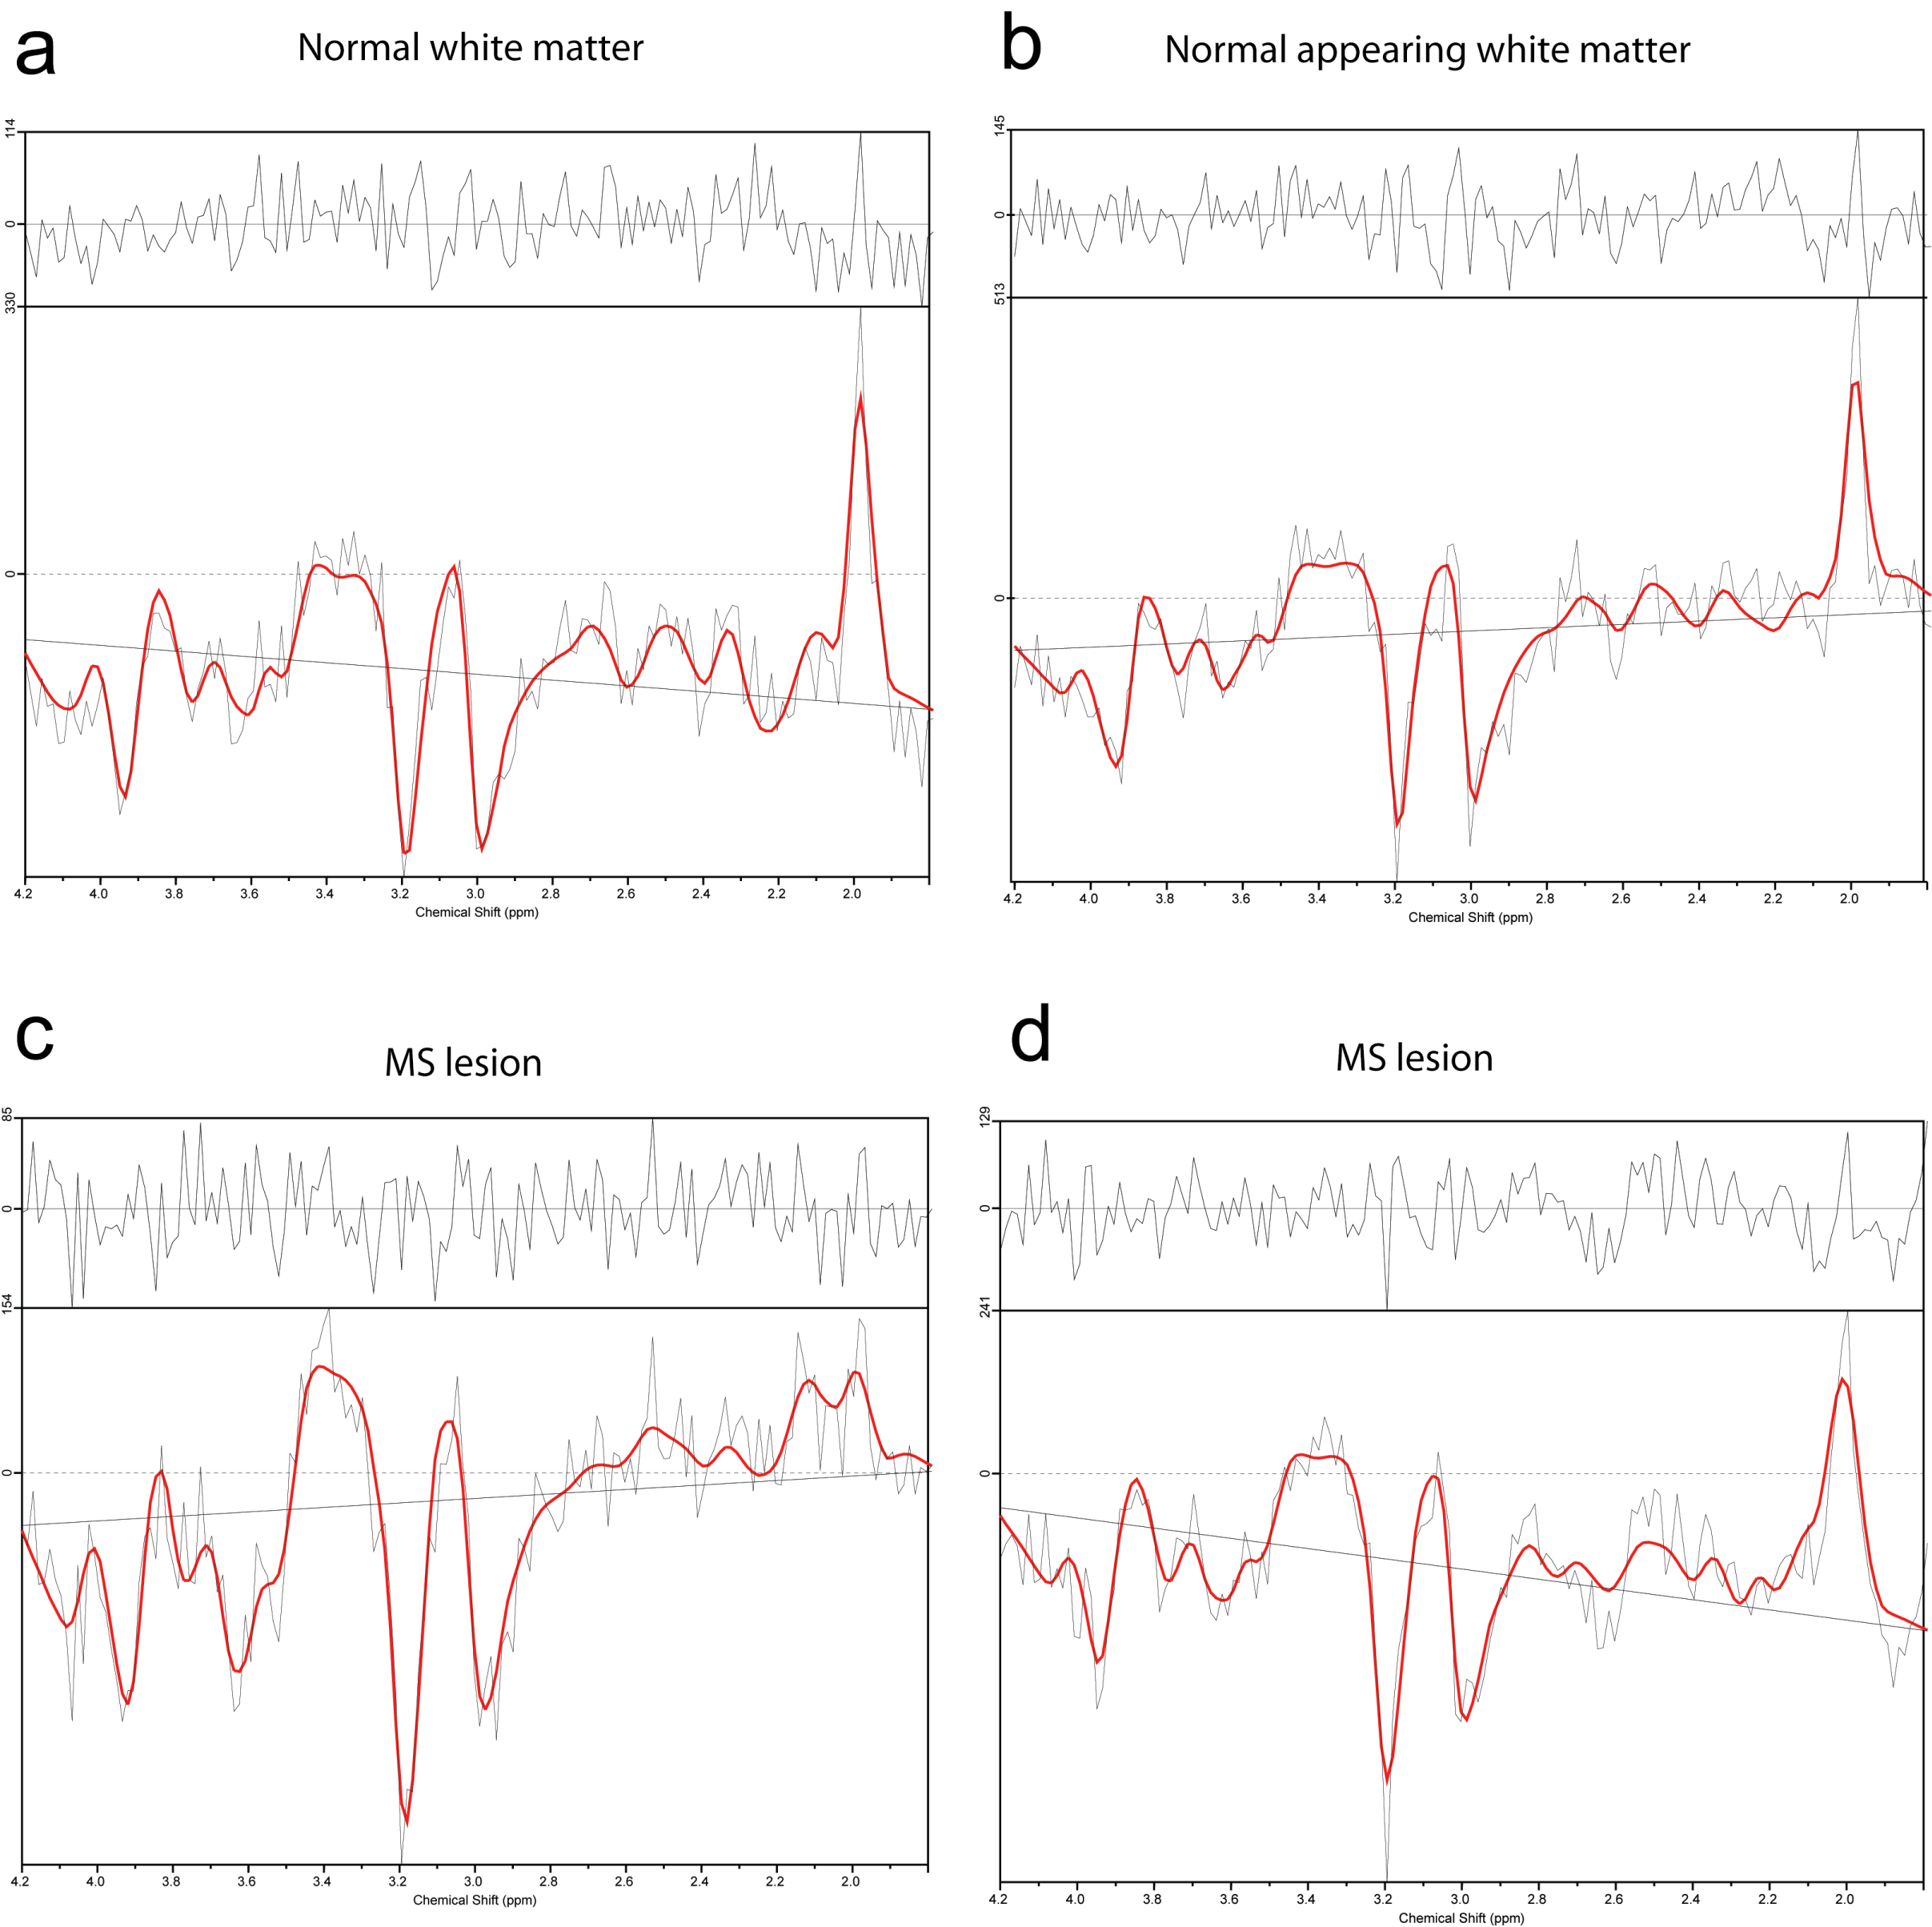
Automated MRSI data processing was performed via in-house-developed software. This included MUSICAL coil combination[5], 2D-CAIPIRINHA reconstruction[4], spatial Hamming filtering, and lipid removal via L2-regularisation[6]. The spectral range 1.8-4.0ppm was fitted via LCModel using a basis-set of 17 metabolites and a measured macromolecule background[7]. Maps of metabolites, spectral quality(linewidth, SNR), and quantification precision(Cramer-Rao Lower Bounds(CRLB)) were obtained.
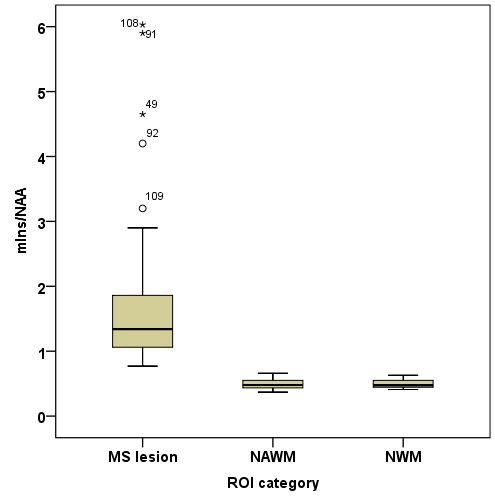
Routine 3D-MRI including T2-weighted FLAIR and T1-weighted MP(2)RAGE before and after contrast agent injection were additionally obtained. 3D-lesion-ROIs on metabolic maps were defined on mIns/NAA and Cho/NAA maps, while lesion-ROIs on FLAIR/MPRAGE and ROIs in normal appearing white matter (NAWM) of patients and normal white matter (NWM) of controls were defined manually using ITK-SNAP. The maximum metabolite ratio per ROI was determined.
Results
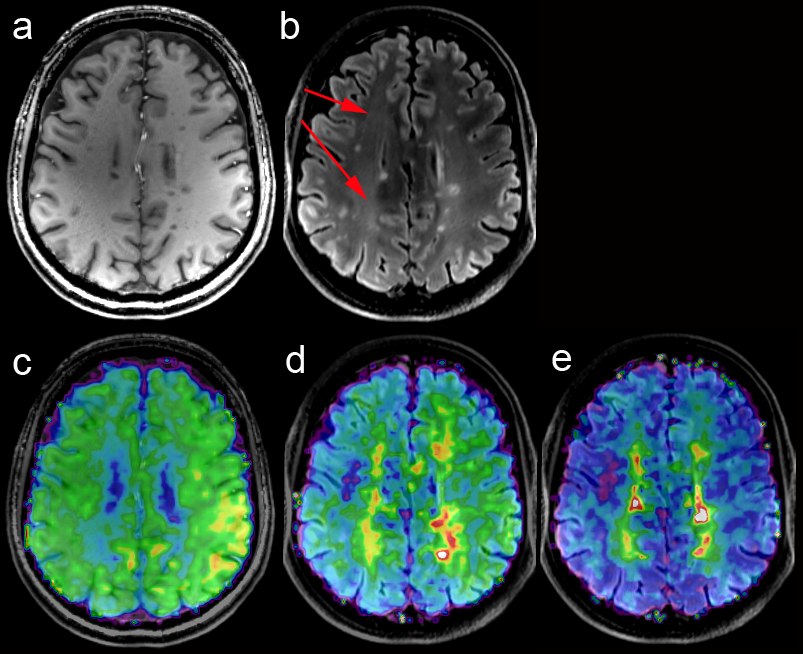
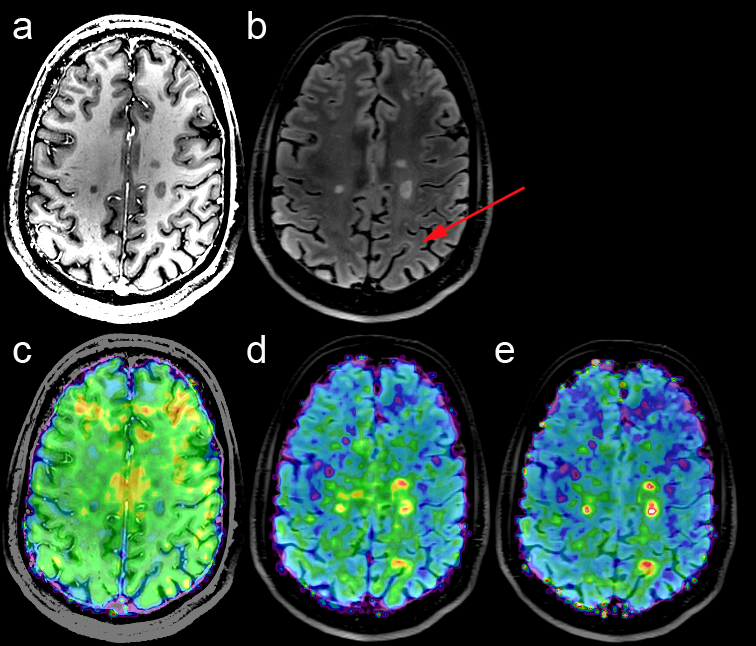
High quality metabolic maps of Cho, Cr, and mIns were obtained all patients(Figure 1). NAA maps were affected by strong lipid artefacts in 5 out of 39 cases. Thus, only MRSI data of 34 patients were further processed.In total there were 182 FLAIR-visible lesions in all investigated MRSI slices. In comparison there were ~20% more lesions identified based on mIns/NAA(Figure 2). Only few lesions showed increased Cho/NAA ratios. In ~23% of lesions mIns was increased without visible decrease in NAA(Figure 2,3). Even small lesions down to ~2-3mm diameter on FLAIR were successfully identified on mIns/NAA ratio maps(Figure 4). With +243% higher mIns/NAA in lesions than in NAWM/NWM (p<0.001), ROI-data analysis showed, mIns/NAA to be the best discriminator for MS abnormalities (Figure 5).Discussion
Clinically feasible ultra-high resolution FID-MRSI in ~6min shows not only diffuse changes, but also well-delineated MS lesions in NAWM distant to lesions visible on conventional MRI.
Combining the increased spatial and spectral resolution at 7T with the full sensitivity signal detection of FID-MRSI allowed mapping of a comprehensive neurochemical profile with ~2×2mm in-plane resolution. This included not only NAA, Cr, and Cho, but also mIns and Glu, which are critical to understand the complex biochemical underpinnings of MS[2].
Our results support previous MRS studies that found metabolic changes in NAWM of MS patients[8], but add two remarkable findings:
a) mIns increase may occur earlier than MRI visible changes and before NAA decrease, since regions of mIns were often larger than visible on FLAIR and NAA maps. This supports earlier reports suggesting that early increase in mIns is a sensitive imaging biomarker for neuroinflammation and could improve early diagnosis[9].
b) Changes in NAWM were less diffuse than expected[8]. Previous MRS studies of MS were biased by partial volume errors. Hence, smaller MS lesions(<1cm) couldn’t be well characterized and local mIns increases were blurred and underestimated. In our study, we were able to image even small (sub-)cortical lesions(diameter~2-3mm), which was previously impossible.
Conclusion
7T FID-MRSI may, thus, be a valuable addition to conventional MRI protocols that may open new possibilities in MS research via a comprehensive biochemical characterization of lesions and NAWMAcknowledgements
This study was supported by the Austrian Science Fund (FWF): P30701-B27 and KLI-646 as well as the FFG Bridge Early Stage Grant #846505.References
[1] Polman et al., Ann Neurol 2011; doi: 10.1002/ana.22366
[2] Saija et al., Neuroimaging Clin N.Am 2009; doi: 10.1016/j.nic.2008.08.002.
[3] Hangel et al., Neuroimage 2016 [Epub]; doi: 10.1016/j.neuroimage.2016.10.043
[4] Strasser et al., MRM 2017; doi: 10.1002/mrm.26386
[5] Strasser et al., NMR in Biomed 2013; 10.1002/nbm.3019
[6] Bilgic et al., JMRI 2014; doi: 10.1002/jmri.24365
[7] Povazan et al., Neuroimage 2015; doi: 10.1016/j.neuroimage.2015.07.042
[8] Fleischer et al., Radiology 2016 [EPub]; doi: 10.1148/radiol.2016151654
[9] Fernando et al., Brain 2004; doi: 10.1093/brain/awh153
Figures