0580
GABA concentration in sensorimotor area correlates with observed inhibitory response measured by magnetoencephalography.1Sir Peter Mansfield Imaging Centre, University of Nottingham, Nottingham, United Kingdom, 2School of Psychology, University of Nottingham, Nottingham, United Kingdom
Synopsis
Electrophysiological imaging suggests that task induced change in beta oscillations (13-30Hz) modulates with attention, and reflects synaptic inhibitory responses. GABA is known to mediate synaptic inhibition and hence may relate to these electrophysiological dynamics. Here, we determined GABA concentration in primary sensorimotor cortex, using MRS at 7T, and measured the electrophysiological response to a sensory attention task, using MEG, in the same region. We correlated the post-stimulus synchronisation in beta in the left sensory-motor cortex with GABA concentration detected using a STEAM sequence. Results show significant correlation (R = 0.48; p 0.010) across 28 participants.
Introduction
γ-aminobutyric acid (GABA) is well known as the major cortical inhibitory neurotransmitter. Neuronal inhibitory responses in the sensorimotor cortex have been hypothesised to relate to low frequency electrophysiological responses1 (beta band, 13-30Hz). In particular increases in alpha (8-13Hz) and beta (13-30Hz) power, immediately following the offset of stimulation, have been shown to be a marker of inhibition, and to vary with attention, in the visual and sensorimotor cortices. Here we report results of a study correlating resting GABA concentration and beta oscillatory modulation following tactile stimuli applied to the index fingers in an attentional task.Methods
29 volunteers were scanned using a 7T Philips Achieva MR system (with a 32-channel receive head coil and a volume transmit coil, B1max=15μT) and a CTF 275-channel MEG system. (24 participants had MEG and MRI on the same day; 5 within two days). One volunteer was excluded because their measured beta-power fell >3 SD from the mean. The remaining 28 volunteers were aged 24±3 years (13 male).MRS acquisition and analysis
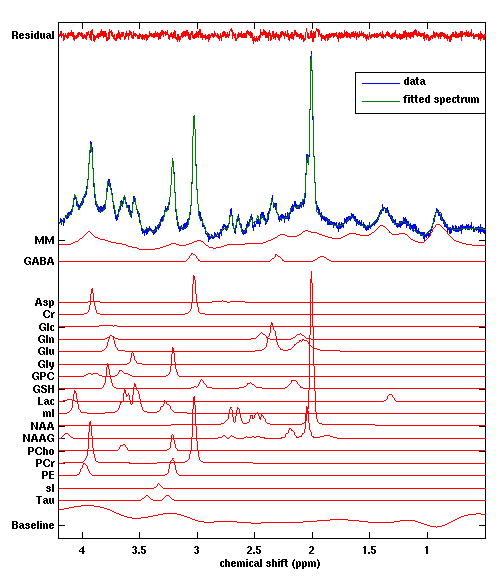
A 15x20x30mm3 voxel was placed around the central sulcus, and a STEAM sequence used to acquire MRS data (TE/TM/TR 14/15/2000ms for the first 13 participants and 17/15/2000ms for the rest; 4096 sample size, 4000Hz bandwidth). The voxel was placed by visual inspection of cortical anatomy, with the shim box including water to lipid/lactate chemical shift extrema. Four non-suppressed water reference spectra were acquired for phase and eddy current correction and absolute quantification using LCModel (20 individual metabolite components and simulated macromolecular baseline). A structural MPRAGE sequence (1 mm3 isotropic resolution, matrix size =256×256×180, TE/TR/TI =3.5/7.3/987 ms, FA =8°, shot interval =2 s, SENSE factor =2), was used for reference. Grey matter, white matter and CSF were segmented with SPM8 and tissue fractions within the voxel used for metabolite concentration correction 2.MEG stimulation paradigm and analysis
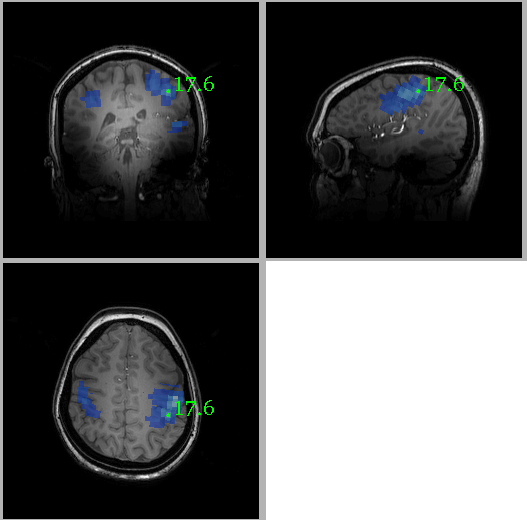
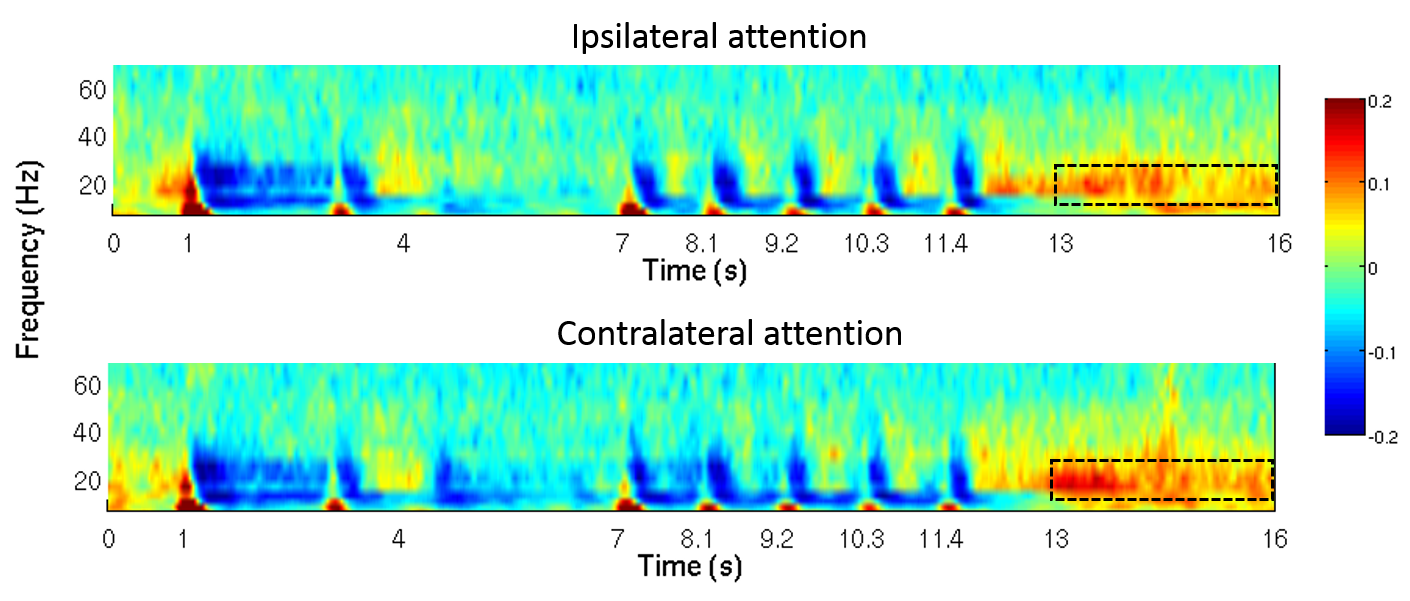
Somatosensory stimulation was achieved using two Braille cells (metec AG 3). Each cell comprised 8 pins (4x2 layout) which could be activated independently. The MEG paradigm consisted of 80, 16s trials: In the 1-3s time window a sample braille pattern was presented to the index fingers of both hands. In the 4-6s window, a visual cue indicated to which hand the subjects should pay attention. In the 7-12.5s window, 5 braille stimuli of 100ms, spaced 1s apart, were presented randomly to either hand. The subjects were asked to respond, via button press (with their thumb), if any braille pattern matched the sample pattern, at the attended hand. A rest period (13-16s window) at the end of each trial was used to measure the post stimulus beta effect (the beta rebound). Beta rebound was calculated as a fractional change from baseline, where baseline was defined using 8 rest trials, each 16s in length and interspersed (one every ten trials) among the task trials. MEG data were co-registered to individual anatomy and peak activation was found using a beamformer approach, computing the spatial signature of the maximum (peak to peak) fluctuation in beta amplitude. Following identification of the location of maximum beta fluctuation in the brain, the electrophysiological response, in the form of a time frequency spectrogram, was extracted from this location, again using a beamformer spatial filter. The mean beta amplitude in the 13-16s windows was extracted for each participant, plotted against GABA concentration and Pearson correlation coefficients determined.Results and discussion
Figure 1 shows the location of the MRS voxel in a typical subject. Note that it is centred on the post central gyrus. An individual spectrum, along with the fitted metabolites, is shown in Figure 2. The Cramer Rao lower bounds for GABA ranged 8-22% across subjects. Figures 3 and 4 show the localisation of maximum beta amplitude modulation in a single subject, and the mean (across subjects) time frequency spectrum respectively. In all subjects, peak beta modulation was confined to sensorimotor cortex. Note in the time frequency spectrogram that individual presentations of braille patterns can be clearly seen. The window of maximum beta rebound is marked. Individual GABA concentrations in the left sensorimotor-cortex were correlated to post-stimuli changes in beta power. Significant correlations were found for both attention cues: r=0.48, p-value 0.010 and r = 0.44, p-value 0.018 for contralateral and ipsilateral attention cues respectively. This demonstrated a clear relationship between GABA concentration and beta amplitude, with those subjects with more GABA exhibiting a larger beta rebound. Our finding adds weight to the argument that beta amplitude is a marker of inhibition. This will be of significant utility in the future interpretation of beta abnormalities in diseases such as schizophrenia 4, Parkinson’s disease 5 and Multiple Sclerosis 6.Acknowledgements
MRC and University of Nottingham
References
1. G. Gonzalez-Burgos, D.A. Lewis, GABA Neurons and the Mechanisms of Network Oscillations: Implications for Understanding Cortical Dysfunction in Schizophrenia. Schizophrenia Bulletin. 2008; 34(5): pp. 944-961.
2. A. Andreychenko, D.J. Klomp, R.A. de Graaf, P.R. Luijten, and V.O. Boer, In vivo GABA T2 determination with J-refocused echo time extension at 7T, NMR Biomed, 2013 (26), pp. 1596-1601.
3. P16 MEG compatible braille cells. http://web.metec-ag.de/braille%20cell%20p16.html
4. L. Timmermann, et al., The cerebral oscillatory network of Parkinsonian resting tremor. Brain:a journal of neurology. 2003 (126), pp. 199-212.
5. S.E. Robson, et al. Abnormal visuomotor processing in schizophrenia, NeuroImage:Clinical, 2016, (12), pp. 869-878
6. E.L. Barratt, et al. Abnormal task driven neural oscillations in multiple sclerosis: A visuomotor MEG study, Human Brain Mapping, 2017, (38.5), pp. 2441-2453.
Figures