0578
High-resolution T2*-weighted imaging of subcortical brain enhanced by motion and field compensation1Institute for Biomedical Engineering, ETH Zurich & University of Zurich, Zurich, Switzerland
Synopsis
We apply field control and prospective motion correction simultaneously to obtain a high-quality and high-resolution (0.3mm x 0.3mm x 1mm) T2* weighted depiction of subcortical brain structure which is a notoriously difficult region for T2* weighted scans at high field due to physiological field fluctuations. The combined approach of field control and motion correction achieved superior imaging results in the studied scenario.
Introduction
Structural MRI at high field holds the prospect of depicting brain anatomy with unprecedented detail and clarity. Subcortical structures, such as the brainstem, are associated with many vital physiological processes and are therefore of high relevance for many disorders and diseases. Imaging of tiny brain structures requires both a high imaging resolution and an appropriate contrast or a group of contrasts. T2* weighted imaging is a common contrast but is very sensitive to field fluctuations caused by subject breathing, an effect exacerbated at high-field1. Real-time field control has significantly improved image quality of scans with long echo time2. As motion correction was shown to be an effective method for high-resolution scans3,4, in recent work the approach of combining prospective motion correction (PMC) with dynamic field stabilization was pursued and improved high-resolution T2*-weighted images of upper brain regions were demonstrated5.
In this work, we report high-quality depictions of subcortical brain regions using an even higher-resolved one-hour T2* weighted scan (0.3x0.3x1mm³) achieved by applying the combined approach of field control and PMC. The subcortical regions are challenging for T2* contrasts since they are located in the lower part of the brain and are thus particularly affected by field fluctuations due to breathing.
Methods
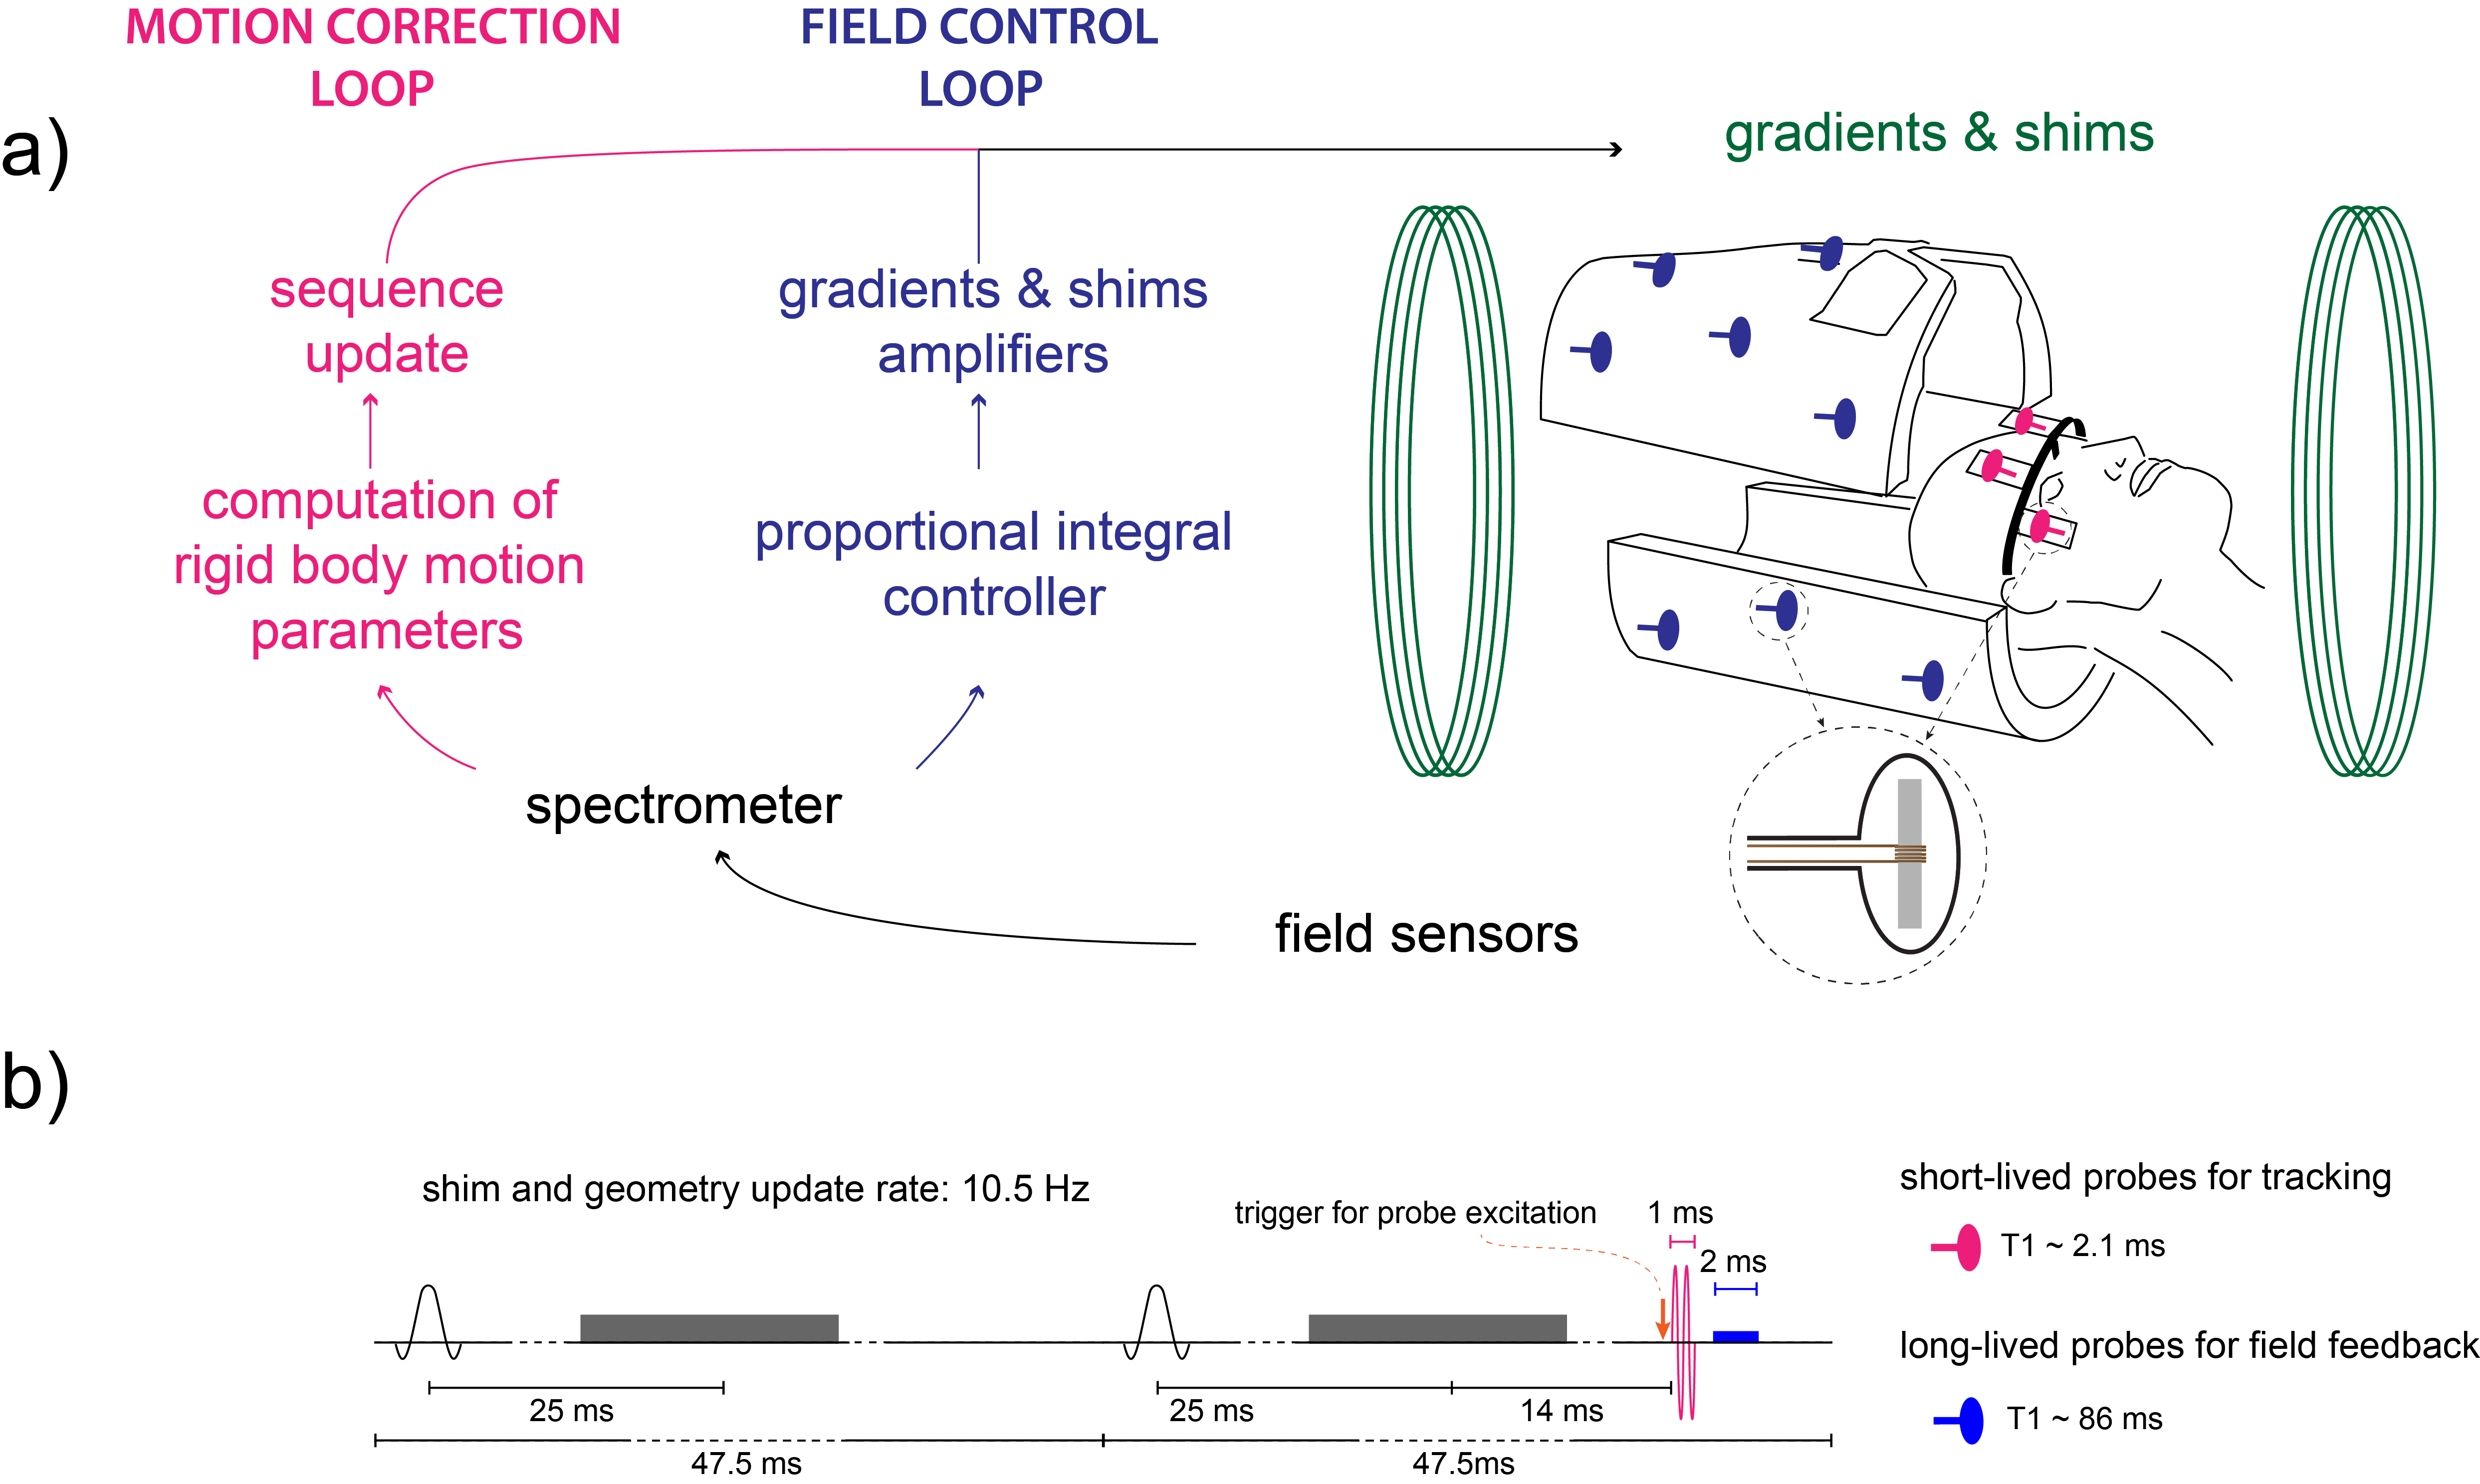
PMC and field control were carried out simultaneously using to different sets of 19F NMR field probes6 (Fig. 1a) operated using a stand-alone console7. An array of 16 long-lived field probes (T1=86ms) was used for field control2. Shim actuation using a proportional-integral controller was performed for up to 3rd order shims such that the baseline level was maintained. Four head mounted field probes (T1=2.1ms) were tracked using a slightly modified version of the gradient tone method8. Here, gradient tones were inserted into a part of the sequence without gradient activity (tones duration=1ms, amplitude=7mT/m, frequencies=[2;3;4] kHz). The integration of both methods was done similarly as described in [5] and illustrated in Fig. 1b. All probes were excited every other TR to ensure sufficient relaxation of the long-lived probes and thus both correction loops operated at a 10 Hz rate. While the tones present in the first millisecond of the acquired probe signal were used to localize the head-mounted probes, a 2ms interval starting 1ms upon completion of the tones was used for a static field measurement that served as input for shim actuation.
All scans were performed on a 7T Philips Achieva system (Philips Healthcare) with a 32-channel receive array (Nova Medical). A healthy subject was instructed to hold still throughout the scan (resolution=0.3x0.3x1mm³, FOV=[190x190x40] mm, 40 slices, TR/TE = 950/25 ms, 50° flip angle, 3 averages, total scan duration= 1:00 h).
Results
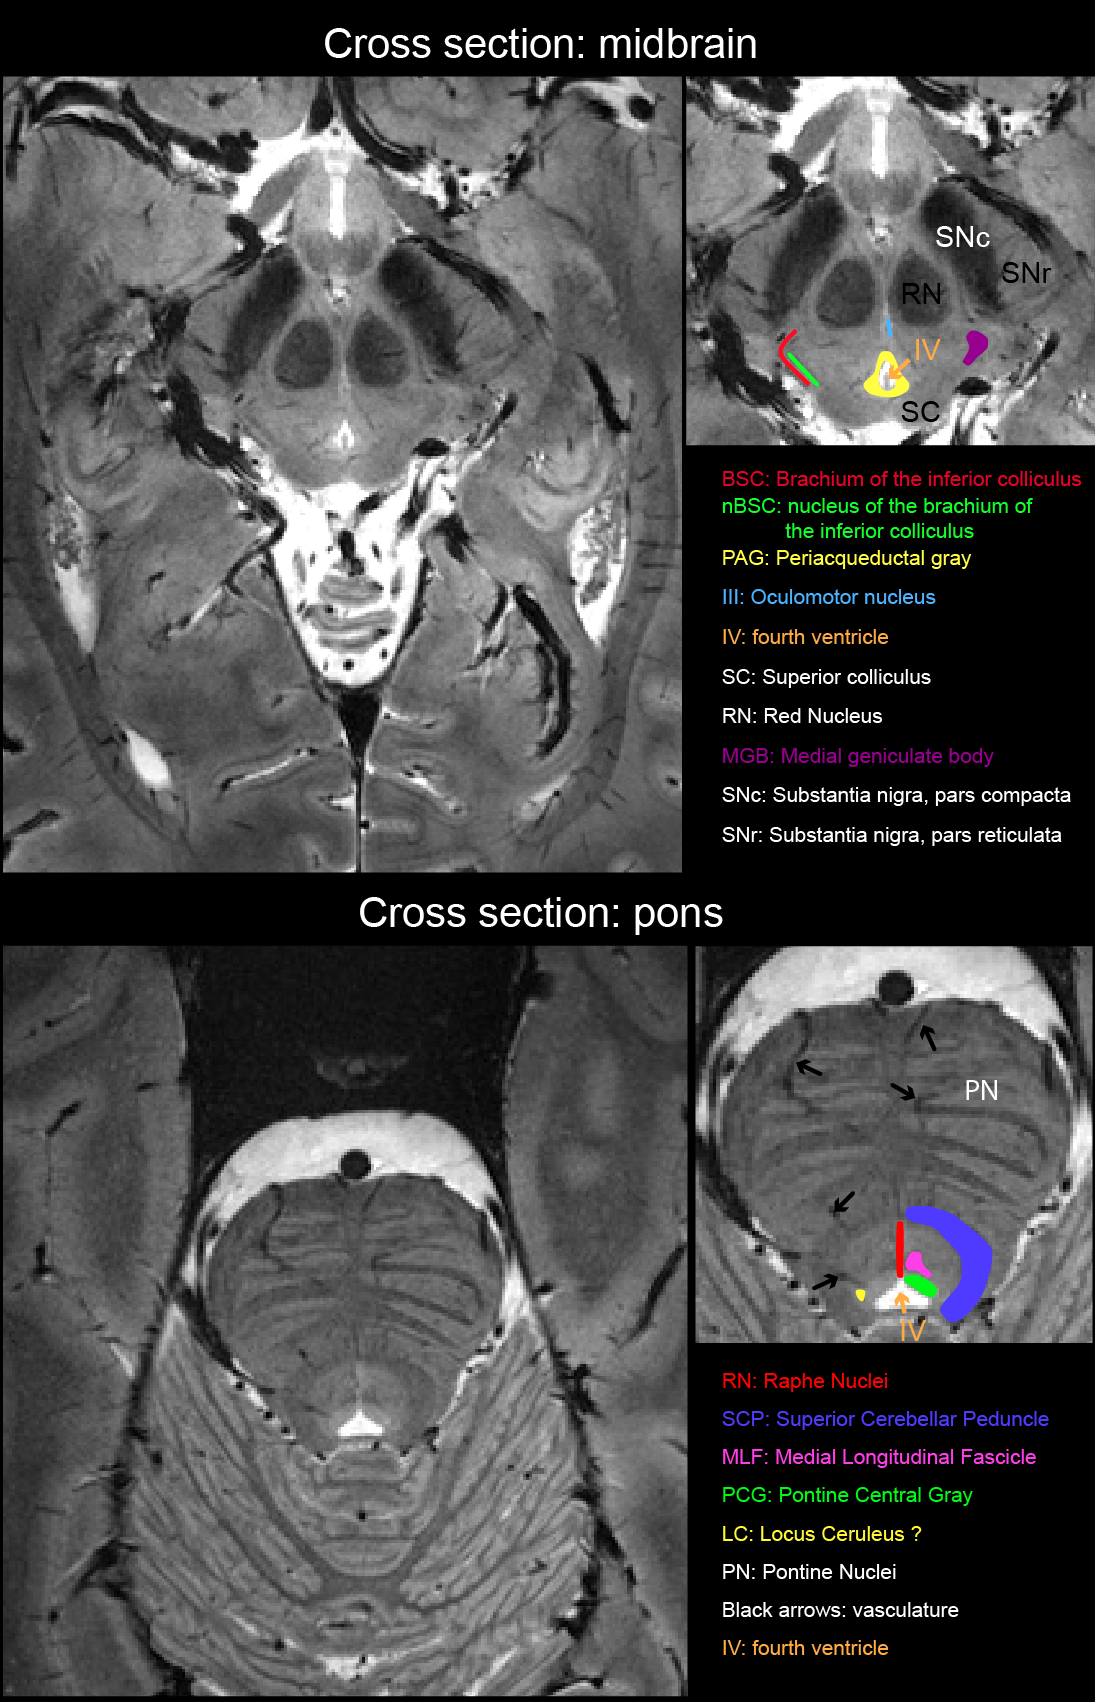
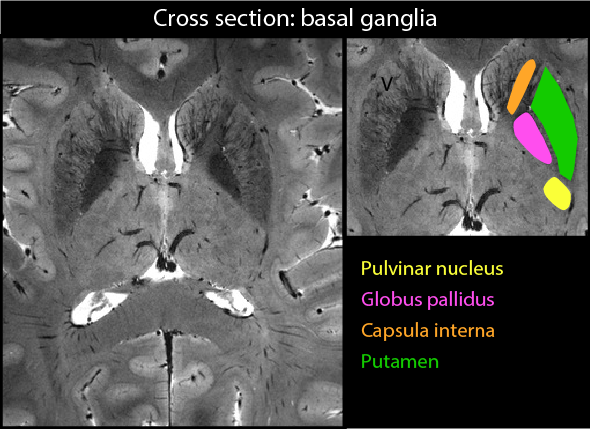
Subtle subject motion of up to 1 mm and 1.5° has occurred during the scan (Fig.2a) which corresponds to a significant tissue displacement with respect to the targeted voxel size. A 60-seconds excerpt of the applied field correction is shown in Fig. 2b and its correlation with the breathing cycle is clearly visible. Fig. 3 shows zoomed sections into transversal slices of the midbrain and the pons. A selection of labeled structures was added based on a reference post-mortem atlas9. Fig. 4 shows a zoomed view into a cross-section of the basal ganglia in which fine vessels are visible.
Conclusion
In this work we applied real-time field control and prospective motion correction simultaneously to achieve a high-resolution T2* weighted depiction of subcortical structures. The large amount of detailed structures visible in the zoomed sections testifies to the effectiveness of the employed methods. Both methods contributed to the high quality achieved in the resulting images. Without motion correction, tiny details tend to appear blurrier and field perturbations cause strong dark spots and cloud-like artefacts which could prevent the visualization of microstructure.Acknowledgements
We thank Dr. Paul Unschuld (University Hospital for Psychogeriatric Medicine, Zurich) for helpful discussions regarding neuroanatomy.References
1) Van de Moortele et al, MRM(2002)
2) Duerst et al, MRM(2014)
3) Federau et al, PLOSone(2016)
4) Stucht et al, PLOSone(2015)
5) Vionnet et al, ISMRM 2017, p.0306
6) Barmet et al, MRM(2008)
7) Dietrich et al, MRM(2016)
8) Haeberlin et al, MRM(2015)
9) Olszewski and Baxter's, Karger (2014)
Figures