0567
Assessment Pre- and Post-Ablation Energetics and Vortex Size Alterations of Left Atrial Hemodynamics in Patients with Paroxysmal Atrial Fibrillation: 4D flow MRI StudyJulio Garcia1, Mohammed S.M. Elbaz2, Carmen Lydell2, Andrew G. Howarth2, Frank S. Prato3, Maria Drangova3, Rebecca Thornhill4, Pablo Nery5, Stephen Wilton2, Allan Skanes3, Faramarz F. Samavati2, and James A. White1
1Cardiac Sciences - Stephenson Cardiac Imaging Centre, University of Calgary, Calgary, AB, Canada, 2University of Calgary, Calgary, AB, Canada, 3Western University, London, ON, Canada, 4Carleton University, Ottawa, ON, Canada, 5University of Ottawa, Ottawa, ON, Canada
Synopsis
This study may be of interest for clinicians and researchers who study left atrial diseases and arrhythmias. This study demonstrated a significant decrease of flow energetics and vortex size in patients with history of atrial fibrillation.
PURPOSE
Atrial fibrillation (AF) is a common arrhythmia associated with elevated morbidity and mortality from systemic thrombo-embolism (1). Characterization of left atrial (LA) hemodynamics may provide valuable insights for thrombogenic risk. However, such fluid dynamics are challenging to explore given their 3-dimensional complexity (2,3). This study aimed to employ 4D flow MRI to non-invasively quantify differences in hemodynamic energetics and vortex flow patterns in between pre- and post-ablation patients with paroxysmal AF as compared with healthy controls (HC).METHODS
35 patients with paroxysmal AF of more than two years’ duration (17 pre- and 18 post-pulmonary vein ablation) and 10 HC were enrolled in an IRB-approved study protocol. Patients were required to be in sinus rhythm and not have greater than mild mitral insufficiency. Imaging was performed using a 3T MRI scanner (Prisma or Skyra, Siemens, Erlangen, Germany) using a standardized protocol inclusive of ECG-gated 4D flow MRI with adaptive navigator respiratory gating with whole heart coverage (4). 4D flow imaging parameters were: Venc= 1.5-2.0 m/s, TE= 2.61-3.14 ms, TR= 4.9-5.9 ms, FOV= 200-420 mm x 248-368 mm, spatial resolution = 1.9-3.5x2.0-3.2x1.8-3.5 mm3, temporal resolution = 39-47 ms, and FA = 8°. 4D flow MRI dataset pre-processing included: eddy-current correction, flow aliasing, and calculation of 3D phase contrast angiography (3D PC-MRA). The 3D PC-MRA was used to segment the left sided chambers and proximal aorta, Fig. 1B. The LA was isolated, Fig. 1C, and used to calculate KE (KE=1/2×rho×v2, where rho is the blood density = 1.06 g/mL and v the velocity field); and EL (EL=μ∑DV), where the dynamic viscosity was μ=0.004 Pa.s, D was the viscous dissipation on a voxel-by-voxel basis, and V was the voxel volume (5, 6). The maximum vortex size as derived by lambda-2 detection was computed at the end systole. Volumetric median and total summation from KE and EL was obtained at peak systole and peak diastole (Fig. 2 and 3). All parameters were normalized to volume size.RESULTS
Age was 54±10 years in pre-ablation, 61±9 years in post-ablation subjects and 42±15 years in HC (ANOVA p<0.001; pre-AF vs. HC, p=0.023; post-AF vs. HC, p<0.001). No significant differences in LV and RV function were observed (Table 1). At peak systole and peak diastole a significant decrease in normalized EL and KE, (Kruskal Wallis, p<0.05, Table 2), and increase of vortex size were found (ANOVA, p<0.05, Table 2). A significant decrease between pre-ablation and HC groups was observed for normalized KE median at peak systole (p=0.006), normalized KE median at peak diastole (p=0.003), normalized EL median at peak systole (p<0.001), normalized EL median at peak diastole (p<0.001). Vortex size was 1.84 times larger in pre-ablation patients as compared with controls (p=0.003). Total normalized KE and EL at peak systole and diastole highlighted same energetic decrease between HC and pre-ablation patients (Table 2) with significant differences for total normalized KE at peak systole (p=0.002), total normalized KE at peak diastole (p=0.004), total normalized EL at peak systole (p<0.001), total normalized EL at peak diastole (p<0.001). Post-ablation studies showed increased KE and EL with 15% reduction in vortex size versus the pre-ablation cohort. However, these improvements only reach significance in normalized KE median at peak diastole (p=0.038) and vortex size volume percentage (p=0.025). Post-ablation patients continued to show significant differences versus HC in normalized EL median at peak systole (p<0.001), normalized EL median at peak diastole (p<0.001), total normalized KE at peak systole (p=0.018), total normalized KE at peak diastole (p=0.040), total normalized EL at peak systole (p<0.001), total normalized EL at peak diastole (p<0.001), and vortex size (p=0.047).CONCLUSION
This study demonstrated the capacity of 4D flow to identify a significant reduction in atrial KE in patients with history of AF. In this study a trend towards improvement was seen in post-ablation patients. The reduced EL may indicate the prevalence of turbulent flow contributing to energy loss by turbulent dissipation. Such reduced LA energetics could potentially contribute to blood stagnation (flow stasis) and consequent LA thrombosis in AF patients. Despite still significantly different from volunteers, post-ablation patients showed clear signs of improvement in KE, EL and vortex size trending closer to normal ranges. Such results suggest that energetic and vortex flow parameters, from 4D Flow MRI, could allow new metrics to evaluate efficiency of ablation procedure in AF patients. Understanding of the relation between ablation and energetics and vortex flow could offer new insights to evaluate and optimize ablation procedure providing close-to-normal hemodynamics. Future studies with larger population are needed to evaluate the impact of reported hemodynamic alterations of left atrial diseases on cardiac function and link to ablation procedure.Acknowledgements
This work was supported in part by the Cardiac Arrhythmia Network of Canada (CANet) AF-START grant, Circle Cardiovascular Imaging, and MITACS (IT07679 and IT07680).References
1. Feinberg WM et al. Arch Intern Med 1995; 155(5): 469-473. 2. Fluckiger J et al. J Mag Reson Imaging 2013;38: 580-587. 3. Markl M et al. Int J Cardiovasc Imaging 2016;32(5): 807-15. 4. Markl M et al. J Mag Reson Imaging 200;25 :824-831. 5. Elbaz MS et al. Magn Reson Med 2017;77(2) : 794-805. 6. Elbaz MS et al. J Cardiovasc Magn Reson 2014;16 :78.Figures
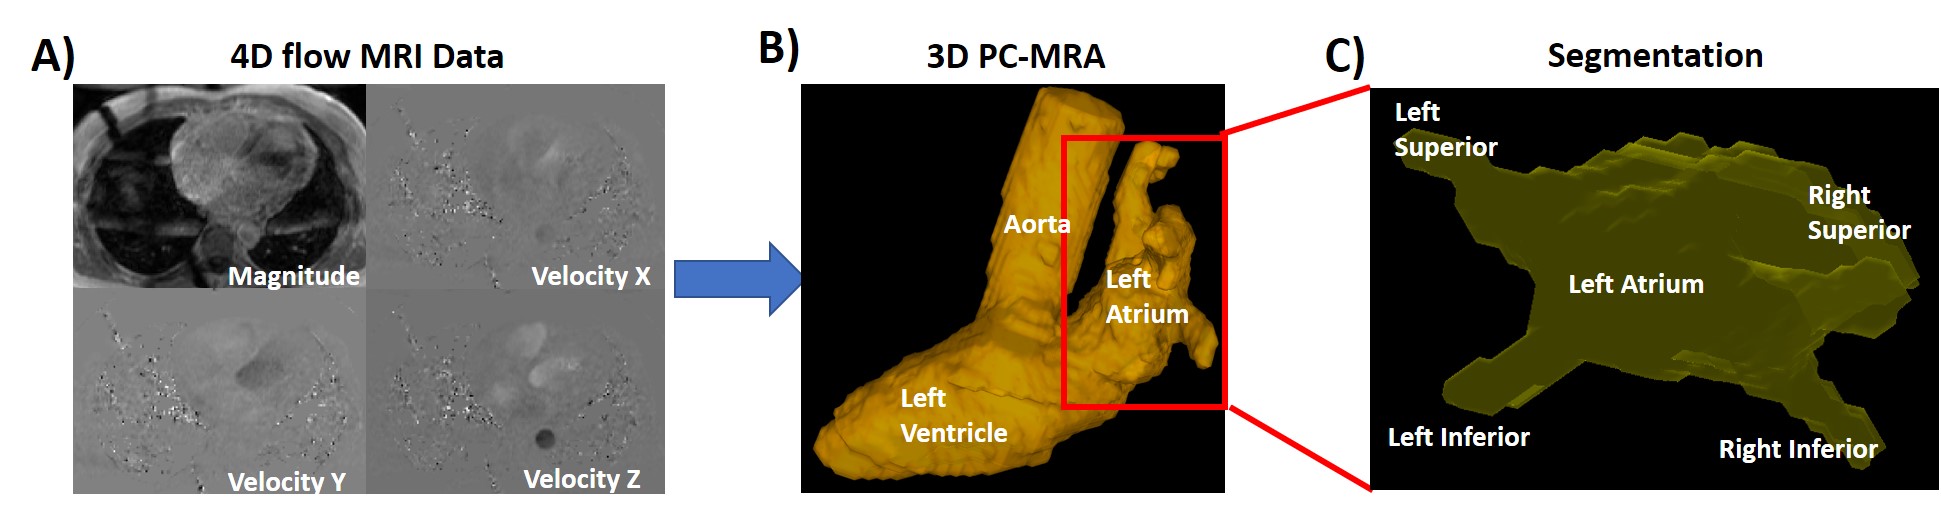
Figure 1. Workflow.
Panel A shows an example of 4D flow MRI data which were pre-processed for eddy
currents, Maxell terms and aliasing. Panel B shows the segmentation of the left
side of the heart including the aorta, left atrium and the left ventricle.
Panel C shows the isolation of the left atria for energetic and vortex size
measurements.
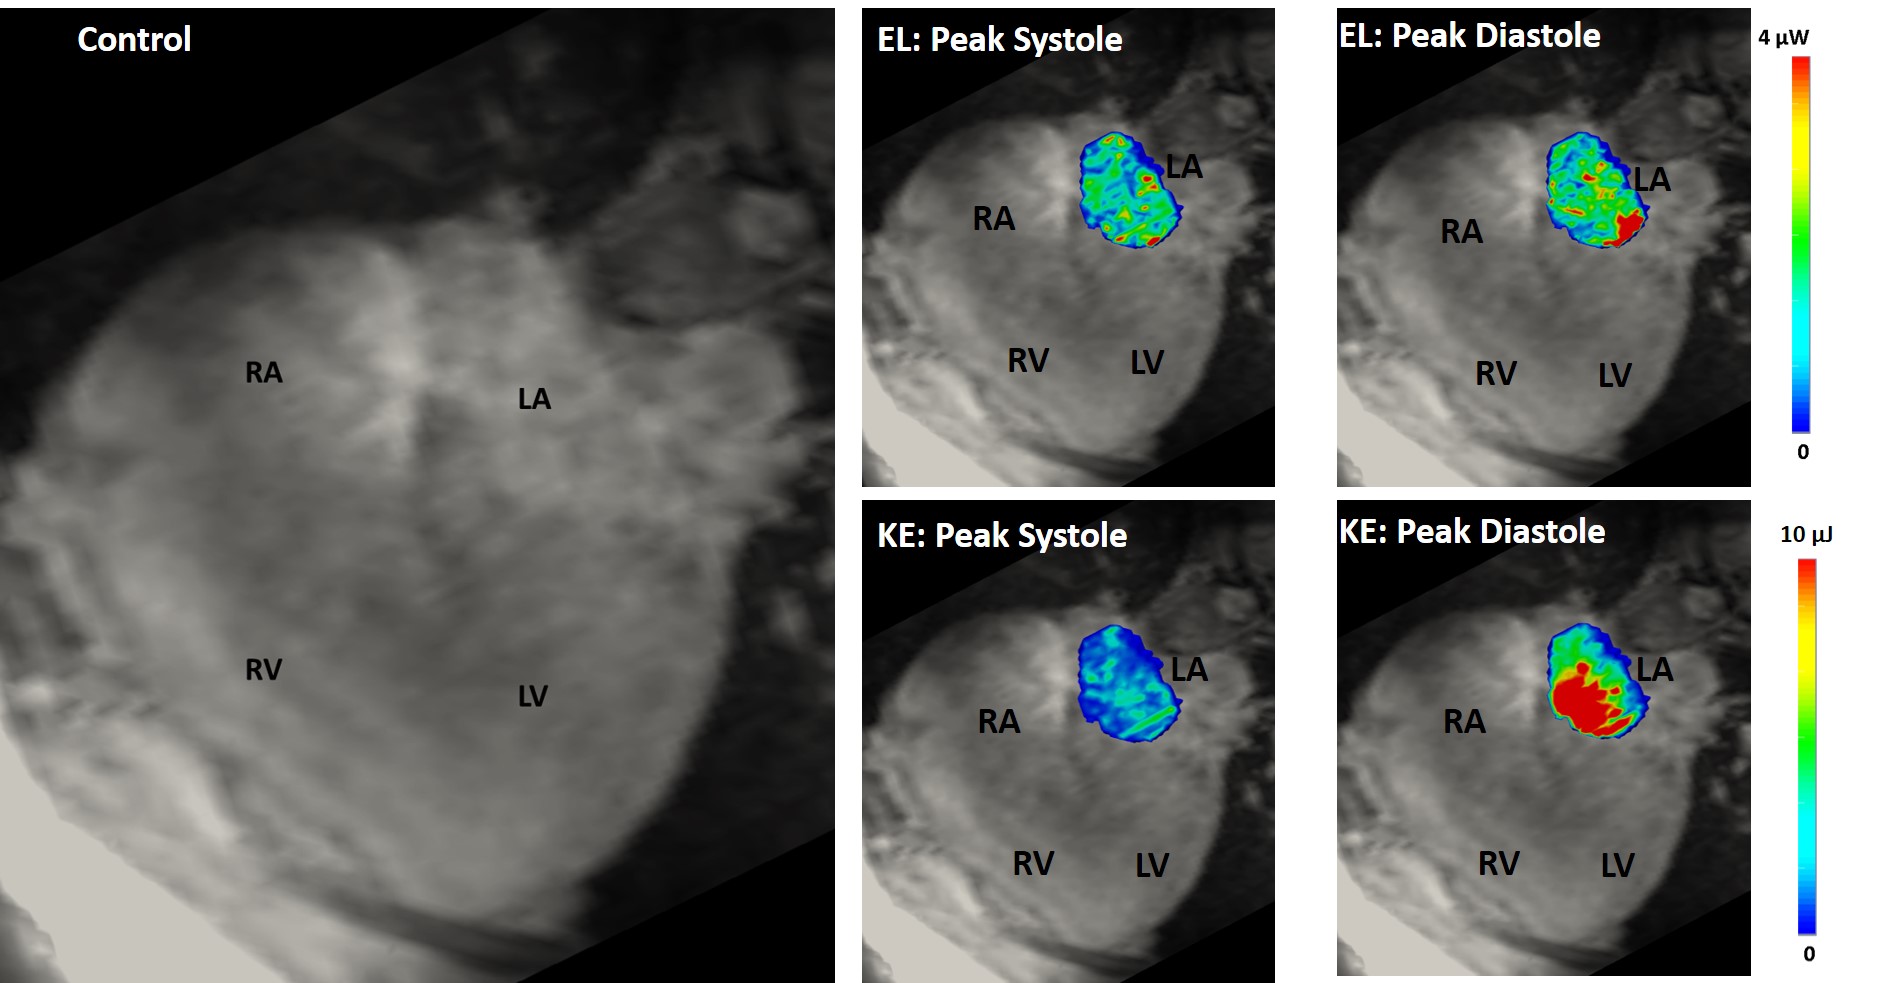
Figure 2. 4D flow energetics in a
healthy control.
RA: right atria; RV: right ventricle; LA: left atria; LV: left ventricle; EL:
viscous energy loss; KE: kinetic energy.
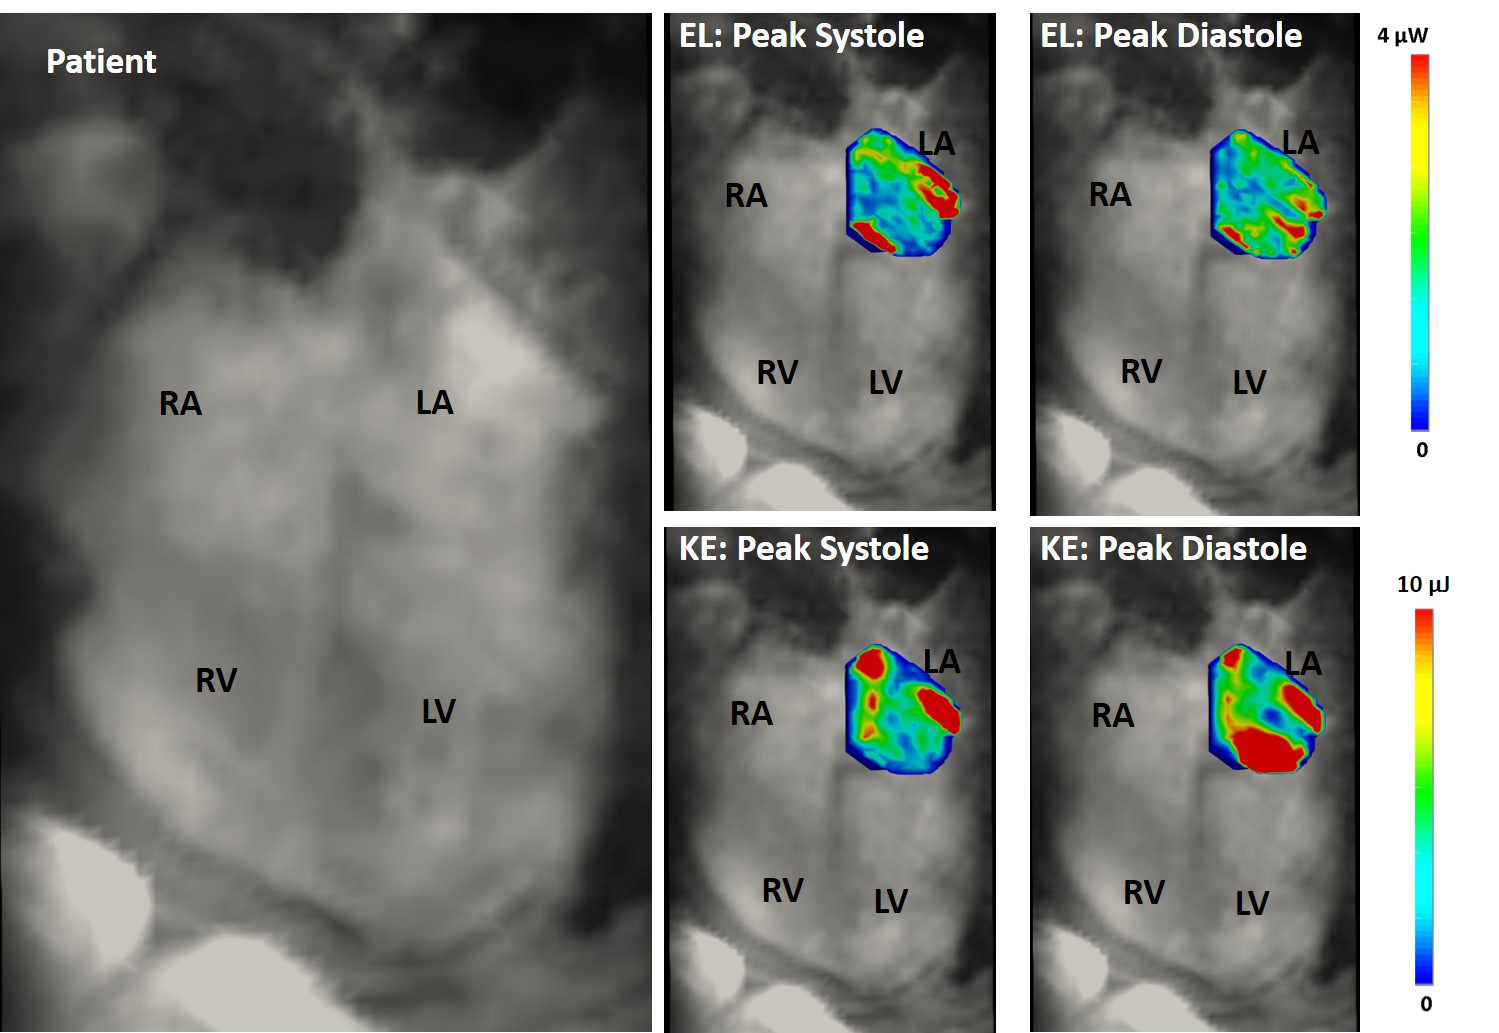
Figure 3. 4D flow energetics in a
patient with atrial fibrillation. RA: right atria; RV: right ventricle;
LA: left atria; LV: left ventricle; EL: viscous energy loss; KE: kinetic
energy.
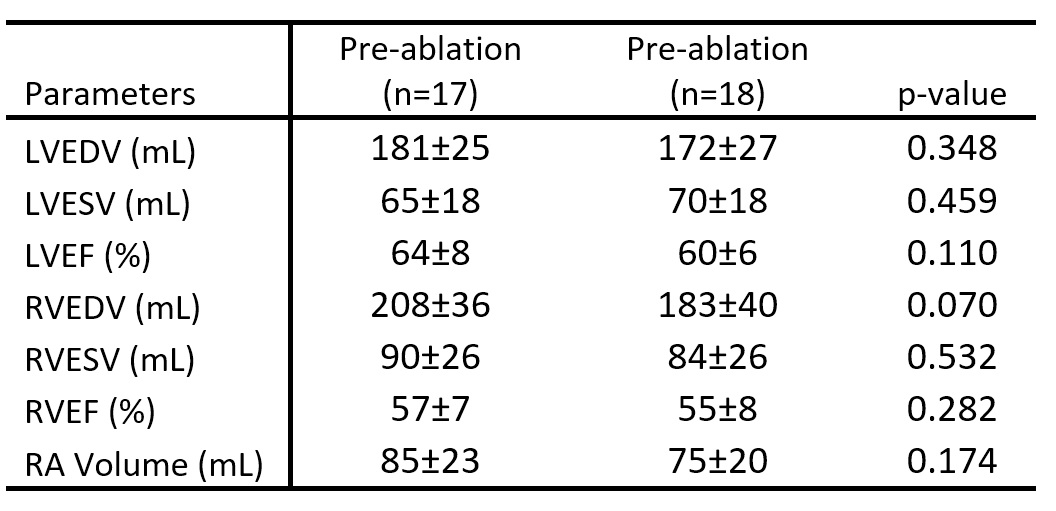
Table 1. Left and right ventricular function.
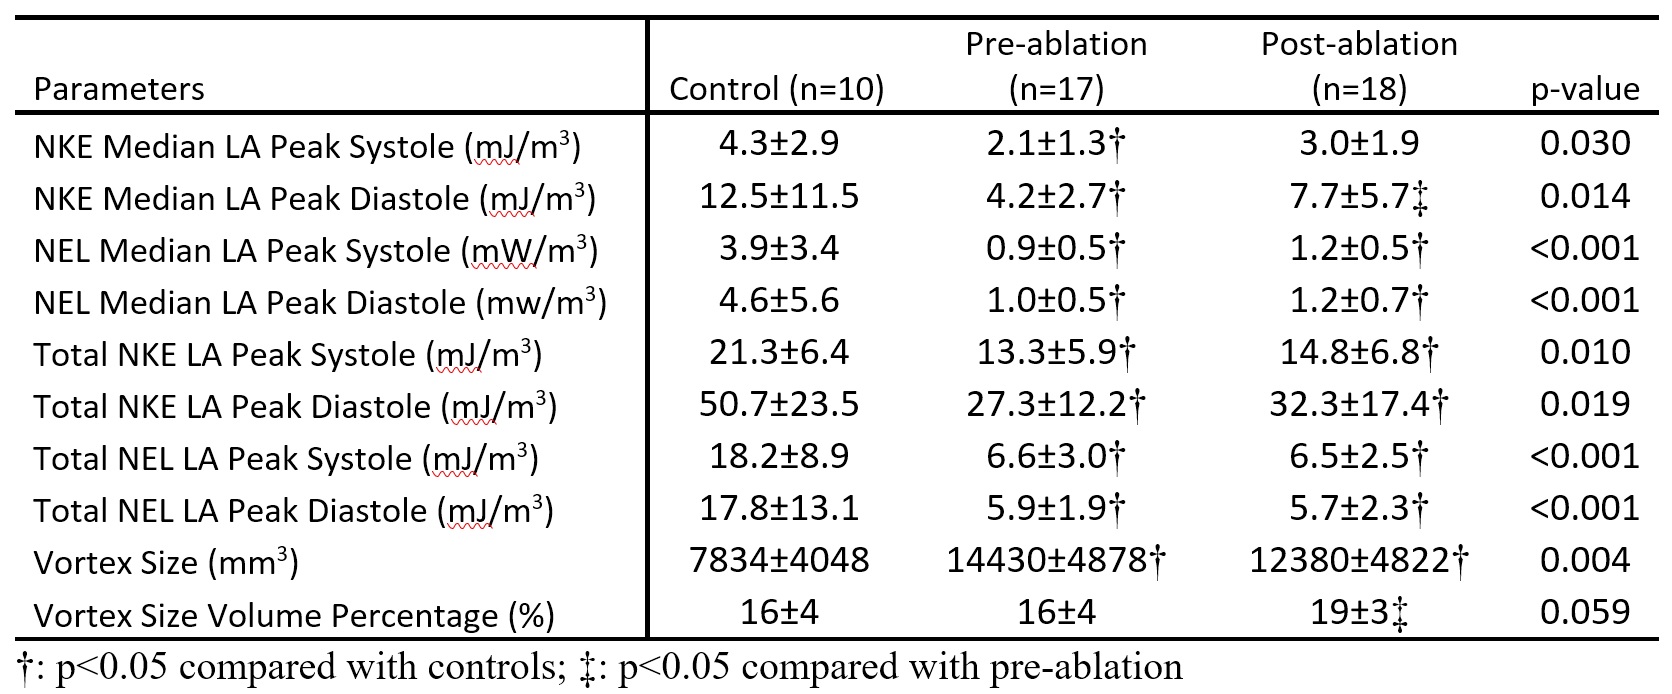
Table 2. Left atria energetic and vortex size measurements.