0561
CO2 induced pHi changes in the brain of polar fish: a TauCEST application1University of Bremen, Bremen, Germany, 2Alfred Wegener Institute Helmholtz Centre for Polar and Marine Research, Bremerhaven, Germany
Synopsis
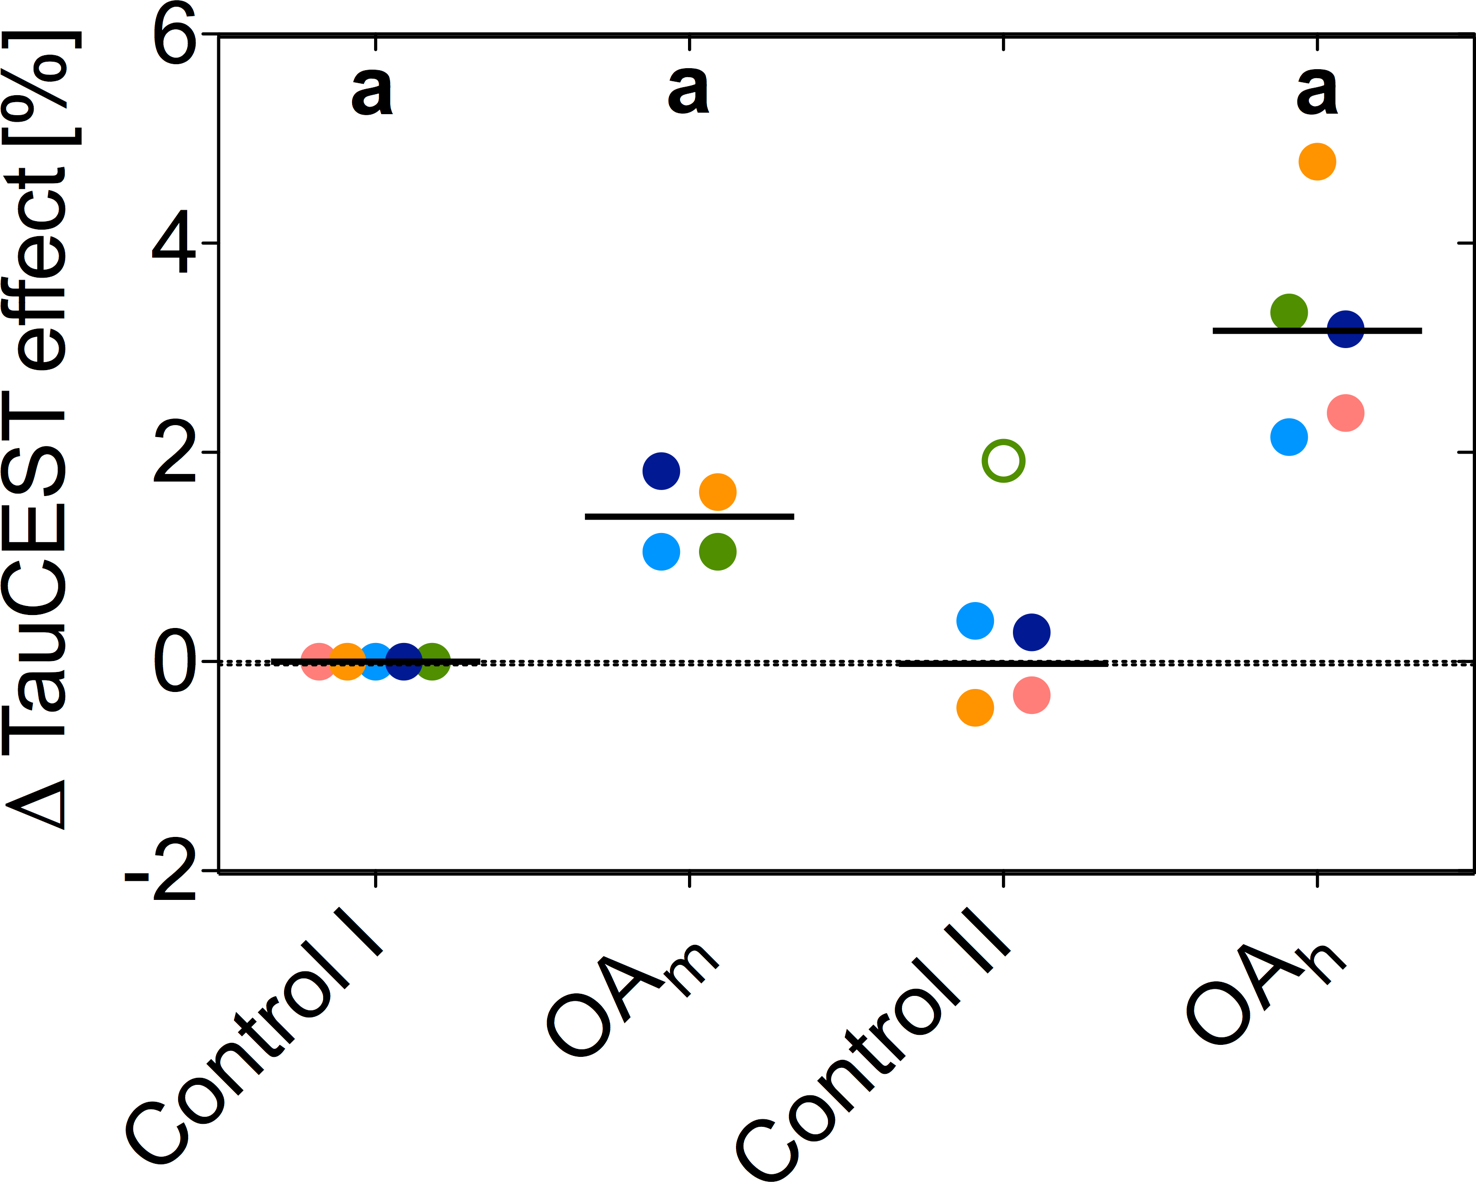
Chemical exchange saturation transfer from taurine to water (TauCEST) is primarily detectable in the low temperature range. Since, TauCEST asymmetry is bijective in the physiological pH-range (6.8-7.5), TauCEST is a potential candidate for in vivo studies on brain of polar fish. The specificity of TauCEST MRI on the brain of polar cod at 1.5°C shows a taurine contribution of 65%. TauCEST in brain of polar cod significantly increased under elevated CO2 concentrations by about 1.34%-3.17% in comparison to control, reflecting pHi changes since localized 1H NMR spectra show no significant changes in metabolite concentration for the different treatments.
Introduction
As anthropogenic global climate change effects the oceans1, several CO2 induced impacts on fishes like olfactory discrimination and the innate ability to detect predator olfactory cues were observed2-4. While a connection between a drop in intracellular pH (pHi) and neurological disorders is discussed5,6, the mechanisms underlying neurological and behavioural disorders of fishes under ocean acidification (OA) scenarios are still under investigation. Therefore, the non-invasive and local determination of the pHi in the brain of polar fishes is desirable. Taurine is an abundant amino acid in the brain, exhibiting a concentration and pH dependent CEST effect between its amine protons and protons of bulk water. Thus, TauCEST is a promising technique for pHi mapping of polar fish brain.Methods
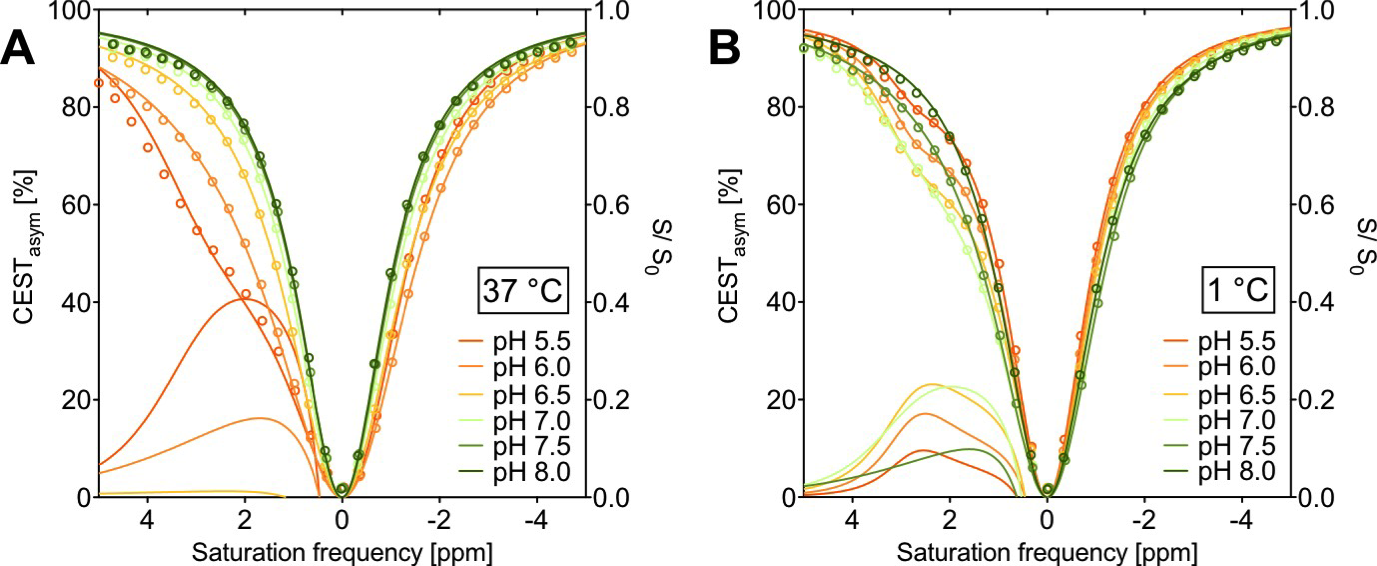
In vitro NMR measurements were performed on a 7T animal scanner (Biospec 70/20 USR, Bruker Biospin) equipped with a B0 gradient system BGA-12S2 and a quadrature birdcage coil (72mm ø). CEST images were obtained by pre-saturated FISP imaging. Pre-saturation was accomplished by a train of 12 rectangular pulses (tp=1s, B1=5.87μT). The phantom consisted of six NMR tubes filled with 10mM taurine solutions dissolved in PBS, titrated to different pH values between 5.5-8.0. The applied temperature range was 1-37°C. The CEST asymmetry was calculated as CESTasym=(Msat(-Δω)-Msat(Δω))/Msat(-Δω).
Simulations were performed by numerically solving the Bloch-McConnell equations using a two-pool- or a multi-pool-model. Exchange rates were determined by numerically fitting the Bloch-McConnel equations to experimental data (not shown).
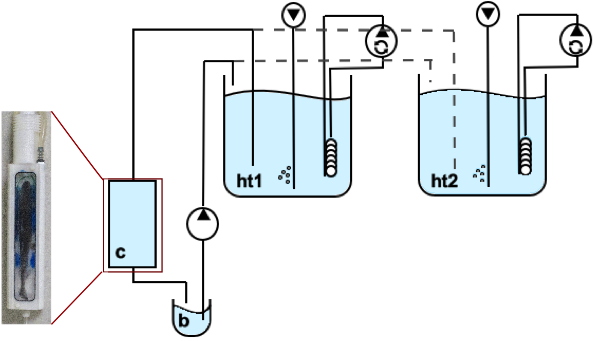
In vivo NMR measurements were performed on a 9.4T animal scanner (BioSpec 94/30 USR, AVANCE III, Bruker BioSpin) equipped with a BGA-12S HP B0 gradient system and a quadrature coil (86mm ø) was used. CEST imaging was similar to the in vitro studies. Pre-saturation was accomplished by a train of 3 rectangular pulses (tp=1s, B1=4.4μT). The experimental setup consisted of a temperated sea water circulating system (1.5°C) with two header tanks supplying a flow-through chamber for unanesthetized polar cod Boreogadus saida (n=5) (Figure 1). The header tanks were bubbled with air and elevated air-CO2-mix concentrations (Control: pCO2=540µatm/pH8.0; OAm: pCO2=3300µatm/pH7.2; OAh: pCO2=4900µatm/pH7.0).
Results
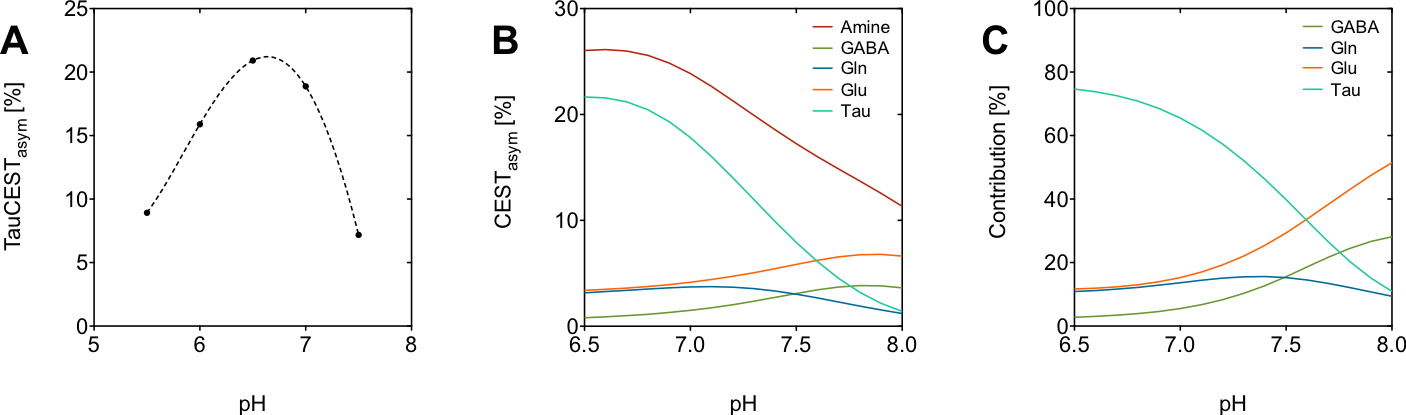
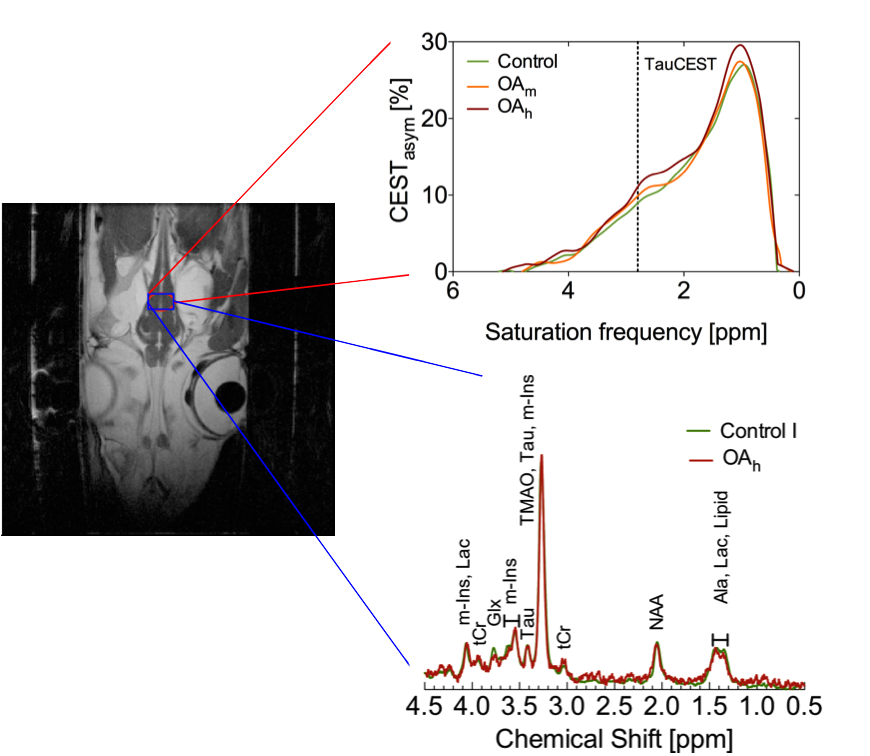
The in vitro TauCEST z-spectra and asymmetry curves only depict an effect at a pH <6.5 for 37°C. However, at 1°C, the asymmetry curves show a clear dip for the pH values between 5.5-7.5. Although the TauCEST effect is not a bijective function of pH, the TauCEST effect changes monotonically in the range of physiological pH (pH 6.8-7.5) at 1°C. Simulations indicated that TauCEST shows the same course like the total CEST effect. Furthermore, taurine dominates the total CEST effect for a pH between 6.5-7.5. The in vivo CEST asymmetry curves show a clear difference between the two treatments in comparison to control at ~2.8 ppm (downfield from water), that can be attributed to TauCEST. Localized 1H MR spectra obtained for control and OAh conditions indicate no significant changes in metabolite concentrations. For all conditions and in relation to the first control measurements, the TauCEST asymmetries show an increase of 1.34%-3.17% after 1.5h of CO2 exposure.Discussion
The contribution of taurine will be 65% of the expected CEST effect in the range of physiological pH in vivo, thus justifying the term TauCEST. Additionally, TauCEST shows a similar pH dependence as the total CEST effect in the multi-pool simulation. This is important since the characteristics of the multi-pool are crucial for the applicability of pHi imaging7,8. A significant increase in TauCEST effects for moderate and high CO2 treatment was observed in vivo, that have to rely on an increase in intracellular Tau concentration or a decrease in pHi. Simulations predict that the observed changes in the TauCEST effect of about 1.5%-3% would be induced by an increase of about 7-14 mM in [Tau] concentration or a decrease in pH by about 0.2-0.4 units. However, accompanied acquired localized in vivo 1H MR spectra showed no appropriate increase in [Tau] for different treatments. Therefore, the observed increase in the TauCEST effect under elevated pCO2 likely is a result of lower pHi in the brain of polar cod.Conclusion
TauCEST detection is feasible in the brain of polar cod at low temperatures. The majority of the observed total CEST effect observed in vivo is attributed to taurine. TauCEST imaging provides the non-invasive detection of relative changes in pHi with high temporal and spatial resolution under acute exposure to high pCO2. Future studies using this methodology will provide a new possibility to investigate the mechanisms underlying neurological and behavioural disorders in fishes under OA scenarios and the associated influences of acid-base disturbances.Acknowledgements
No acknowledgement found.References
1. Gattuso JP, Magnan A, Billé R, et al. Contrasting futures for ocean and society from different anthropogenic CO2 emissions scenarios. Science. 2015;349(6243):aac4722.
2. Heuer RM, Grosell M. Physiological impacts of elevated carbon dioxide and ocean acidification on fish. Am J Physiol Regul Integr Comp Physiol. 2014;307(9):R1061-R1084.
3. Munday PL, Dixson DL, Donelson JM, et al. Ocean acidification impairs olfactory discrimination and homing ability of a marine fish. Proc Natl Acad Sci U S A. 2009;106(6):1848-1852.
4. Dixson DL, Munday PL, Jones GP. Ocean acidification disrupts the innate ability of fish to detect predator olfactory cues. Ecol Lett. 2010;13(1):68-75.
5. Lee J, Taira T, Pihlaja P, Ransom BR, Kaila K. Effects of CO2 on excitatory transmission apparently caused by changes in intracellular pH in the rat hippocampal slice. Brain Res. 1996;706(2):210-216.
6. Sinning A, Hübner CA. Minireview: pH and synaptic transmission. FEBS Lett. 2013;587(13):1923-1928.
7. Cai K, Haris M, Singh A, et al. Magnetic resonance imaging of glutamate. Nat Med. 2012;18(2):302-306.
8. Lee JS, Xia D, Jerschow A, Regatte RR. In vitro study of endogenous CEST agents at 3 T and 7 T. Contrast Media Mol Imaging. 2016;11(1):4-14.
Figures