0560
Evaluating Feasibility of Creatine-weighted CEST MRI in Human Brain at 7T using Z-spectral Fitting Approach1Centre for Biomedical Engineering, Indian Institute of Technology Delhi, New Delhi, India, 2Biomedical Engineering, AIIMS Delhi, New Delhi, India, 3Sidra Medical and Research Center, DOHA, Qatar, 4Radiology, University of Illinois at Chicago, Chicago, IL, United States, 5Radiology, University of Pennsylvania, Philadelphia, PA, United States
Synopsis
Creatine(Cr)-weighted chemical-exchange-saturation-transfer(CEST) MRI is being developed to detect alteration in Cr concentration during modulation as well as Cr-associated disorders. Cr-weighted CEST contrast show dependence on saturation parameters and overlap from other effects in brain. The conventional asymmetry approach results in a mixed contrast, which is less specific to Cr. By using appropriate saturation parameters, contamination from some of the metabolites/molecules can be reduced; however, it is difficult to suppress the contamination completely as shown by simulation studies. Proposed protocol and improved z-spectral fitting approach can be used for computing Cr-weighted CEST contrast with reduced contamination in human brain at 7T.
Introduction:
Creatine(Cr) is a
significant metabolite in the brain and
its alterations have been reported in
various disease conditions1,2. Amine protons of Cr exhibits
chemical-exchange-saturation-transfer(CEST) contrast at a frequency offset ~1.8 ppm from water proton
resonance frequency and this effect has
been demonstrated in phantom studies3. Feasibility of Cr-weighted CEST
in human calf muscle4,5, myocardium6,
rat brain at 9.4T7,8 has been
reported. Preliminary results in human brain at 7T9 has been reported. Computation of CEST contrast is
challenging due to several confounding factors such as direct saturation(DS),
magnetization transfer(MT), overlap from other metabolites exhibiting CEST
effect and relayed-Nuclear-Overhauser-Enhancement(rNOE)
effect. CEST asymmetry(CESTasy) enables a
substantial reduction of DS and MT
effects; however, this approach is highly sensitive to B0 field inhomogeneity and it provide a mixed contrast
from CEST and rNOE effects. Alternative Z-spectral fitting approaches are being
used to mitigate these effects7,8. Several studies have used a combination of Lorentzian functions7,8,10
for computing CEST contrast. The CEST
effect is highly dependent on saturation parameters, field strength, and tissue type. Therefore, a
systematic study to investigate the feasibility
of Cr-weighted CEST in the brain with
optimal saturation pulse parameters and evaluation of possible contamination is required. In this study, we
have carried out optimization of saturation parameters, proposed an improved
Z-spectral fitting approach and evaluated contributions from other sources to
Cr-weighted CEST contrast using simulation and brain data at 7T.Methods:
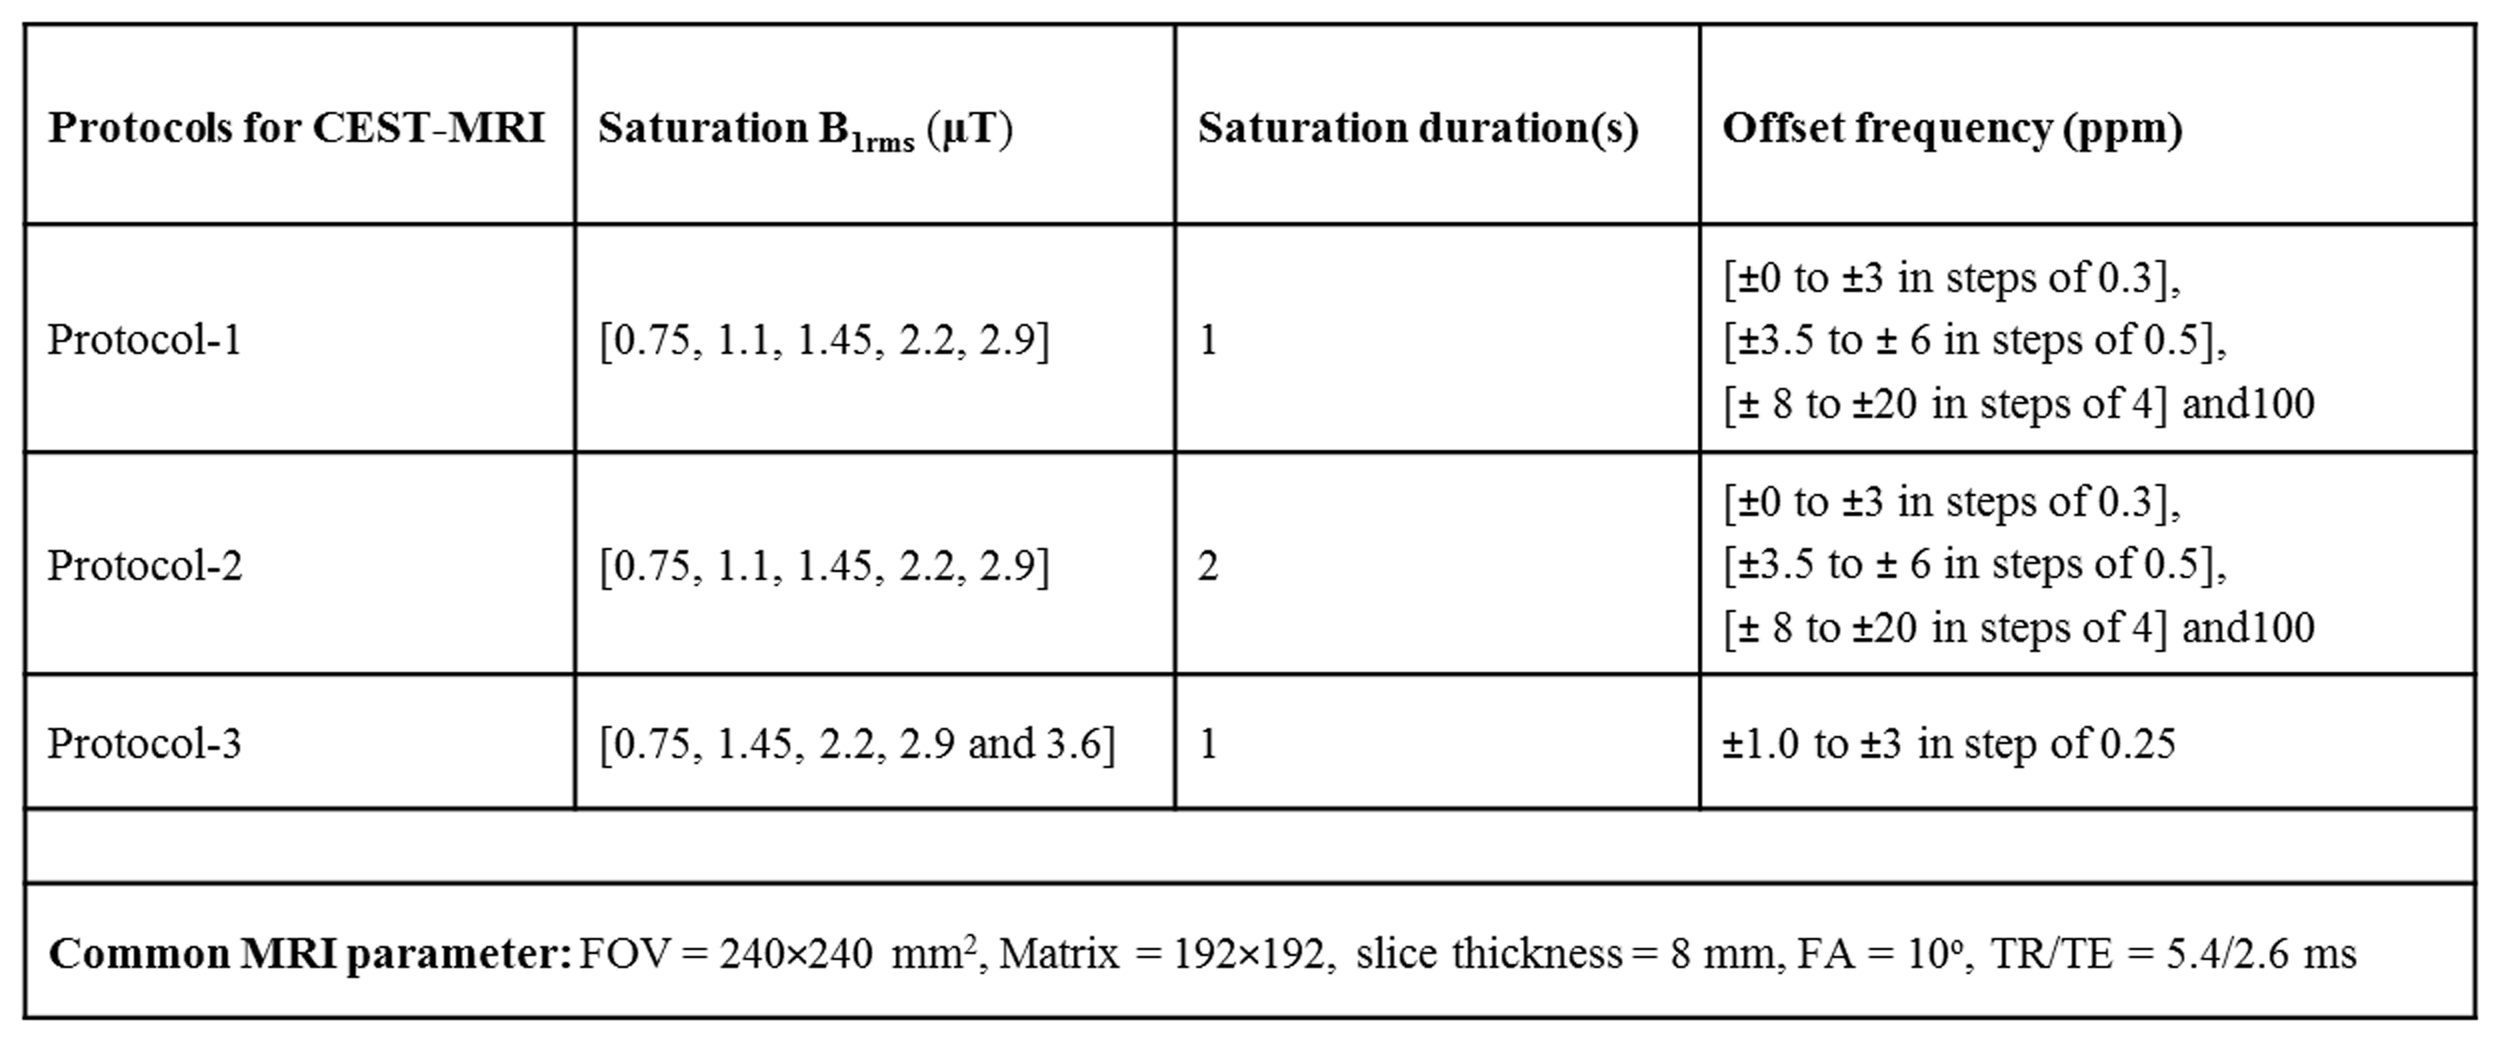
MRI of brain of healthy human subjects(three) were performed at 7T scanner(Siemens). The pulse sequence used in the current study was reported previously11. MRI data for B0 map, B1 map, Z-spectra or CEST were acquired. Details of MRI parameters are listed in the Table-1. CEST data at two time points were acquired for reproducibility. Bloch McConnell equation based simulations were carried out to obtain optimum saturation parameters for Cr-weighted CEST with reduced contamination from other CEST effects(Glutamate-weighted, APT-weighted, Myoinositol-weighted)11. CEST contrast was computed using CESTasy and modified Z-spectra fitting approaches based upon Lorentzian functions. CEST data were corrected for B0 and B1 field inhomogeneity. For estimating CEST effects from individual components, scaled Z-spectrum(Zsc) data was fitted using superposition of Lorentzian functions corresponding to multiple pools (Eq[1]).
$$$f(\triangle\omega)=100\times\sum_1^N\frac{{A_{n}}}{1+4\times\frac{\triangle\omega-\triangle\omega_{n}}{\sigma_{n}}} \space\space\space ...[1] $$$
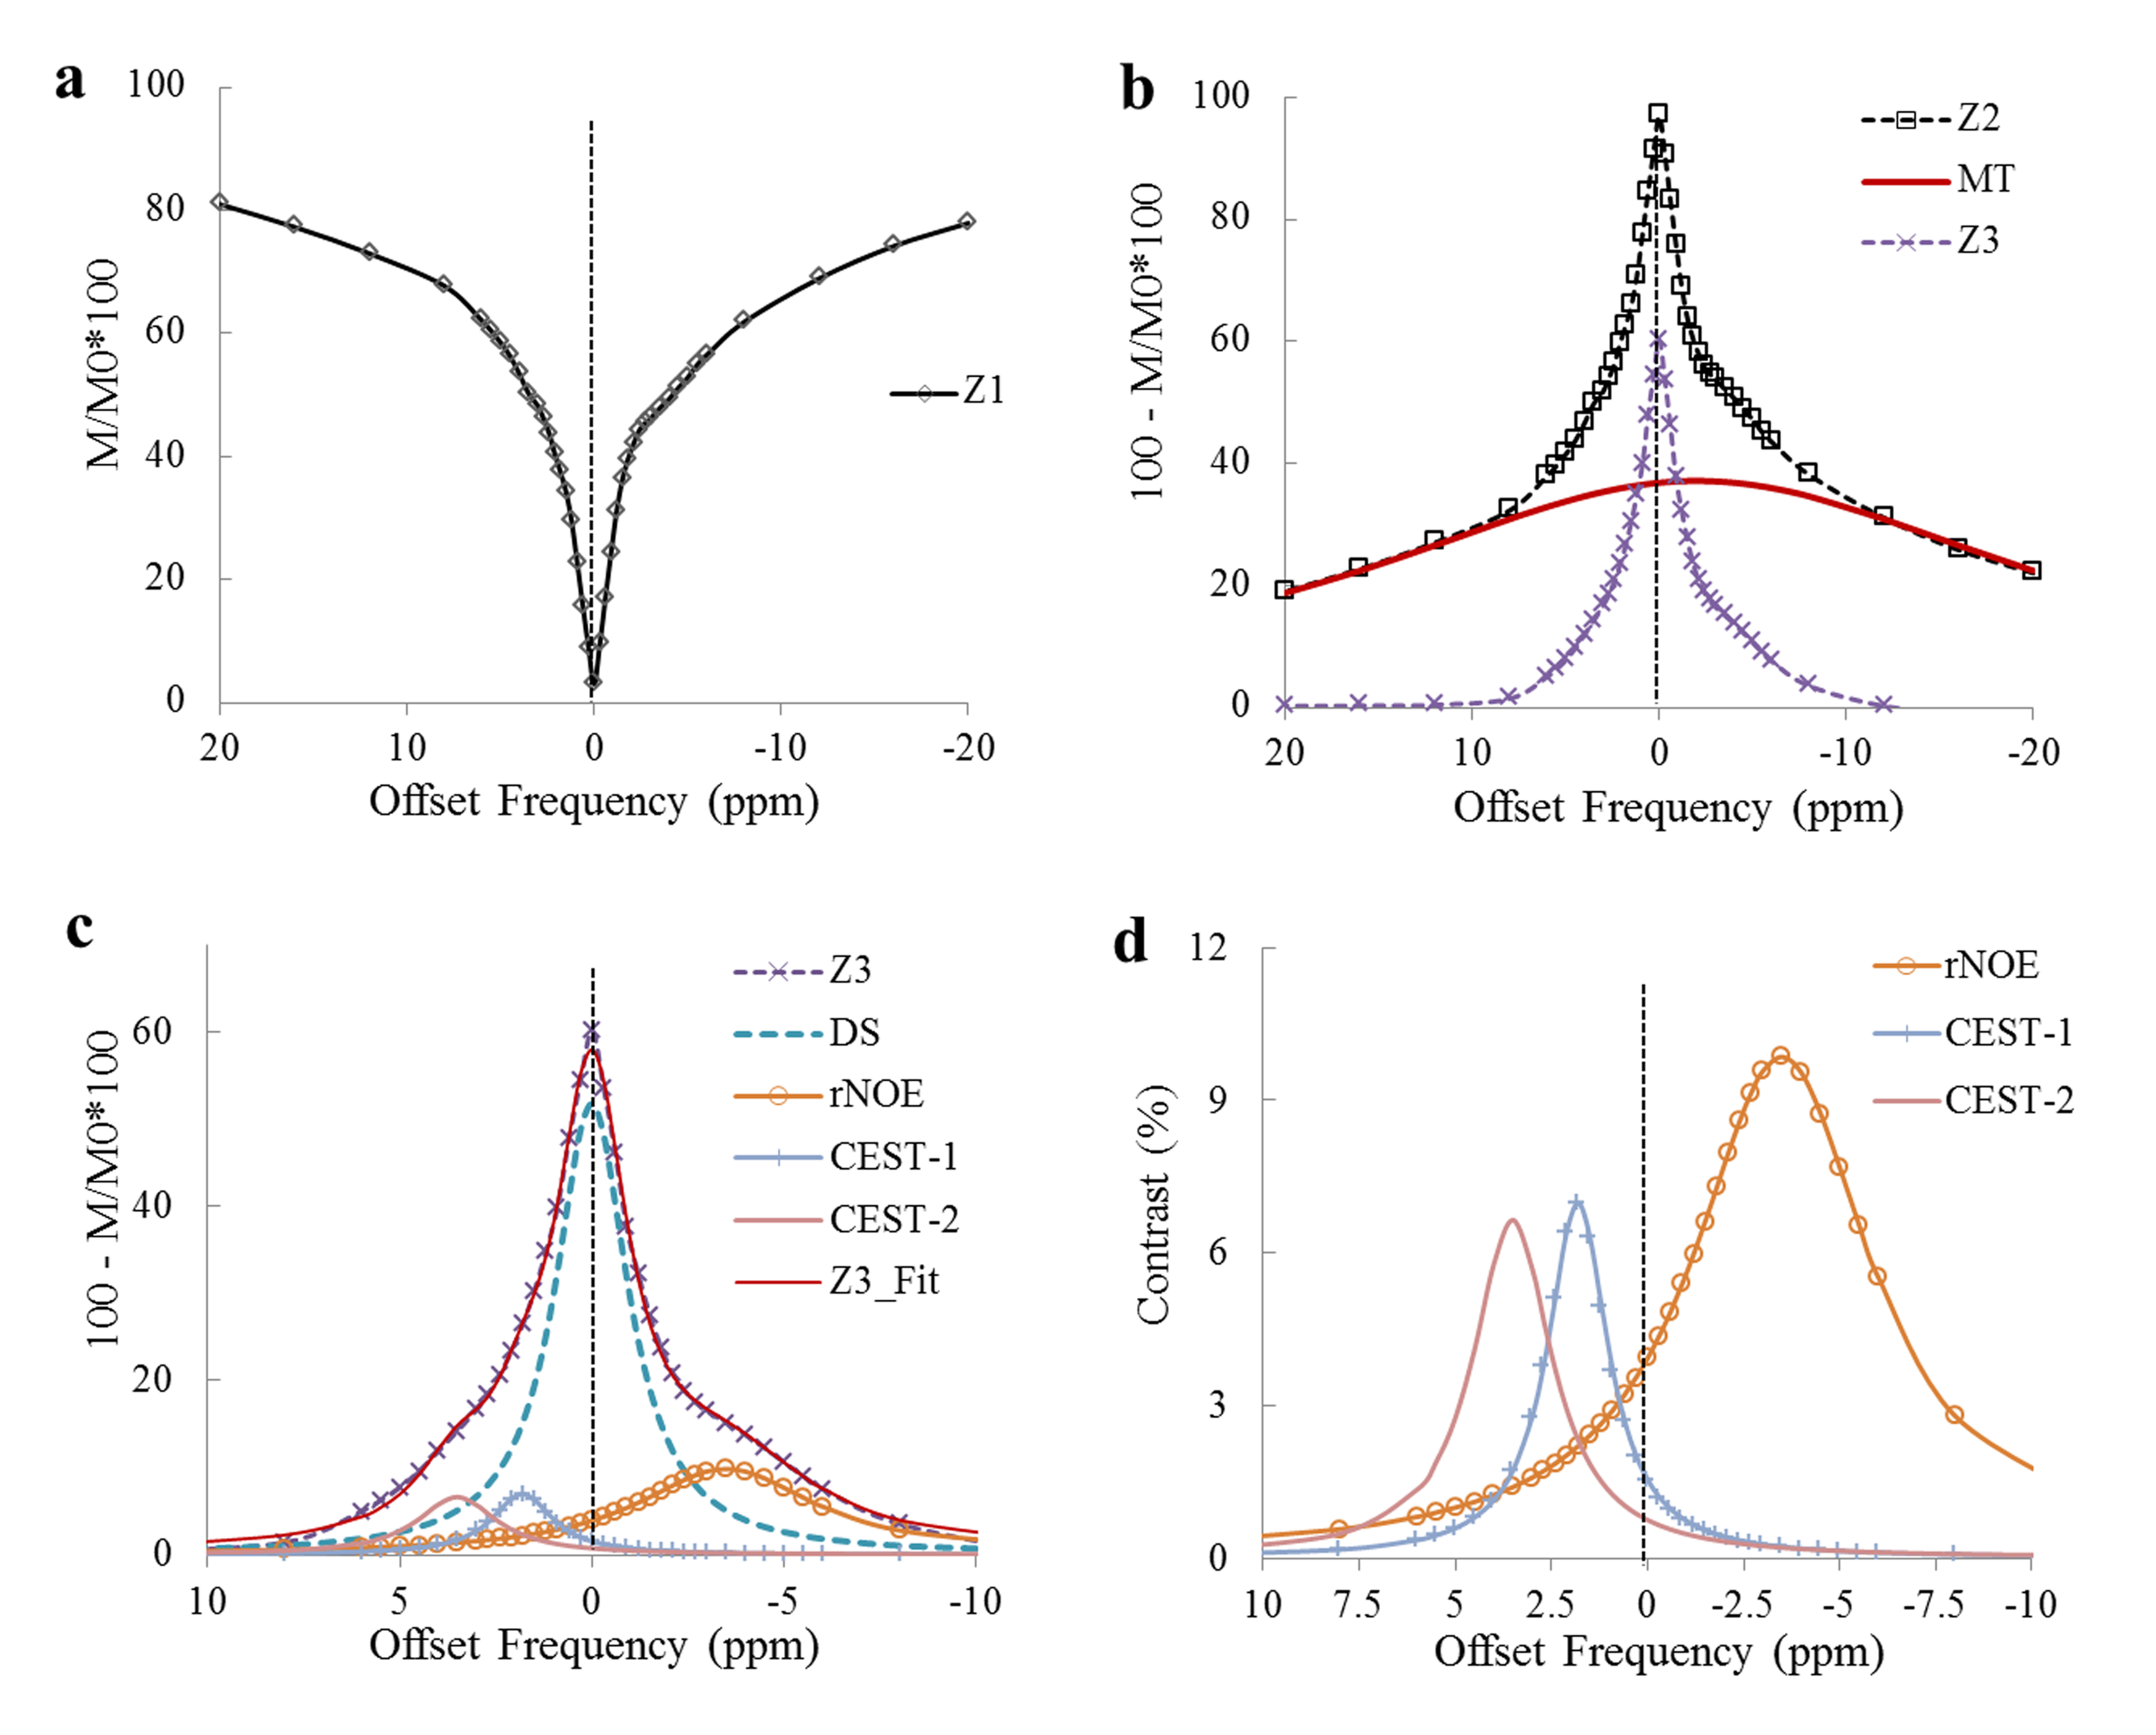
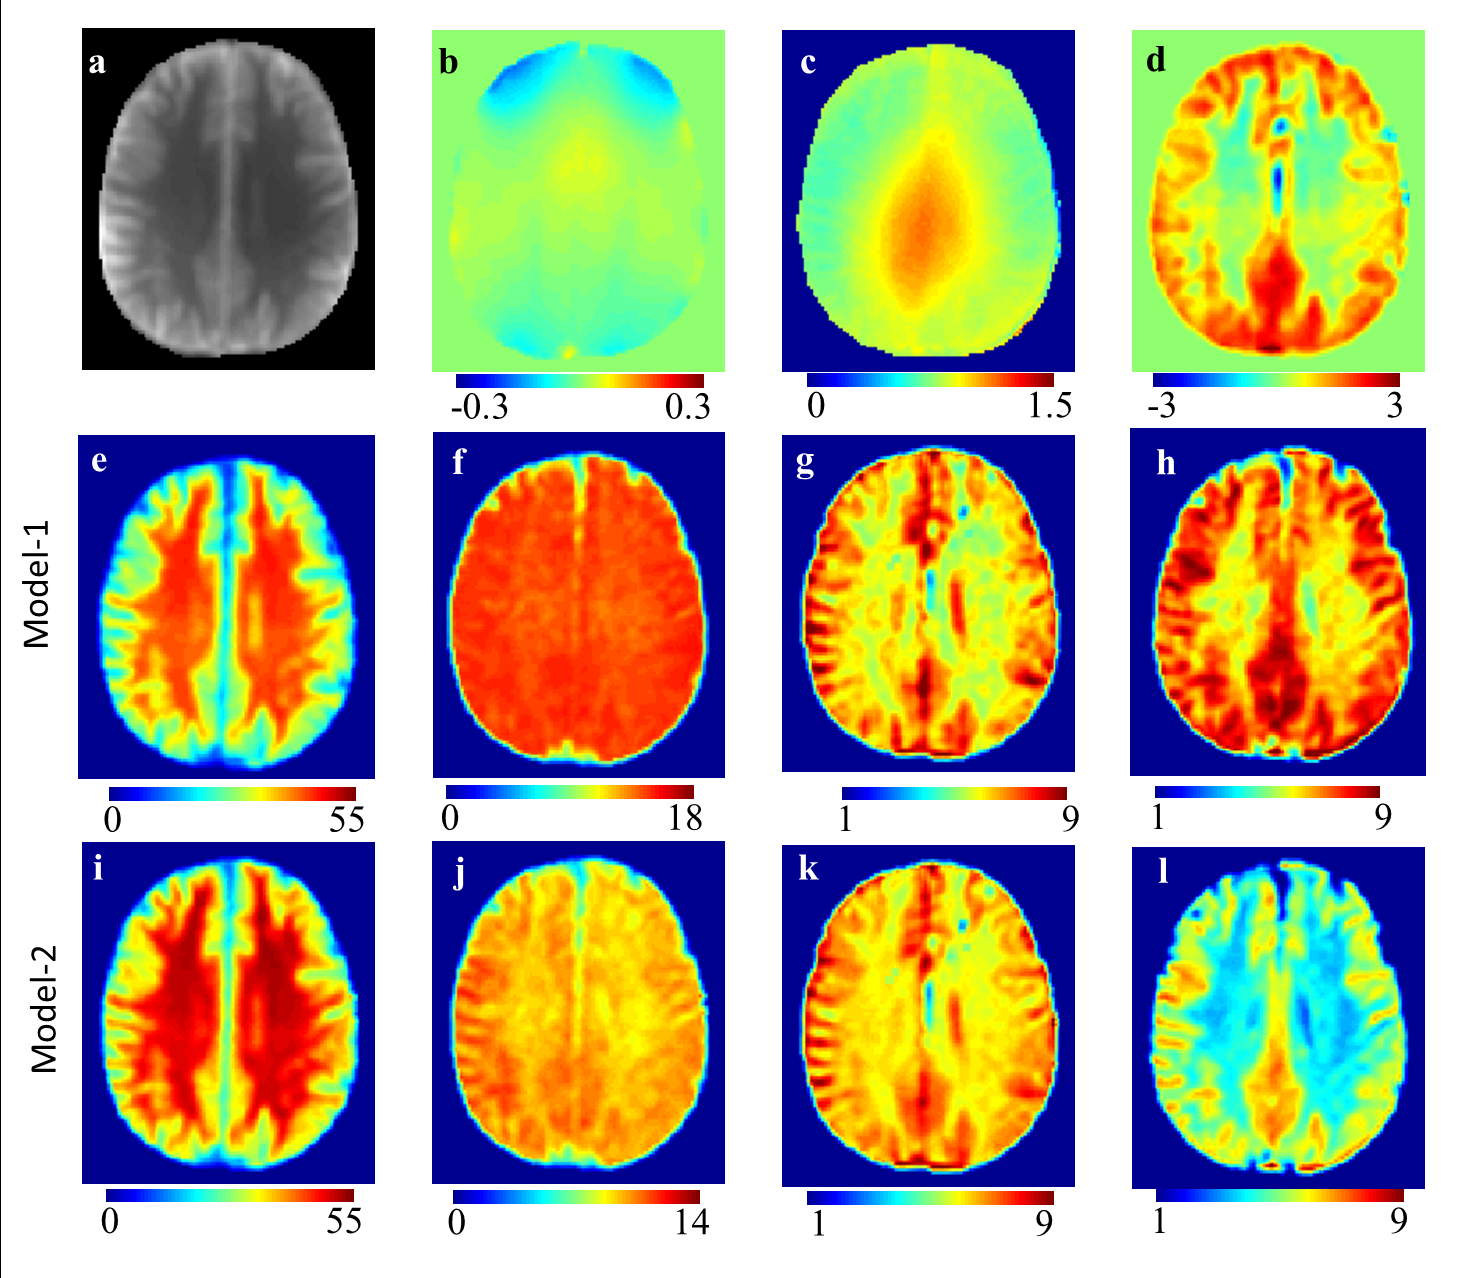
where Δω is the frequency-offset from the water resonance, An, Δωn and σn are the amplitude, frequency-offset and linewidth of the CEST peak for the nth proton pool, respectively. In this study, two Z-spectra fitting approaches(Model-1 and Model-2) were used. In Model-1, the Zsc was fitted with the sum of five Lorentzian functions. For brain data following 5 pools were considered: MT, DS, rNOE, Cr-weighted CEST and APT-weighted/Glu. Model-2 is an improved version of Model-1. In Model-2, instead of fitting Zsc directly, we first used limited data(±12 to ±20ppm) with negligible contribution from DS, for computing MT component. This fitted MT component was removed from the Zsc and remaining part was fitted using superposition of 4-pool Lorentizian function. For reproducibility, coefficient-of-variation(COV) was computed for multiple ROIs in brain.
Results:
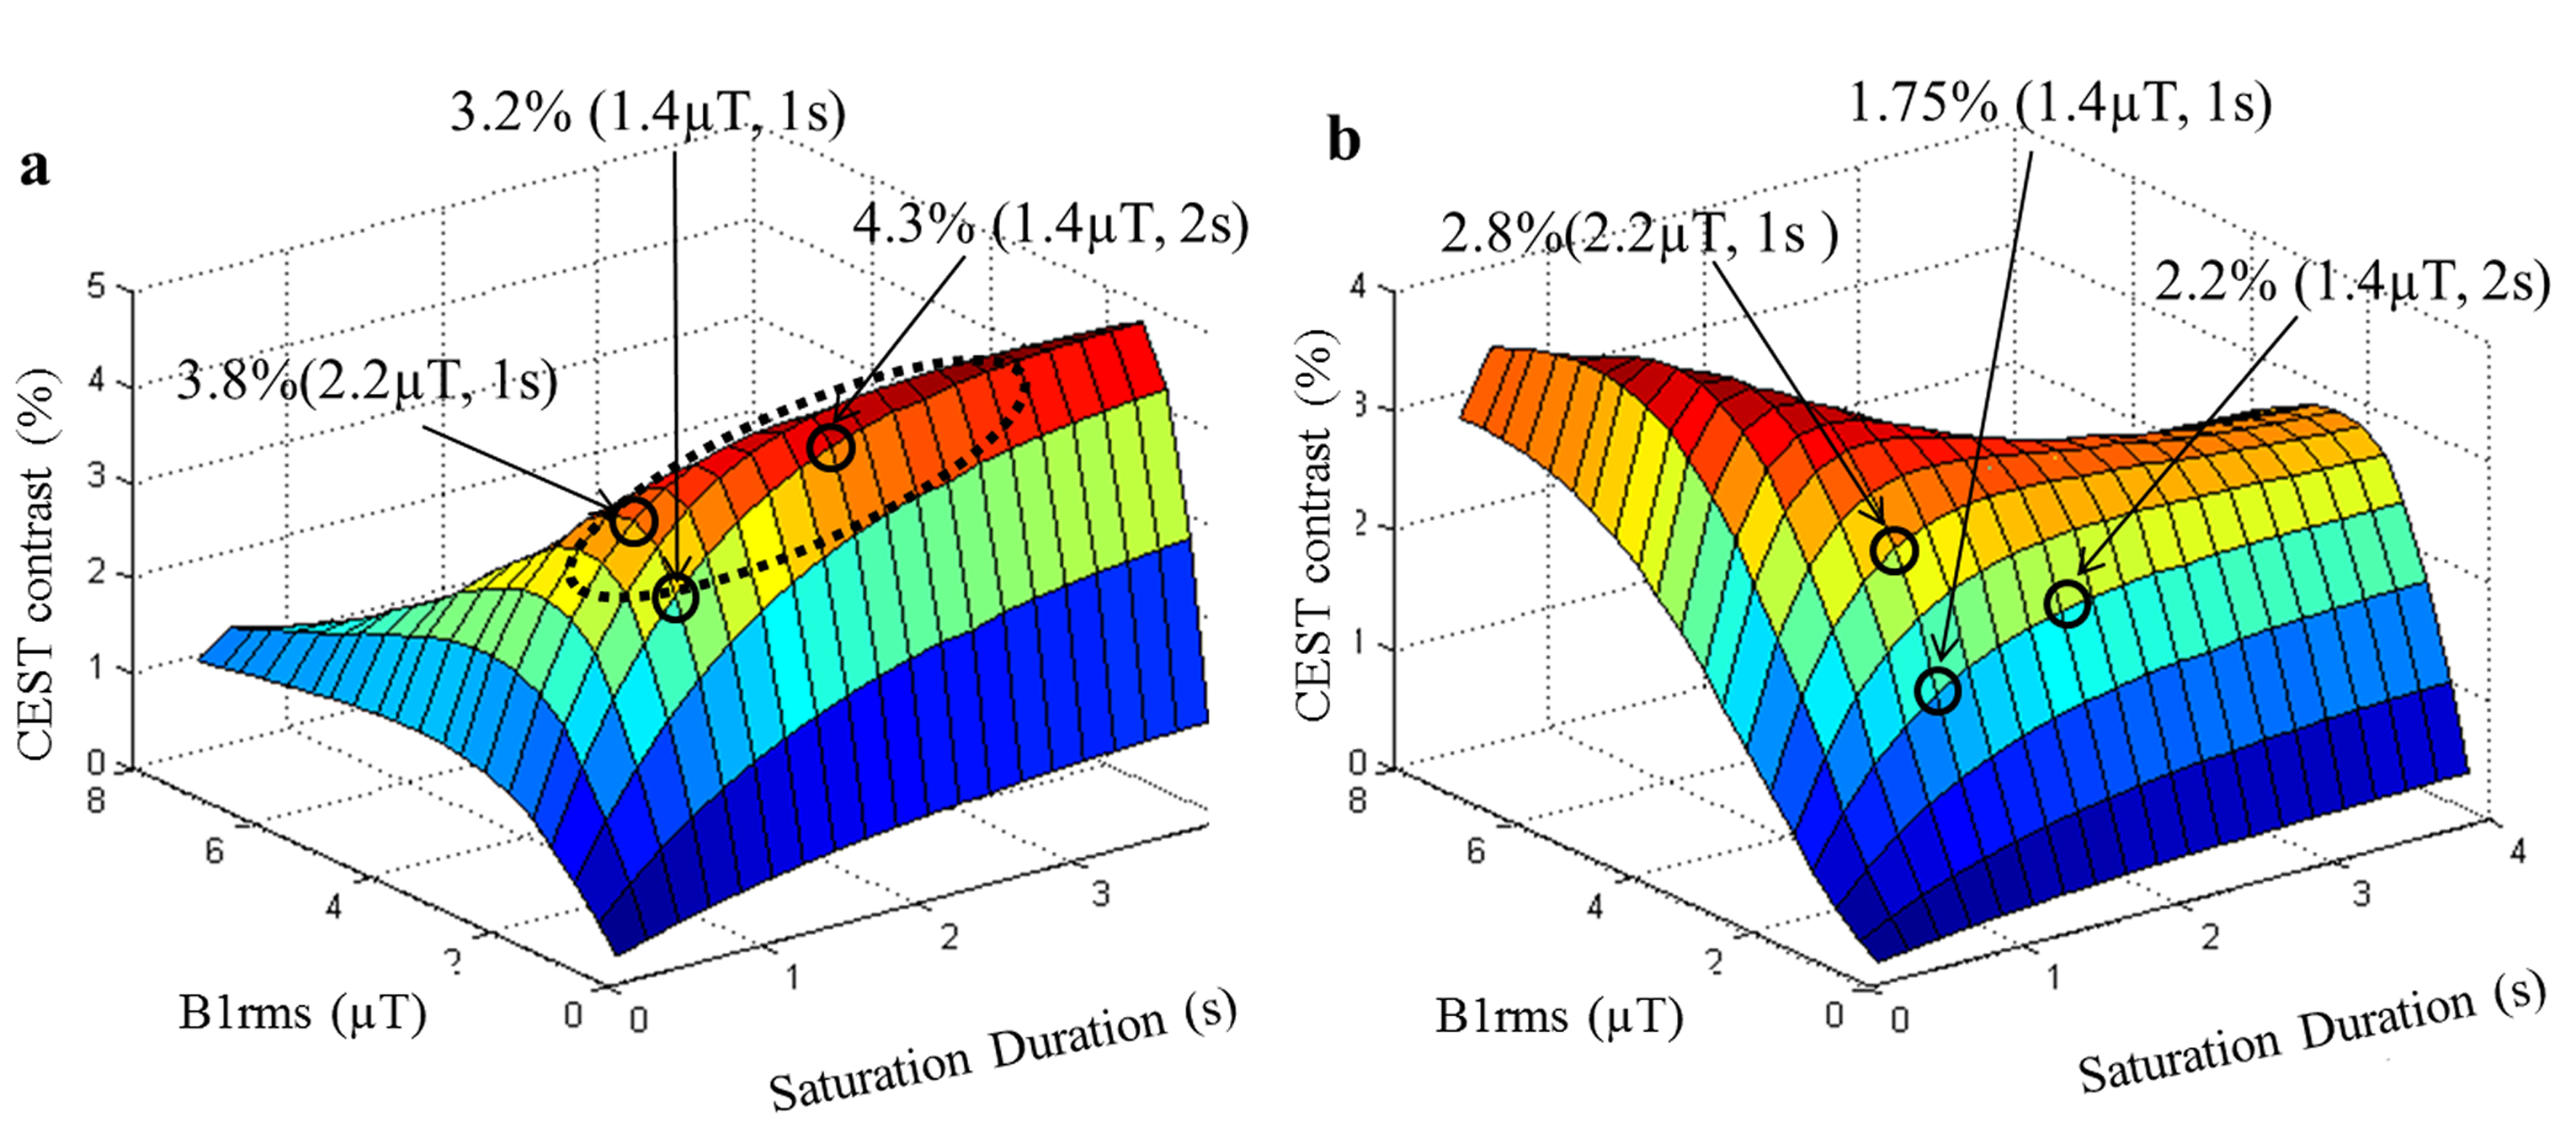
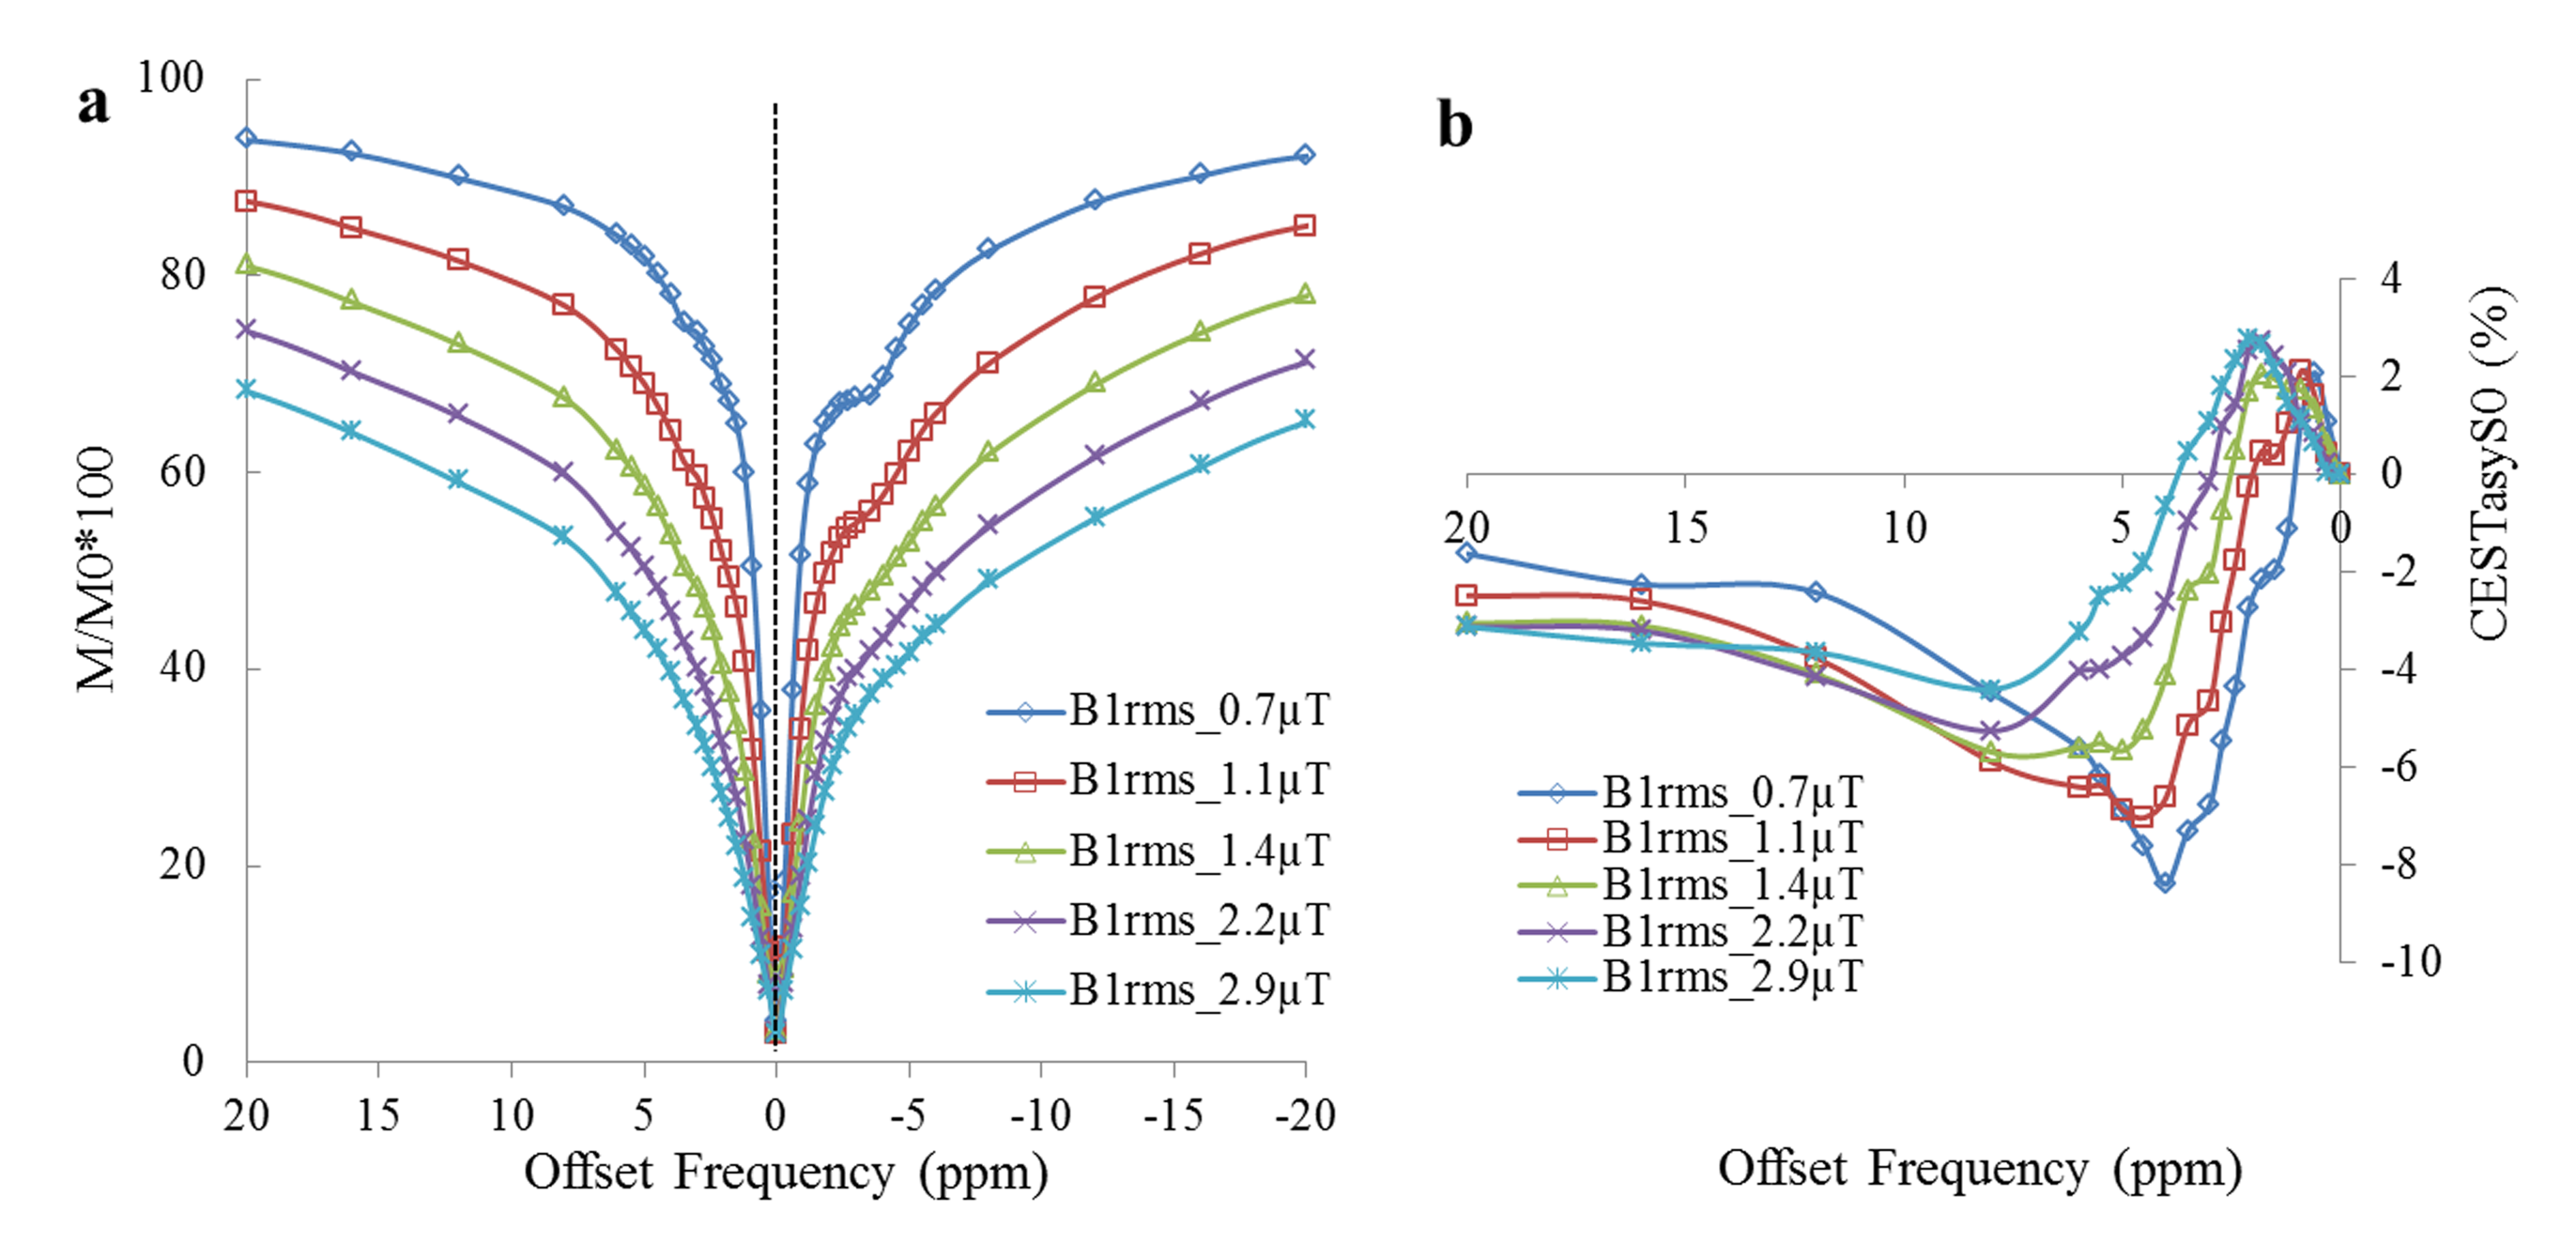
Surface plot(Fig 1a) highlights an optimum region for selection of saturation parameters for maximum Cr-weighted CEST contrast with minimal contribution from other brain metabolites and hardware constraints. Simulations showed that there is ~30% overlap to Cr-weighted CEST from other known metabolites for B1rms of 1.4µT and 2s. Figure 2 shows Z-spectra data and asymmetry plots from human brain. Z-spectra were fitted well using both Model-1 and Model-2. Figure-3 show an example of fitting z-spectra using Model-2. The width of individual CEST components was quite large for Model-1 compared to Model-2. Voxelwise fitting of Z-spectra data from the brain resulted in the computation of various maps which are shown in Figure 4. Cr-weighted CEST contrast, at B1rms=1.45µT and 2s, obtained using fitting was ~6.7±0.8% in GM and ~6.0±0.4% in WM, compared to 1.22±0.58% and 0.24±0.36% respectively using asymmetry analysis. CrCEST maps were reproducible(Coefficient-of-variations<5%).Discussion:
Cr-weighted CEST map generated using CESTasy from the brain represents mixed contrast with contribution from other metabolites as well as rNOE effect and provides low sensitivity. Simulations provided an estimate for optimum range of saturation parameters, which were used for acquiring brain CEST data. Z-spectral fitting approach enabled computation of individual components, and hence mitigated the contamination from rNOE effect to CrCEST. CEST map computed using fitting approach is less sensitive to B0 inhomogeneity and doesn’t require a separate B0 map. In summary, it is feasible to perform Cr-weighted CEST mapping in human brain at 7T. Imaging protocol and fitting approach proposed in the current study can be used for acquiring patient data and computing Cr-weighted CEST contrast.Acknowledgements
The Authors acknowledge internal seed grant from Indian Institute of Technology Delhi. This project was partially supported by National Institute of Biomedical Imaging and Bioengineering of the NIH through Grant Number P41-EB015893, R21-EB023516, and Centre for Magnetic Resonance and Optical Imaging (CMROI), University of Pennsylvania.References
1. Tong Z, et al. In vivo quantification of the metabolites in normal brain and brain tumors by proton MR spectroscopy using water as an internal standard. Magn. Reson. Imaging 2004;22:1017–1024.
2. Tabrizi SJ, et al. Creatine therapy for Huntington’s disease: clinical and MRS findings in a 1-year pilot study. Neurology 2003;61:141–2.
3. Haris M, et al. Exchange rates of creatine kinase metabolites: Feasibility of imaging creatine by chemical exchange saturation transfer MRI. NMR Biomed. 2012;25:1305–1309.
4. Kogan F, et al. Method for high-resolution imaging of creatine in vivo using chemical exchange saturation transfer. Magn. Reson. Med. 2014;71:164–172.
5. Kogan F, et al. In vivo chemical exchange saturation transfer imaging of creatine (CrCEST) in skeletal muscle at 3T. J. Magn. Reson. Imaging 2014;40:596–602.
6. Haris M, et al. A technique for in vivo mapping of myocardial creatine kinase metabolism. Nat. Med. 2014;20:209–214.
7. Cai K, et al. CEST signal at 2ppm (CEST at 2ppm) from Z-spectral fitting correlates with creatine distribution in brain tumor. NMR Biomed. 2015;28:1–8.
8. Zhang XY, et al. Assignment of the molecular origins of CEST signals at 2ppm in rat brain. Magn. Reson. Med. 2017.
9. Singh A, et al. A Study on CrCEST Mapping in Human Brain at 7T MRI. (Proceedings of ISMRM: Annual Meeting & Exhibition-2016 May7-13, Singapore. PN-1510).
10. Zhou IY, et al. Quantitative chemical exchange saturation transfer (CEST) MRI of glioma using Image Downsampling Expedited Adaptive Least-squares (IDEAL) fitting. Sci. Rep. 2017;7:84.
11. Cai K, et al. Magnetic resonance imaging of glutamate. Nat. Med. 2012;18:302–306.
Figures