0559
A Novel MR Fingerprinting Approach for Fast Quantitative Chemical Exchange Saturation Transfer MRI Analysis by Subgrouping Proton Exchange Models (CEST-SPEM)1Russell H Morgan Department of Radiology and Radiological Science, Johns Hopkins University, Baltimore, MD, United States, 2F.M. Kirby Research Center for Functional Brain Imaging, Kennedy Krieger Institute, Baltimore, MD, United States
Synopsis
Most current amide proton transfer (APT) imaging protocols, a variant of CEST-MRI, are essentially not quantitative and acquire qualitative APT-weighted images, limiting pH or concentration specificity. Herein, we propose a novel dictionary-free MRF concept to allow APT quantification by subgrouping proton exchange models (CEST-SPEM). The results of numerical phantom studies demonstrate that CEST-SPEM can enable absolute quantification of the APT exchange rate and concentration on 3T clinical scanners. The same model used for in vivo allows fast quantification of exchange rates and apparent concentrations for the combined solute components at the CEST frequency studied.
Introduction
CEST-MRI contrast is typically contaminated by NOE and some other confounders, thus limiting measured pH or concentration specificity1,2. In addition, different research groups have reported varying results due to the use of different experimental parameters, such as RF saturation power and pulse length. Currently, the CEST community has a great interest in quantifying labile proton concentrations and exchange rates3-7. MR fingerprinting (MRF) is a new approach for efficient multiple tissue parameter mapping via dictionary matching of measured signals to a set of simulated signals8. When multiple components for CEST-MRI are to be taken into account, however, it requires even more parameters that have to be matched from the dictionary, leading to inaccurate quantification results. Furthermore, the size of the database would have to be dramatically increased; thus, the construction of a huge database and an exhaustive search would be inevitable. Here, we developed a dictionary-free MRF technique to allow CEST quantification with a reduced data set by using a simplifying assumption by subgrouping proton exchange models (CEST-SPEM), taking APT as an example, into two-pool (water/semisolid macromolecules) and three-pool (water/semisolid macromolecules/amide protons) models. In addition, carefully designed frequency sampling and RF power variation further ensured a possibility for quantification of group-based determination of average exchange rates and apparent concentrations at a certain CEST frequency.Methods
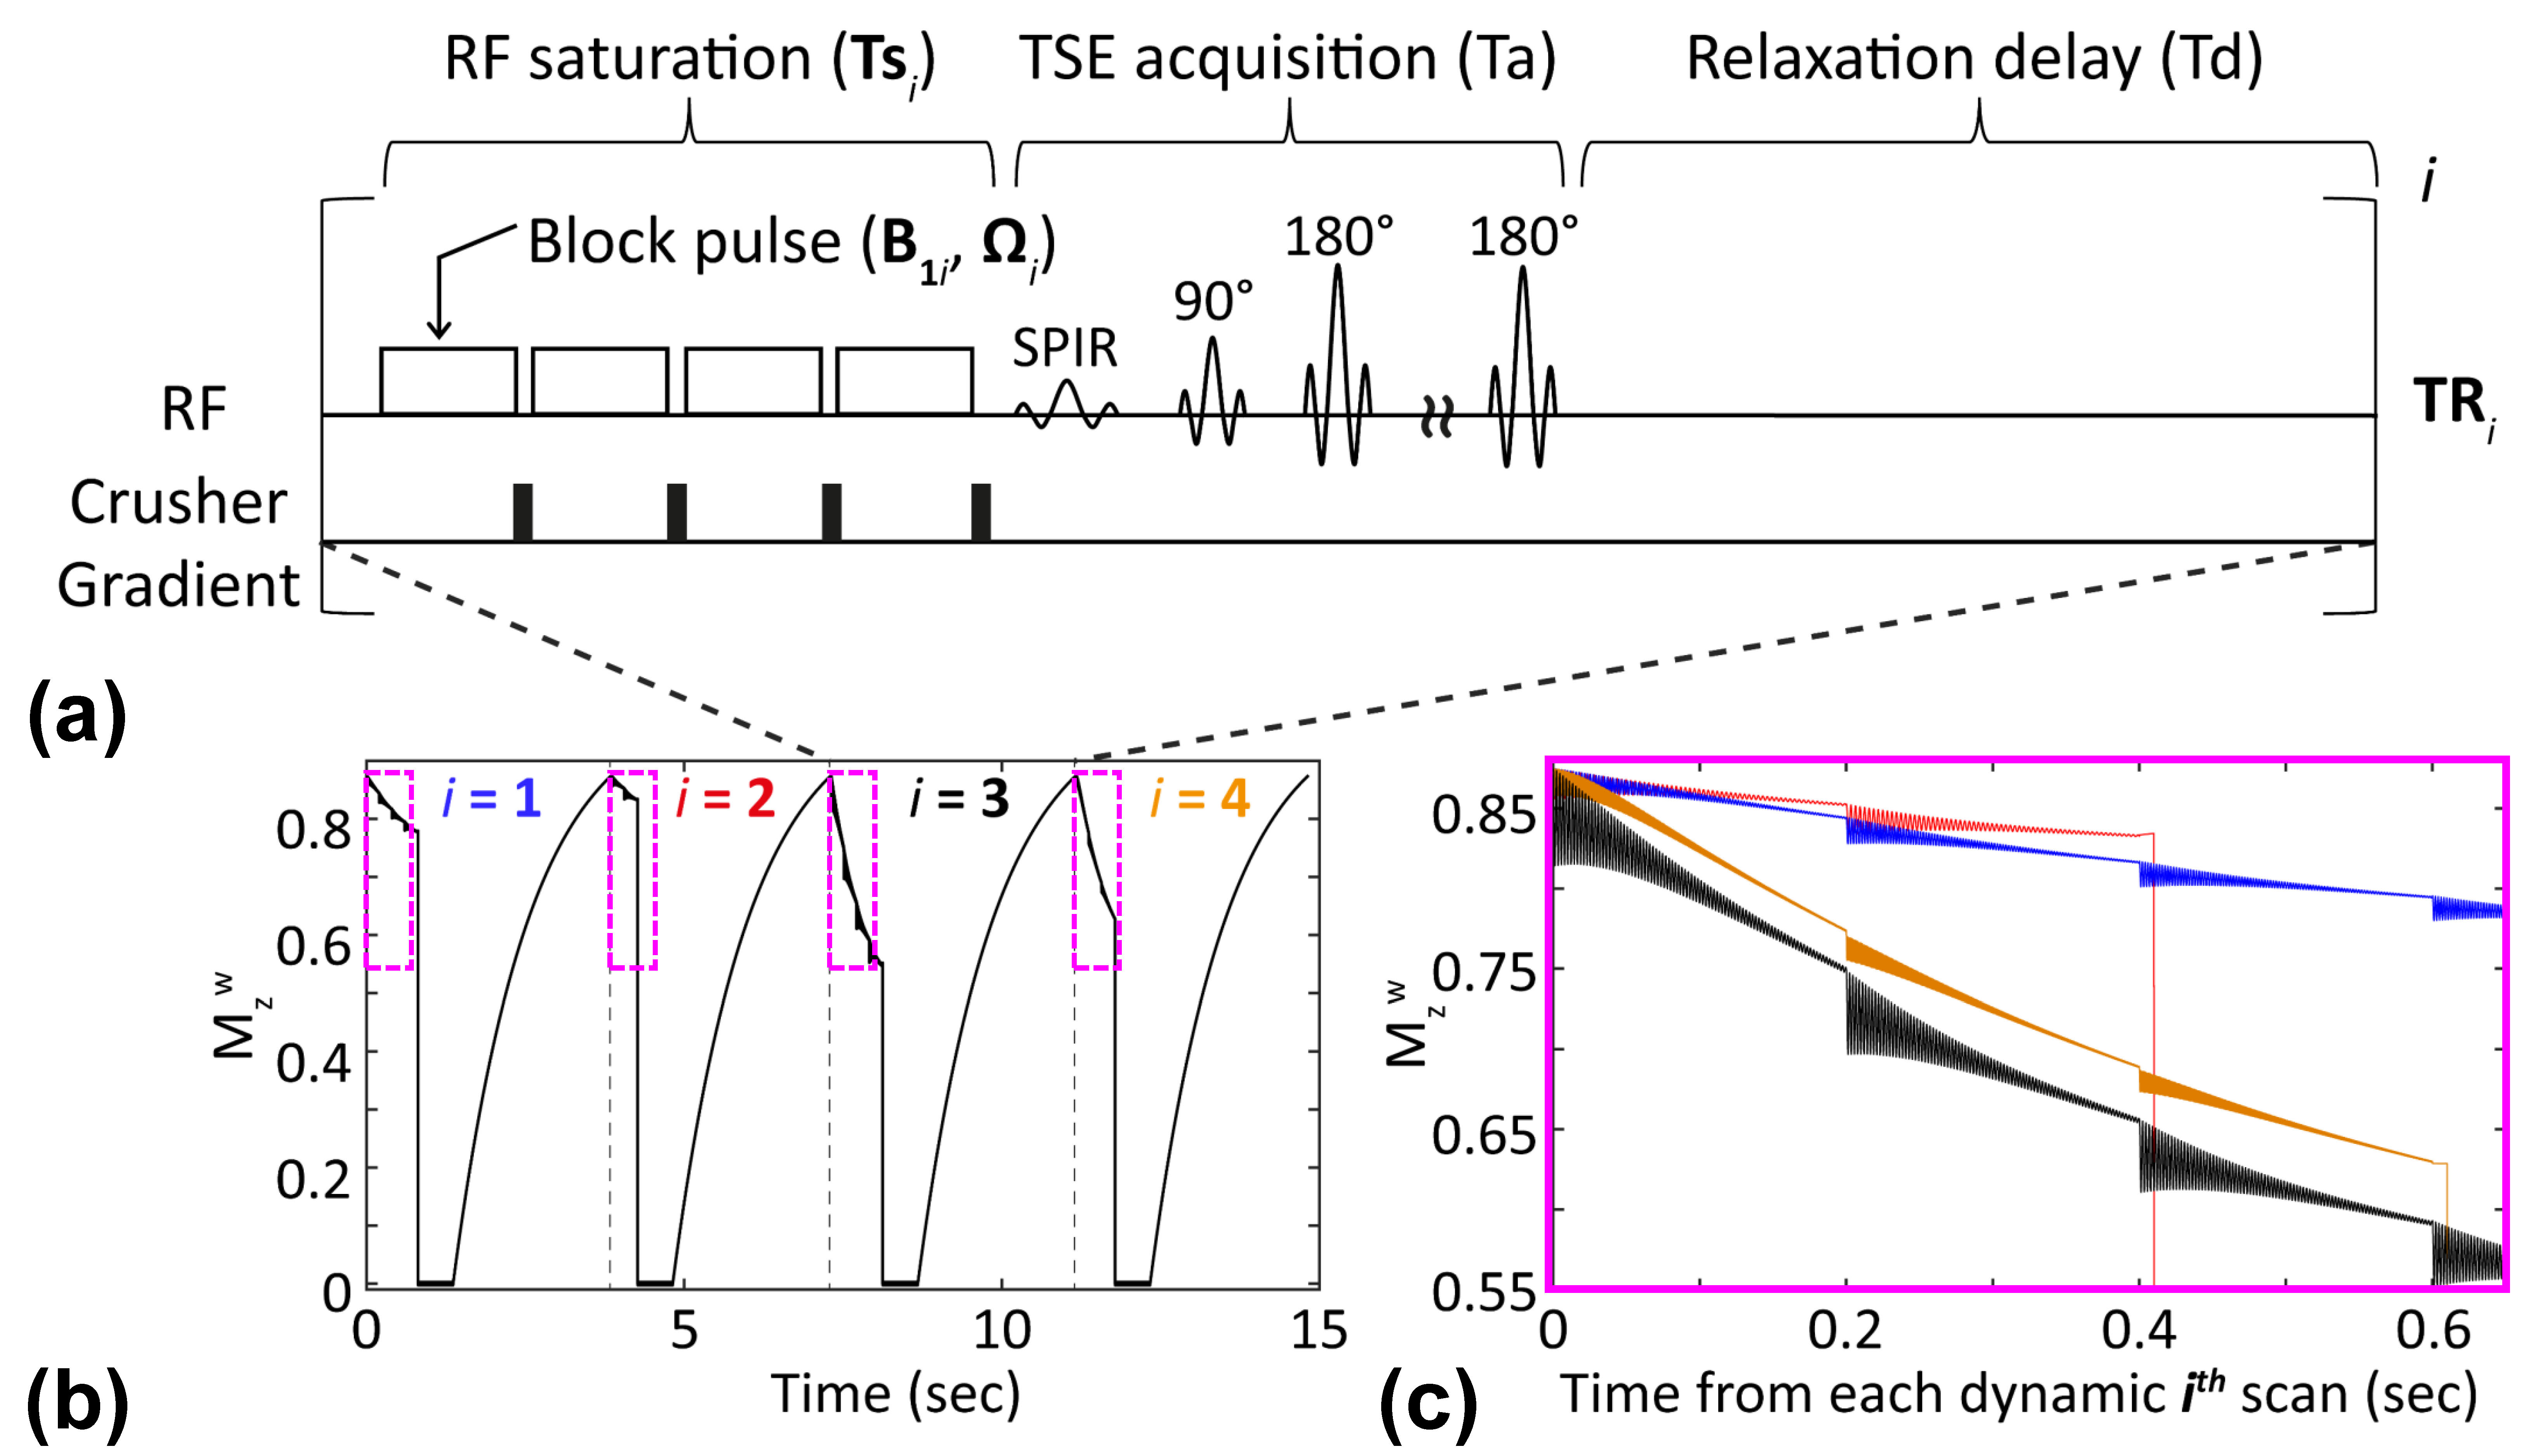
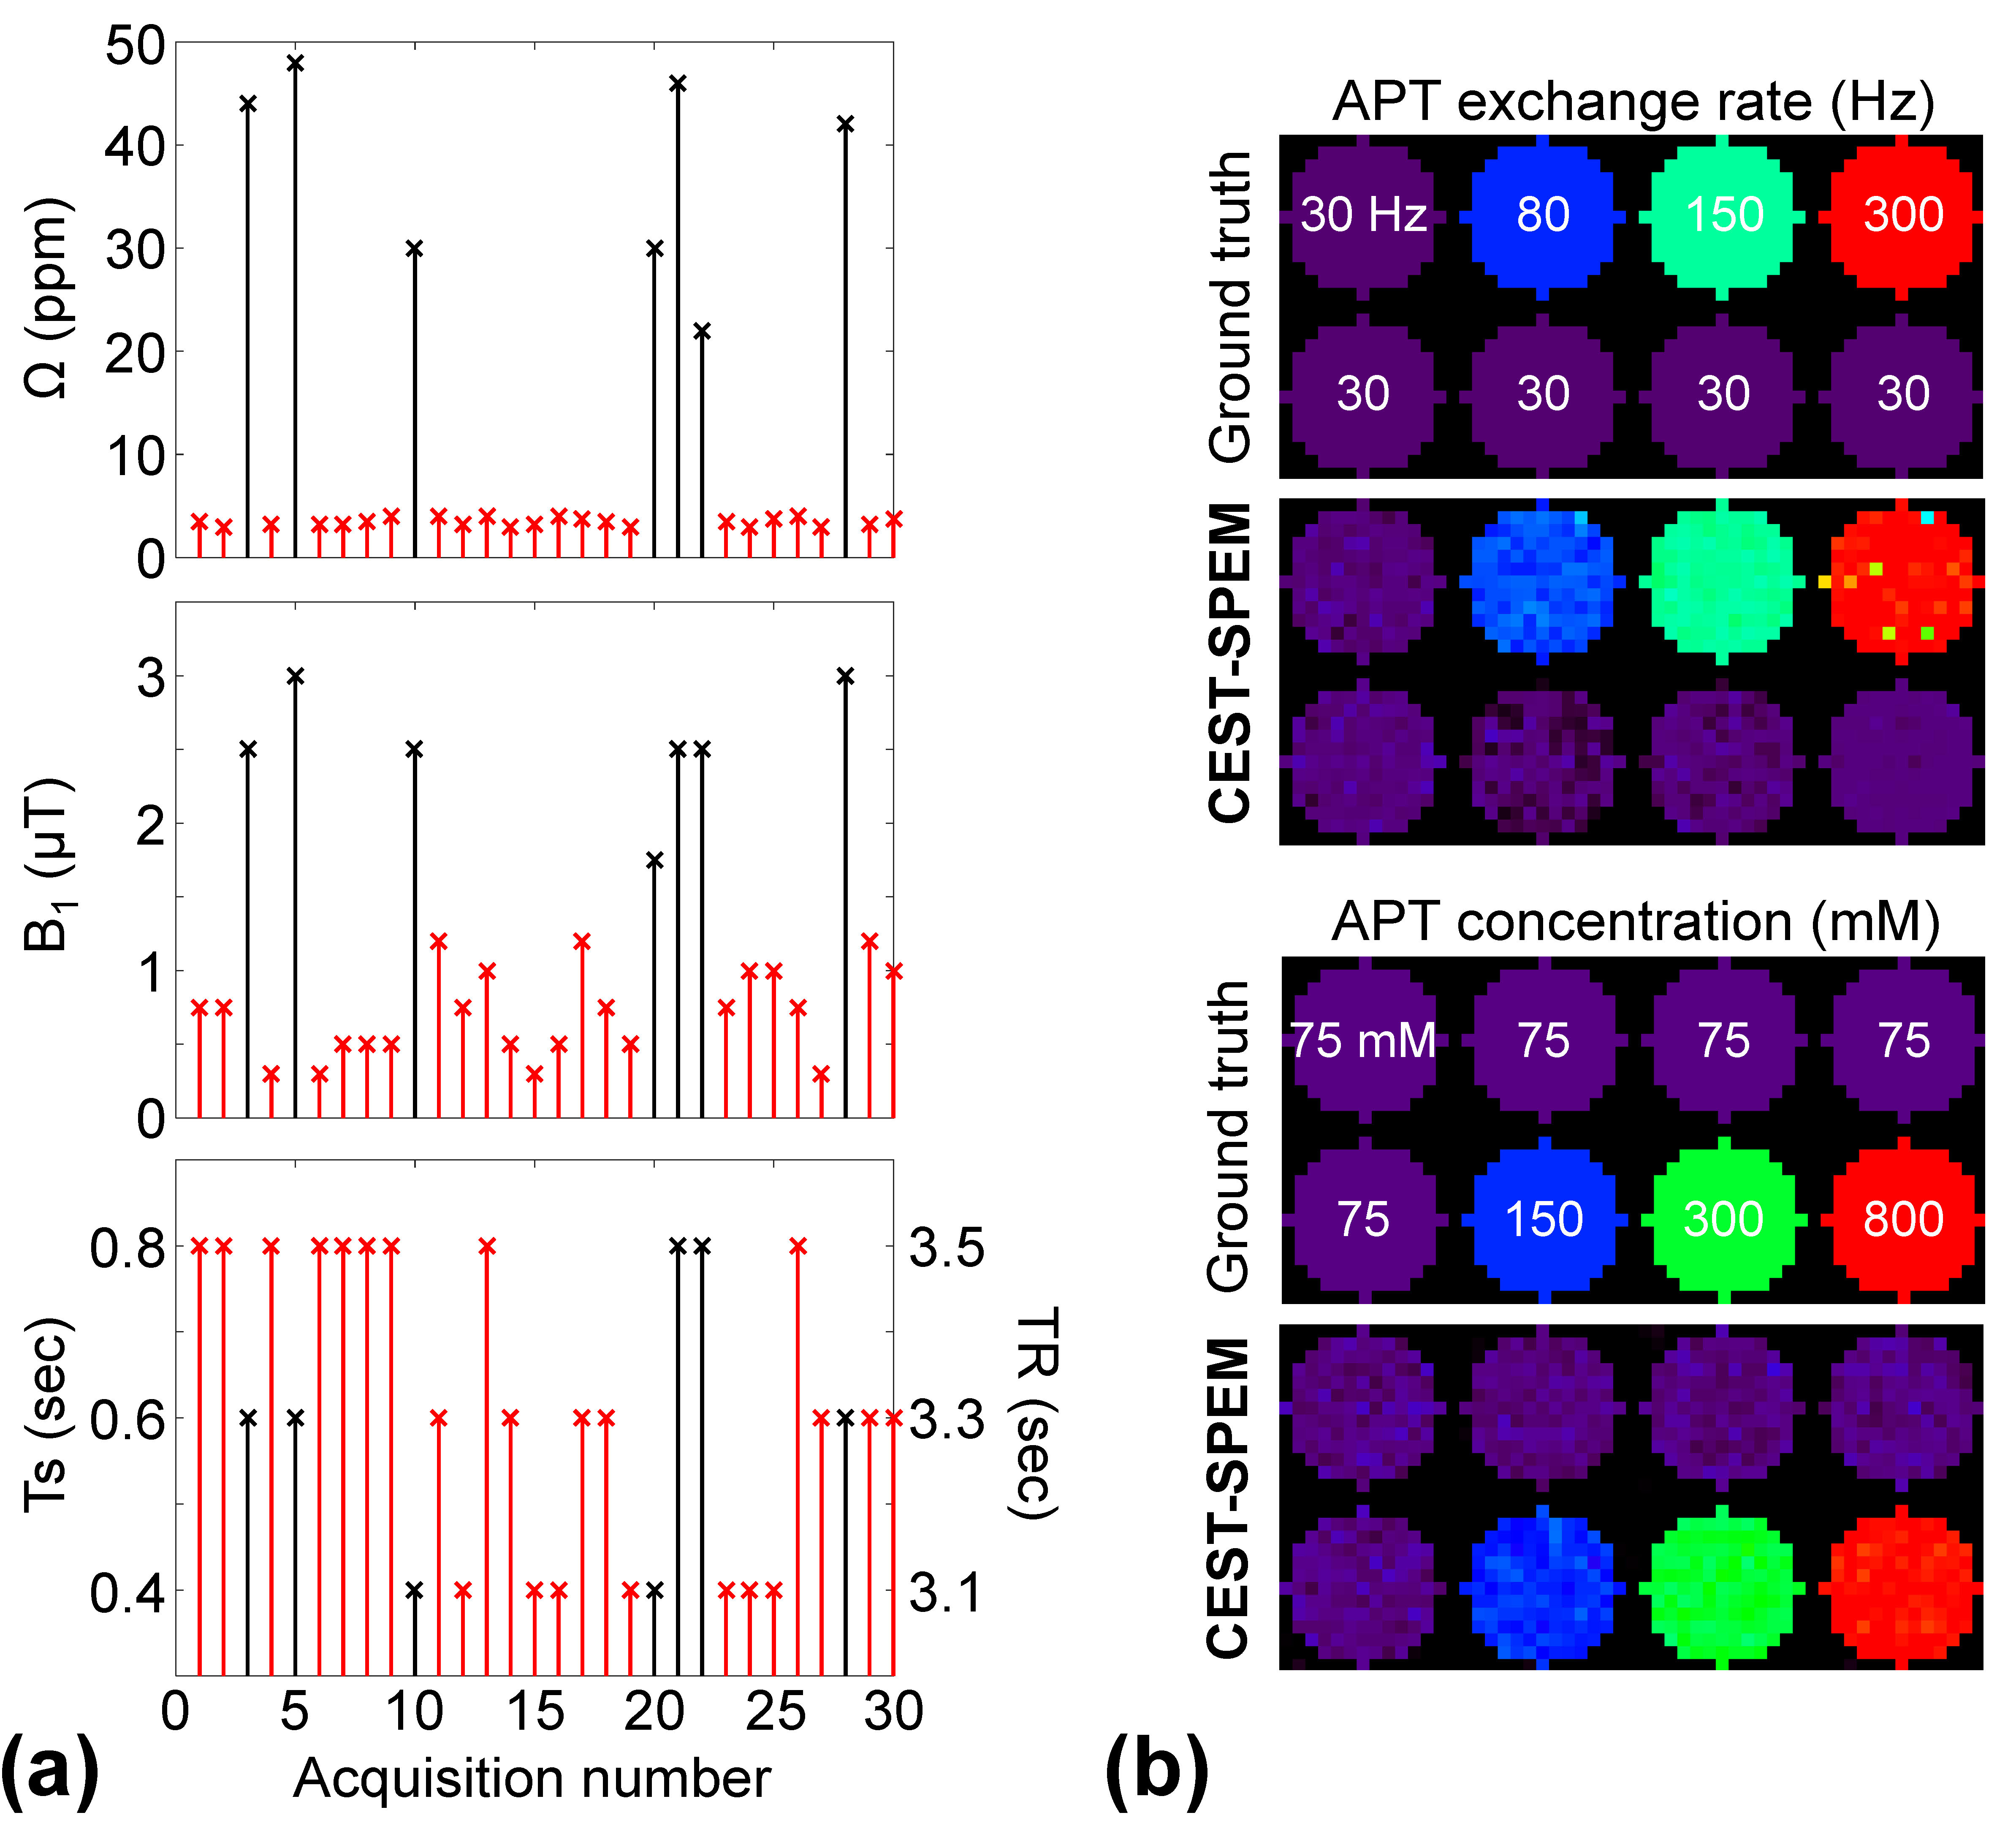
In the CEST-SPEM framework, RF saturation frequency offset (Ω), power (B1), duration (Ts), and TR were varied in a pseudorandom fashion throughout the saturation and acquisition (Fig. 1). TRs were varied according to Ts, but relaxation delay (Td) and TSE acquisition (Ta) were fixed (TR=Ts+Ta+Td). CEST-SPEM images consisted of two distinct datasets: (i) two-pool MTC data with far off-resonance frequency offsets between 10 ppm and 50ppm (black crosses in Fig. 2a) to avoid possible downfield CEST signal contributions; and (ii) three-pool APT data with saturation frequency offsets between 3ppm and 4ppm (red crosses in Fig. 2a). The two-pool parameters were incorporated into the three-pool model as prior known information, reducing the number of parameters and fitting uncertainty errors. In addition, relatively low RF powers (0.5μT<B1<1.2μT) were applied in an attempt to isolate APT signals from the broad rapidly exchangeable protons at 2-3 ppm9-11. The proposed CEST-SPEM was first tested on Bloch equation-based digital phantoms with appropriate SNR levels. For in-vivo studies, three healthy volunteers were scanned on a Philips 3T MRI scanner after informed consent was obtained in accordance with the IRB requirement. Water saturation shift-referencing12 and dual-TR data were additionally acquired and incorporated into CEST-SPEM reconstruction framework for B0 and B1 corrections.Results and Discussion
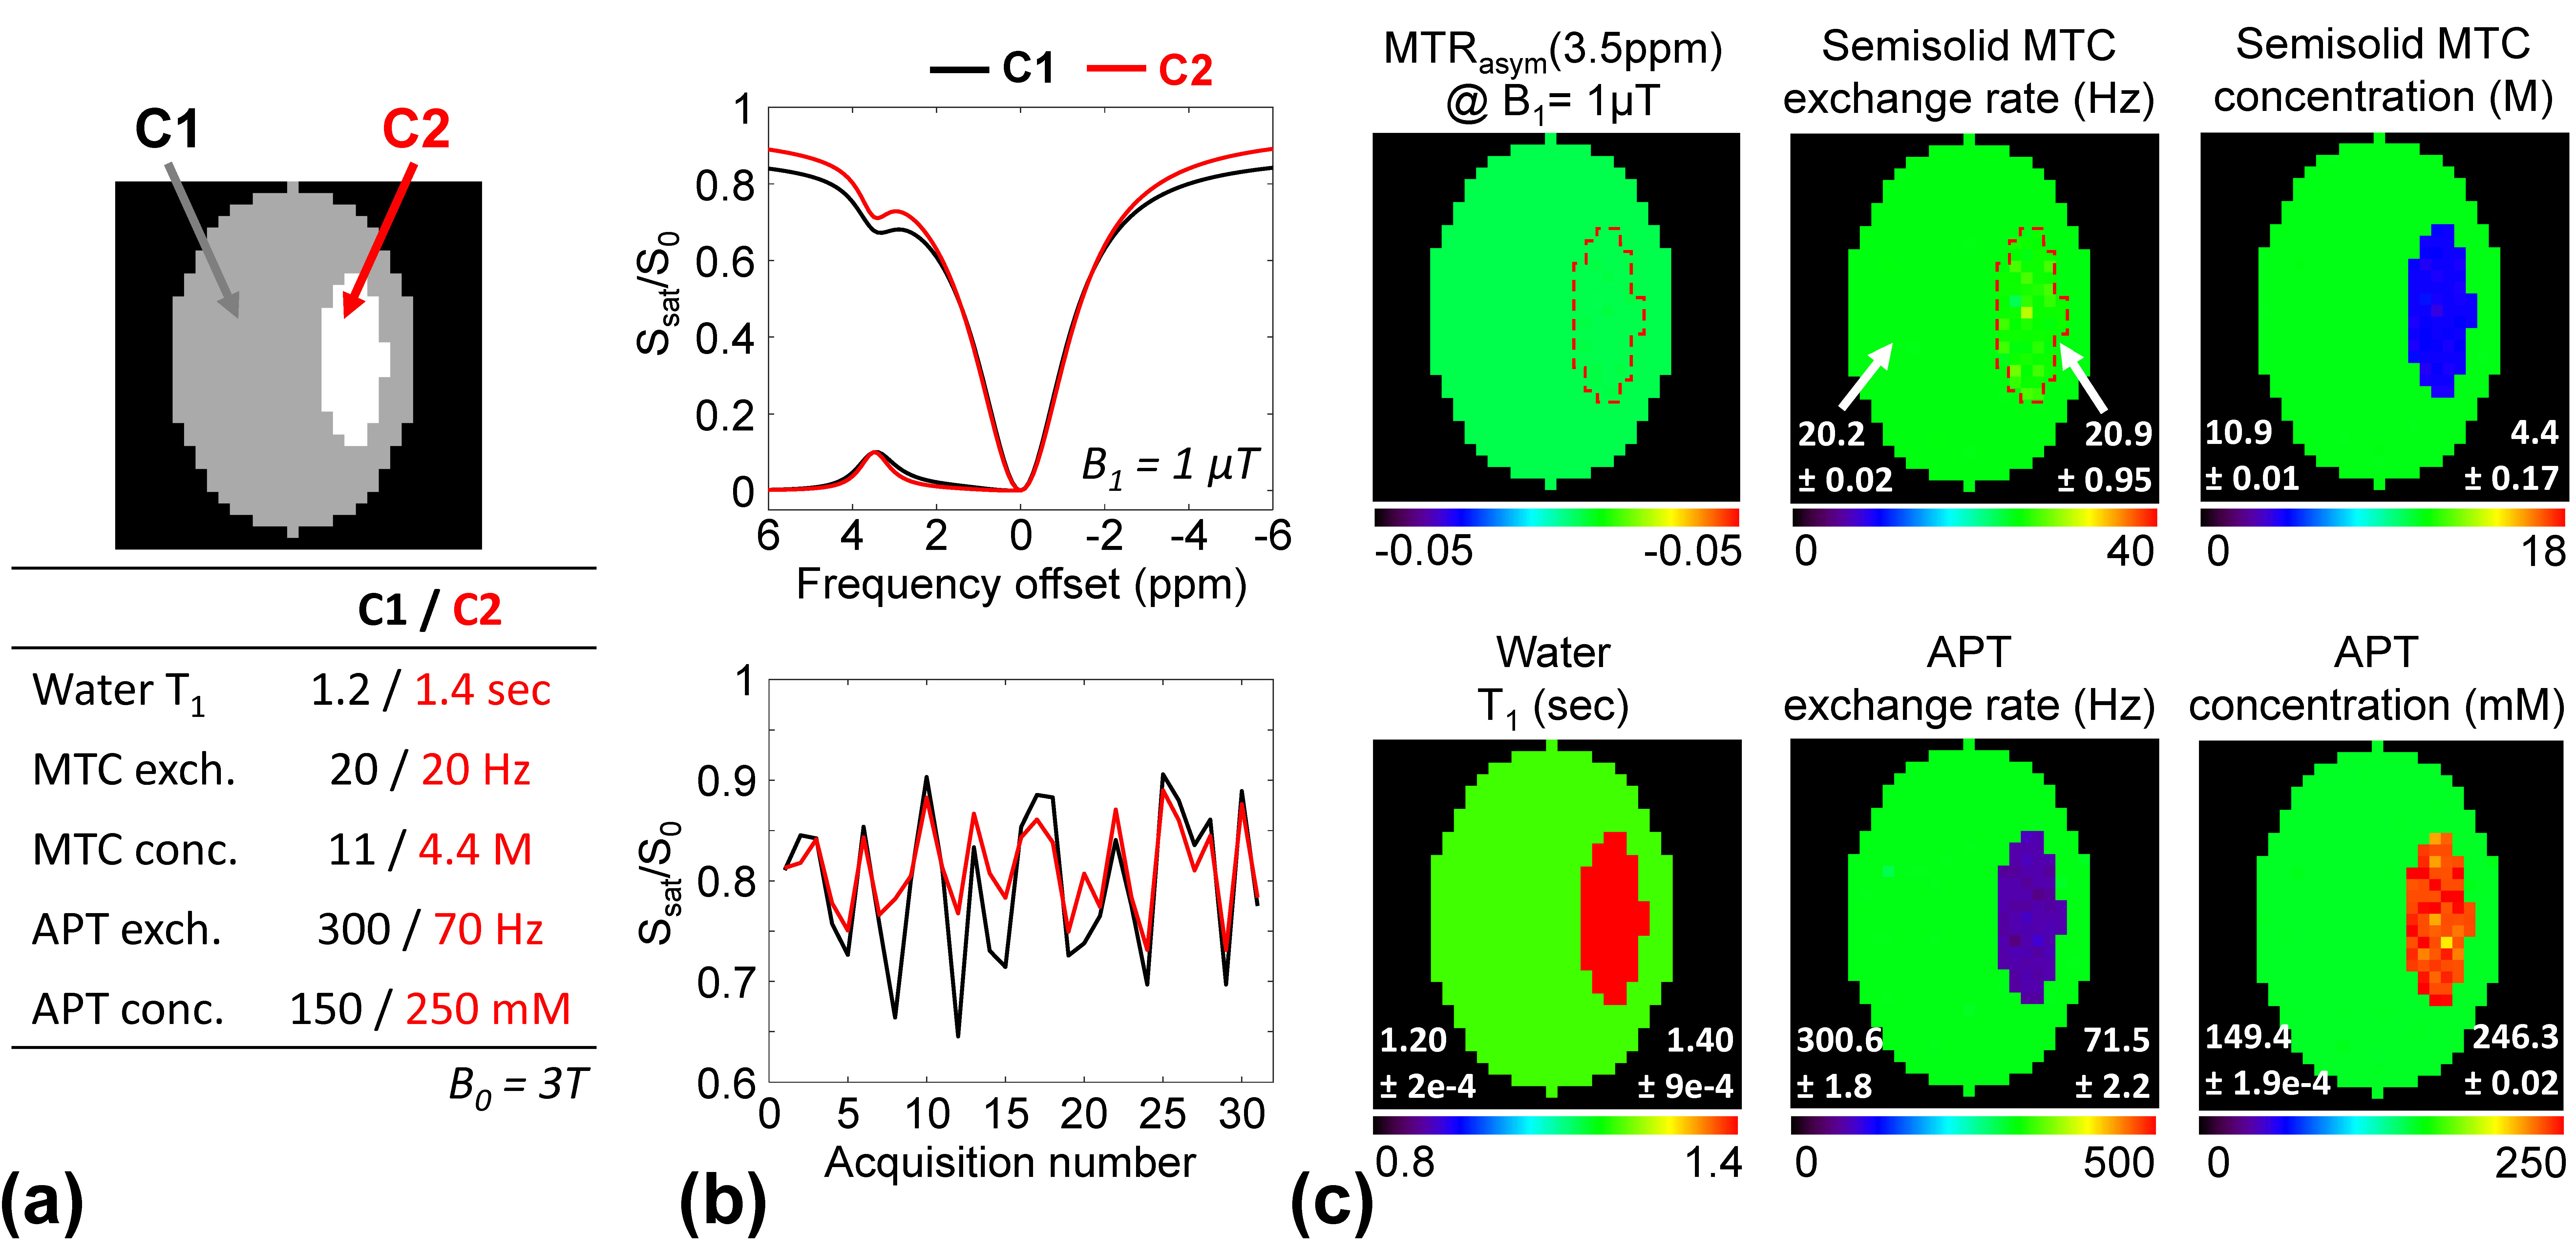
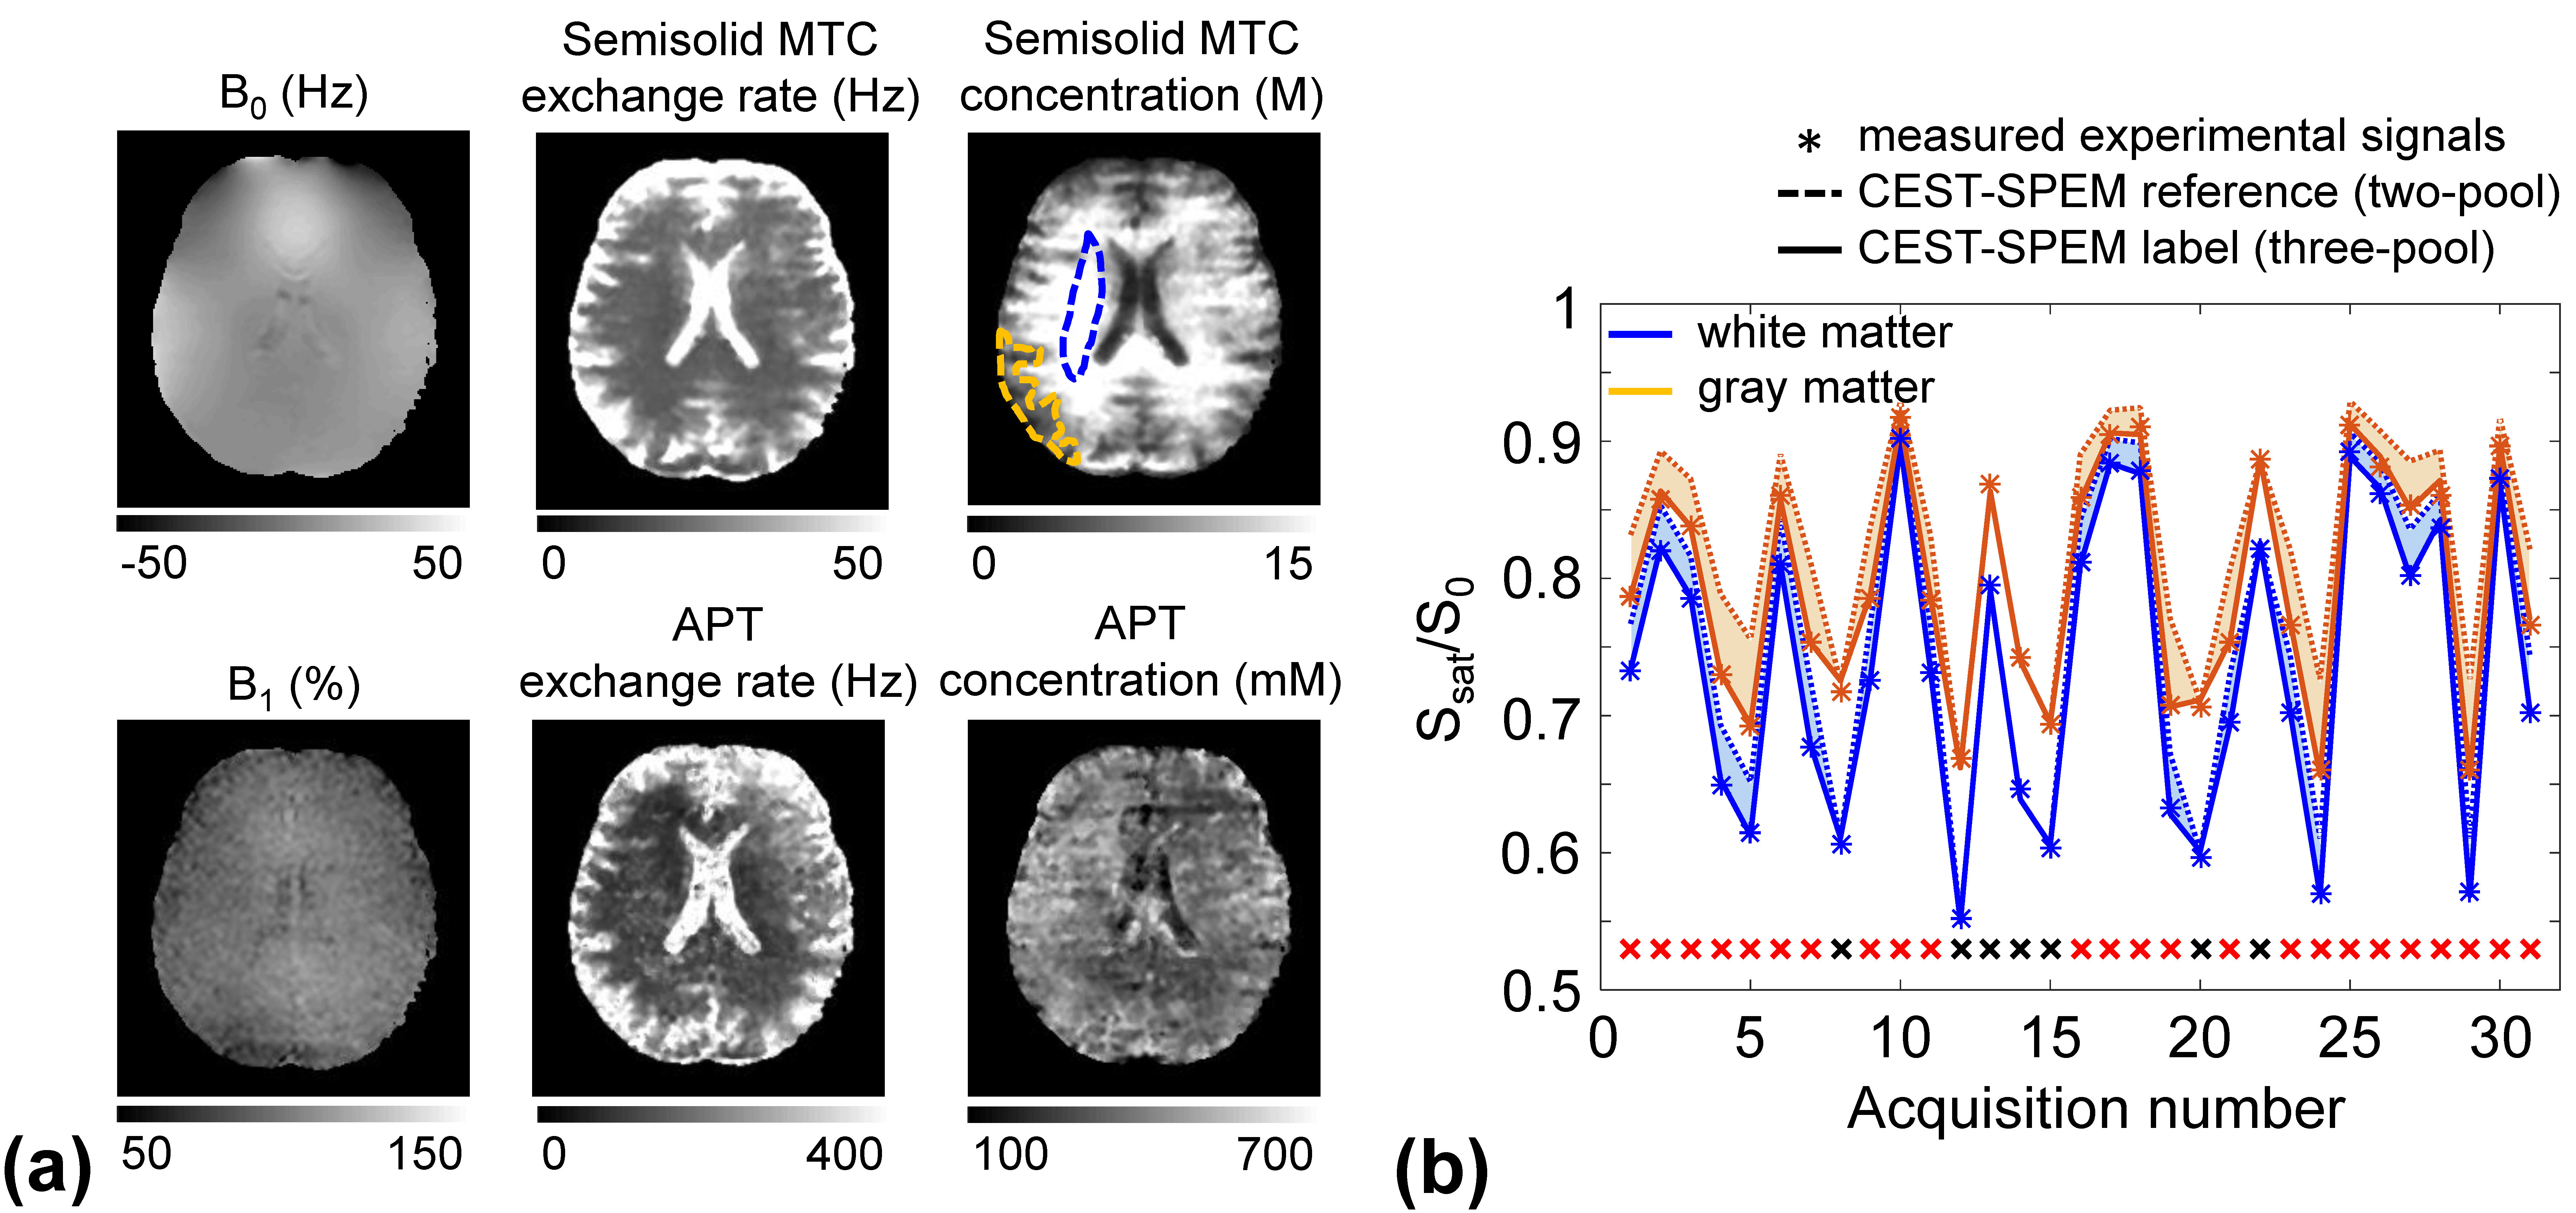
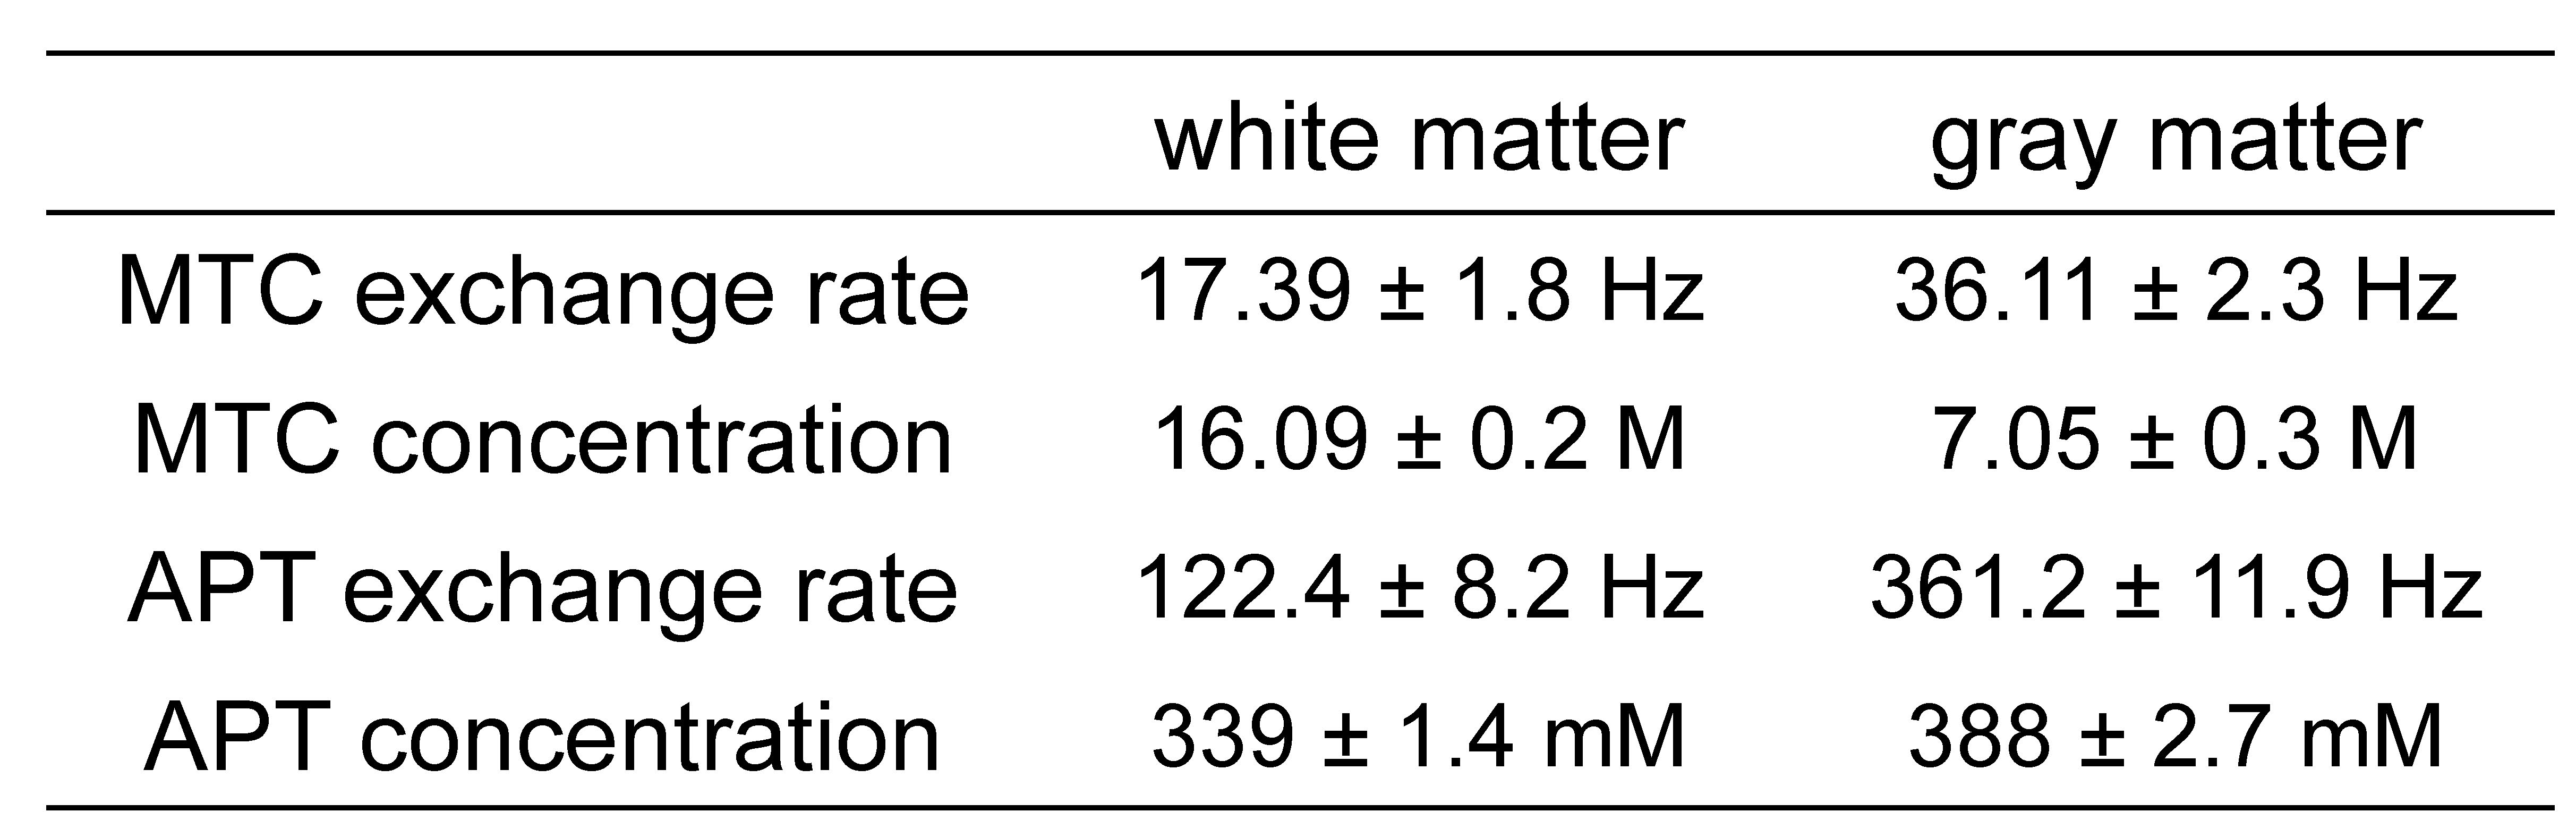
Based on our numerical phantom studies at an appropriate SNR level (Fig. 2b), excellent agreement was observed for CEST-SPEM and the known APT exchange rate and concentration (ground truth). Fig. 3 shows the CEST-SPEM reconstructed quantitative maps of the simulated phantom, which are compared with the conventional MTRasym(3.5ppm) (or APTw) image. There was a negligible APTw signal difference between two compartments (Fig. 3b-c), even though they had distinct water, MTC, and APT parameters as shown in Fig. 3a. However, the pseudorandomized RF saturation encoding generated unique CEST-SPEM signal evolution profiles (Fig. 3b, bottom), and accurate parameter maps (Fig. 3c) were successfully decoded, which are in excellent agreement with the ground truth values. Of course, in vivo the third subgroup has more than one component, but the average exchange rate and apparent concentration can be determined for the subgroup. Quantitative parameter maps and values of the healthy volunteer brain are shown in Fig. 4 and Table 1. The gray matter (GM) and white matter (WM) have very different MTC/APT concentrations and exchange rates. The APT concentration of GM (388 mM) is somewhat higher than that of WM (339 mM), which is in line with observed APT effects (shaded areas in Fig. 4b) by subtracting three-pool label signals from two-pool reference signals. Interestingly, the APT exchange rate (~300 Hz) quantified by CEST-SPEM was relatively faster compared to the value (~28 Hz) reported in the previous rat animal studies1,13 at 4.7 T with water exchange spectroscopy and the apparent concentration was also higher (previously 72 mM), indicating that multiple CEST components probably contaminate the signal at the APT frequency.Conclusions
We have developed a quantitative CEST-SPEM technique under the assumption of a single CEST pool at a certain frequency. The present CEST-SPEM scan took just 2 min 50 sec (including B0 and B1) to obtain apparent APT exchange rate and concentration maps, which may be applicable to many clinical applications. Furthermore, this quantitative approach could provide some insight into the origin of the APTw image contrast in malignant gliomas showing abundant intracellular mobile proteins and a reversed pH gradient between alkaline intracellular and acidic extracellular compartments.Acknowledgements
This work was supported in part by grants from the National Institutes of Health (R01EB009731, R01CA166171, R01EB015032, and P41EB015909).References
1. Zhou J, Payen J, Wilson DA, Traystman RJ, van Zijl PCM. Using the amide proton signals of intracellular proteins and peptides to detect pH effects in MRI. Nature Med 2003;9:1085-1090.
2. van Zijl PCM, Lam WW, Xu J, Knutsson L, Stanisz GJ. Magnetization Transfer Contrast and Chemical Exchange Saturation Transfer MRI. Features and analysis of the field-dependent saturation spectrum. Neuroimage 2017:doi: 10.1016/j.neuroimage.2017.1004.1045.
3. McMahon MT, Gilad AA, Zhou J, Sun PZ, Bulte JWM, van Zijl PCM. Quantifying exchange rates in chemical exchange saturation transfer agents using the saturation time and saturation power dependencies of the magnetization transfer effect on the magnetic resonance imaging signal (QUEST and QUESP): pH calibration for poly-L-lysine and a starburst dendrimer. Magn Reson Med 2006;55:836-847.
4. Sun PZ, Wang Y, Dai Z, Xiao G, Wu R. Quantitative chemical exchange saturation transfer (qCEST) MRI--RF spillover effect-corrected omega plot for simultaneous determination of labile proton fraction ratio and exchange rate. Contrast Media Mol Imaging 2014;9:268-275.
5. Yadav NN, Jones CK, Hua J, Xu J, van Zijl PC. Imaging of endogenous exchangeable proton signals in the human brain using frequency labeled exchange transfer imaging. Magn Reson Med 2013;69:966-973.
6. Jones KM, Randtke EA, Yoshimaru ES, Howison CM, Chalasani P, Klein RR, Chambers SK, Kuo PH, Pagel MD. Clinical Translation of Tumor Acidosis Measurements with AcidoCEST MRI. Mol Imaging Biol 2017;19:617-625.
7. Zaiss M, Xu J, Goerke S, Khan IS, Singer RJ, Gore JC, Gochberg DF, Bachert P. Inverse Z-spectrum analysis for spillover-, MT-, and T1 -corrected steady-state pulsed CEST-MRI--application to pH-weighted MRI of acute stroke. NMR Biomed 2014;27:240-252.
8. Ma D, Gulani V, Seiberlich N, Liu K, Sunshine JL, Duerk JL, Griswold MA. Magnetic resonance fingerprinting. Nature 2013;495:187-192.
9. Cai KJ, Haris M, Singh A, Kogan F, Greenberg JH, Hariharan H, Detre JA, Reddy R. Magnetic resonance imaging of glutamate. Nature Med 2012;18:302-306.
10. Haris M, Nanga RP, Singh A, Cai K, Kogan F, Hariharan H, Reddy R. Exchange rates of creatine kinase metabolites: feasibility of imaging creatine by chemical exchange saturation transfer MRI. NMR Biomed 2012;25:1305-1309.
11. Zhang XY, Xie J, Wang F, Lin EC, Xu J, Gochberg DF, Gore JC, Zu Z. Assignment of the molecular origins of CEST signals at 2 ppm in rat brain. Magn Reson Med 2017;78:881-887.
12. Kim M, Gillen J, Landman BA, Zhou J, van Zijl PC. Water saturation shift referencing (WASSR) for chemical exchange saturation transfer (CEST) experiments. Magn Reson Med 2009;61:1441-1450.
13. van Zijl PCM, Zhou J, Mori N, Payen J, Mori S. Mechanism of magnetization transfer during on-resonance water saturation. A new approach to detect mobile proteins, peptides, and lipids. Magn Reson Med 2003;49:440-449.
Figures