0558
Novel contrasts at +2.7 ppm, +1.2 ppm, and -1.7 ppm investigated in vivo with high spectral resolution CEST MRI in the human brain at 9.4TMark Schuppert1, Kai Herz1, Anagha Deshmane1, and Moritz Zaiss1
1High-field Magnetic Resonance Center, Max Planck Institute for Biological Cybernetics, Tuebingen, Germany
Synopsis
Using volumetric snapshot-GRE CEST MRI at 9.4T with high frequency sampling, we were able to separate novel CEST peaks at +2.7 ppm, +1.2 ppm and -1.7 ppm reliably in the CEST-spectrum and showed creation of maps of these CEST MRI contrasts in the healthy human brain to be feasible in vivo.
INTRODUCTION
Chemical
exchange saturation transfer (CEST) enables an intrinsic MRI contrast of
solutes (i.e. metabolites) by proton exchange with the abundant water pool. Due
to the improved spectral resolution, as well as the higher SNR, and generally
longer T1 at higher B0 field strengths, CEST effects in tissue are
easier to detect, separate and associate with certain chemical shifts [1]. Application
of a volumetric snapshot-GRE CEST MRI optimized for 9.4T [3] showed the known
effects at +3.5 ppm, +2 ppm and -3.5 ppm, but also showed peaks at +2.7 ppm,
+1.2 ppm and -1.7 ppm well-separated for the first time in the human brain in
vivo.METHODS
CEST MRI measurements were performed on a 9.4T whole-body MRI scanner (MAGNETOM, Siemens, Erlangen, Germany) using an in-house build 16Tx/31Rx-coil [2] and a 3D GRE [3] sequence in three healthy volunteers at nominal B1 = 1.2 µT, 0.9 µT, and 0.6 µT. Simultaneous B0 and B1 mapping was performed using the WASABI method [4]. B0 correction was performed pixel-wise using the WASABI B0 map. The 3-point-Z-correction as described by Windschuh et al. [5] was used for B1-inhomogeneity correction. CEST contrast images were calculated from B0- and B1-corrected Z-spectra using Lorentzian difference (LD) MTR_LD as proposed by Jones et al. [6]. MTR_LD was subsequently fitted by a 5-pool Multi-Lorentzian model [5].RESULTS & DISCUSSION
Figure 1 a) and c) show the acquired highly-resolved Z-spectra at 9.4T for regions in gray and white matter at different effective B1 values. Scans of three different nominal B1 power levels and a B1 map (Figure 4) were used to create the B1-corrected Z-spectrum stack in the whole brain. Figure 1 b) and d) reveal that this correction leads to reproducible gray and white matter Z-spectra in three different volunteers. With validated feasibility and reproducibility more detailed analysis can be performed. By removal of the water and MT background by Lorentzian difference (LD) calculation, the individual CEST peaks can be investigated in the MTR_LD-spectrum in gray and white matter (Figure 2a and b). The +2.7 ppm and -1.7 ppm resonance could be detected reliably in 3 healthy volunteers. Figure 2c shows the averaged spectrum of the three volunteers, presented as mean ± standard deviation. Investigation of the according CEST contrast images (Figure 2d) consistently showed stronger gray matter contrast at positive irradiation frequency offsets and stronger white matter contrast at negative irradiation frequency offsets. To further separate the different resonances a 5 pool Multi-Lorentzian fit model was fitted to the MTR_LD stack. Figure 3 a) and b) shows the fit results in a typical gray and white matter voxel, figure c-e show the isolated resonances at 3.5 ppm, 2 ppm and -3.5 ppm as already detected at 7T [7], while f,g, and h show CEST contrast that were until now not yet reported in vivo. While the 2.7 ppm resonance shows higher signals in grey matter, the 1.2 ppm resonance is especially elevated in the frontal WM regions. The -1.7 ppm peak showed surprisingly strong signals in vessels which might be attribute to red-blood-cell CEST effects [8] and were investigated in detail in a separate abstract. In all contrasts (Figures 2,3), strong noise artifacts still appear in the region of lowest B1 as seen in Figure 4. This large variability in the B1 distribution across the field of view is a major challenge at ultra-high field, however current developments in parallel transmission techniques may allow mitigation of B1 inhomogeneities in the near future and make the presented approach more reliable and faster.CONCLUSION
To our knowledge, the present study reports the most precise CEST measurement of the human brain in vivo. The high spectral resolution at 9.4T combined with a spectral sampling with 95 offsets revealed as yet unidentified CEST peaks robustly. In addition, maps of the individual peaks could be generated and showed different contrast in the brain, generating possibilities for future use as biomarker.Acknowledgements
The financial support of the Max Planck and Society, German Research Foundation (DFG, grant ZA 814/2-1, support to M.Z., M.S., and K.H.), and European Union’s Horizon 2020 research and innovation programme (Grant Agreement No. 667510, support to M.Z., A.D.) is gratefully acknowledged.References
[1] Zaiss et al. PMB (2013), 58(22):R221-69
[2] G. Shajan et al., MRM (2014) 71(2):870-79
[3] Zaiss et al., ISMRM (2017) #3768
[4] Schuenke et al., MRM (2017) 77(2):571-580
[5] Windschuh et al., NBM (2015) 28(5):529-37
[6] Jones et al., Neuroimage (2013) 77:114-124
[7] Zaiss et al. Neuroimage.(2015) 112:180-188
[8] Shah et al. NeuroImage (2017) 2017.10.053
Figures
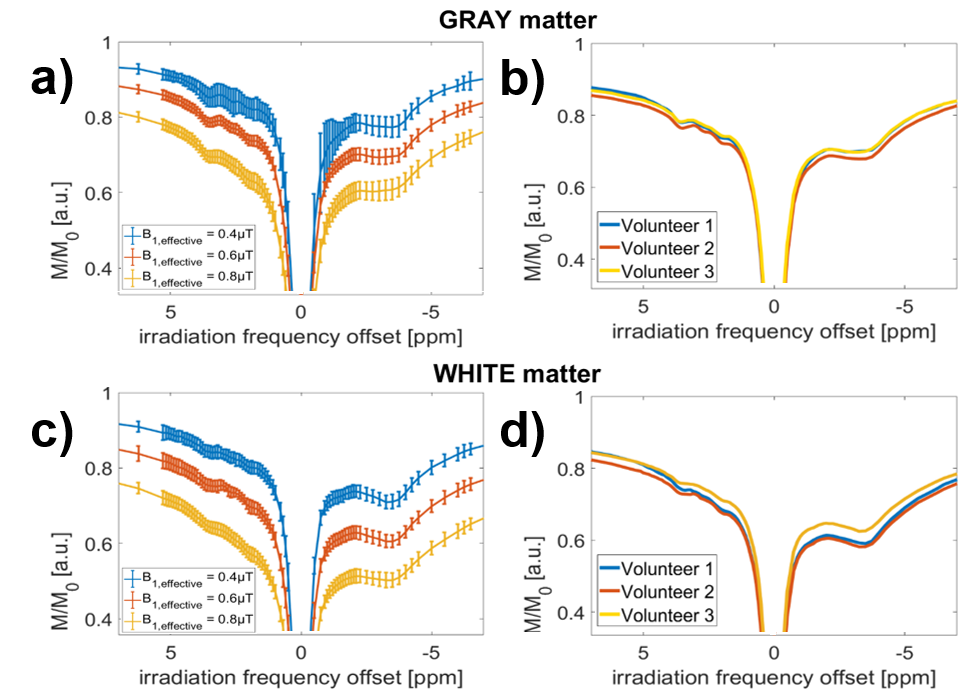
Highly-resolved
9.4T Z-spectra in gray (a,b) and white brain matter (c,d). Intra-individual
(a,c) and inter-individual Z-spectra comparison (c,d). a) B1-uncorrected
Z-spectra in gray matter (GM) in ROIs with effective B1 of 0.4µT,
0.6µT and 0.8µT respectively. b) B1 corrected Z-spectra of three healthy
volunteers at B1,reconstructed = 0.5µT. c) and d) show
according spectra in white matter for comparison.

Lorentzian
difference MTRLD spectra of the 3 volunteers for gray (a) and white
brain matter (b). (c) Inter-volunteer mean value and standard deviation show
the reproducibility of the acquisition and evaluation protocol. (d) MTRLD
values at different offsets directly generate different CEST contrast maps.

Volunteer
2: Multi-Lorentzian fit evaluation allows for isolation of different CEST
contributors in gray matter (a) and white matter (b). Lorentzian amplitude maps
(c-h) show more differentiated contrasts for the different resonances compared
to MTRLD in Figure 2 (Volunteer 2, slice 9).
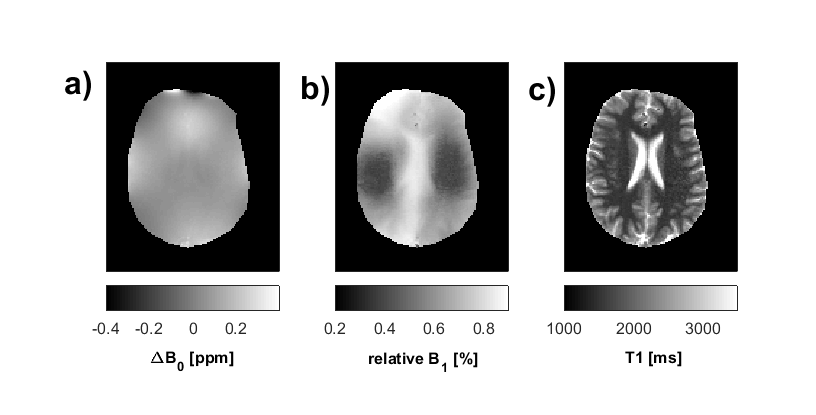
B0
(a) and B1 inhomogeneity maps (b) and T1 map (c) acquired at 9.4T
(Volunteer 2, as in Figure 2,3).