0557
Manganese-enhanced MRI: comparison of agents in the rat pancreas1Edinburgh Imaging, The University of Edinburgh, Edinburgh, United Kingdom, 2Experimental Medicine Imaging, GlaxoSmithKline, London, United Kingdom, 3Endocrinology Unit, The University of Edinburgh, Edinburgh, United Kingdom, 4BHF/University of Edinburgh Centre for Cardiovascular Sciences, The University of Edinburgh, Edinburgh, United Kingdom
Synopsis
Type 1 diabetes mellitus results in autoiummune destruction of β-cells in the pancreas, which are responsible for insulin production. Paramagnetic Mn2+ ions are taken up by β-cells as a calcium analogue and could be used as an MR contrast agent to monitor β-cell function and therefore treatment or disease progression in these patients. Three manganese-based contrast agents (MnCl2, mangafodipir and Mn gluconate) were used to measure pancreas enhancement after saline and glucose challenge in healthy rats. All agents showed greater enhancement after glucose challenge, with no marked difference between the two agents that have been used clinically.
Introduction
Type 1 diabetes mellitus is an autoimmune disease that results in destruction of insulin-producing β-cells within the pancreas [1]. A non-invasive method for detection of β-cells would be valuable in these patients as a method for monitoring disease progression or treatment response, since there is evidence of remaining β-cell function in some subjects who could, therefore, benefit from therapeutic intervention [2]. Manganese ions (Mn2+) are strongly paramagnetic, and have been used in MR contrast agents since the 1980s [3]. In the pancreas, Mn2+ ions can act as a calcium analogue and enter β-cells through voltage-gated calcium channels [4]. T1 enhancement with MnCl2 has therefore been proposed as a method for evaluating β-cell mass and function in mice [5–8]. In humans, one study has investigated Mn-enhanced MRI in diabetic patients [9], which showed that manganese-enhanced imaging could be used to distinguish normoglycaemic from type 2 diabetic patients, characterised by relative insulin deficiency and diminished beta cells. Further work in this area has been limited by a lack of clinically available Mn-based contrast agents. Recently, two Mn agents have become available again for human use; mangafodipir (TeslaScan, IC Targets, Norway) and Mn gluconate (SeeMore, Eagle Vision Pharmaceutical, USA). In this work both contrast agents, as well as MnCl2 were used to image the pancreas of healthy rats subjected to saline and glucose challenges. The aim was to examine whether Mn gluconate produces pancreatic enhancement similar to that seen with mangafodipir (the agent used in the previous human study) [9] as a first step towards applying this contrast agent in patients with type 1 diabetes mellitus and potentially type 2 diabetes.Methods
All animal studies were ethically reviewed and carried out in accordance with Animals (Scientific Procedures) Act 1986 and the GSK Policy on the Care, Welfare and Treatment of Animals. Rats were imaged in two sessions 1-2 weeks (mean 8.8 days) apart, during administration of a saline (control) or glucose challenge and a manganese-based contrast agent: MnCl2 (6 rats), mangafodipir (5 rats), Mn gluconate (7 rats). Images were acquired at 7 T (Agilent Technologies, Santa Clara, USA) using a volume coil. Cardiac, respiratory and temperature monitoring continued throughout the scan session. Imaging included anatomical T1w and T2w multislice TSE used to plan a coronal respiratory-gated 2D dynamic T1w gradient echo acquisition through the pancreas (TR=100 ms, TE=1.35 ms, α=60°, slice thickness=2 mm, matrix=128x128, FOV=60 mm). After ~10 dynamic images the challenge (2 ml/kg saline or 50% glucose) was injected using a syringe driver over 1 minute, followed after 2 minutes by the contrast agent injection (MnCl2 100 mmol/kg, mangafodipir 125 mmol/kg due to 80% dechelation [10], Mn gluconate 100 mmol/kg, each injected over 20 minutes). Dynamic imaging continued for 40 minutes after the Mn injection was complete, making a total of approximately 60 minutes (140-180 frames). The pancreas and a large ROI in the liver avoiding obvious vessels were manually outlined on the dynamic images using anatomical images as a guide. Mean enhancement curves were plotted and a sigmoid function was fitted to each curve to calculate a plateau enhancement value over baseline [5], including parameter uncertainty from the fit covariance matrix. Plateau height for the pancreas was normalised to that for liver, and compared for glucose vs saline challenge.Results
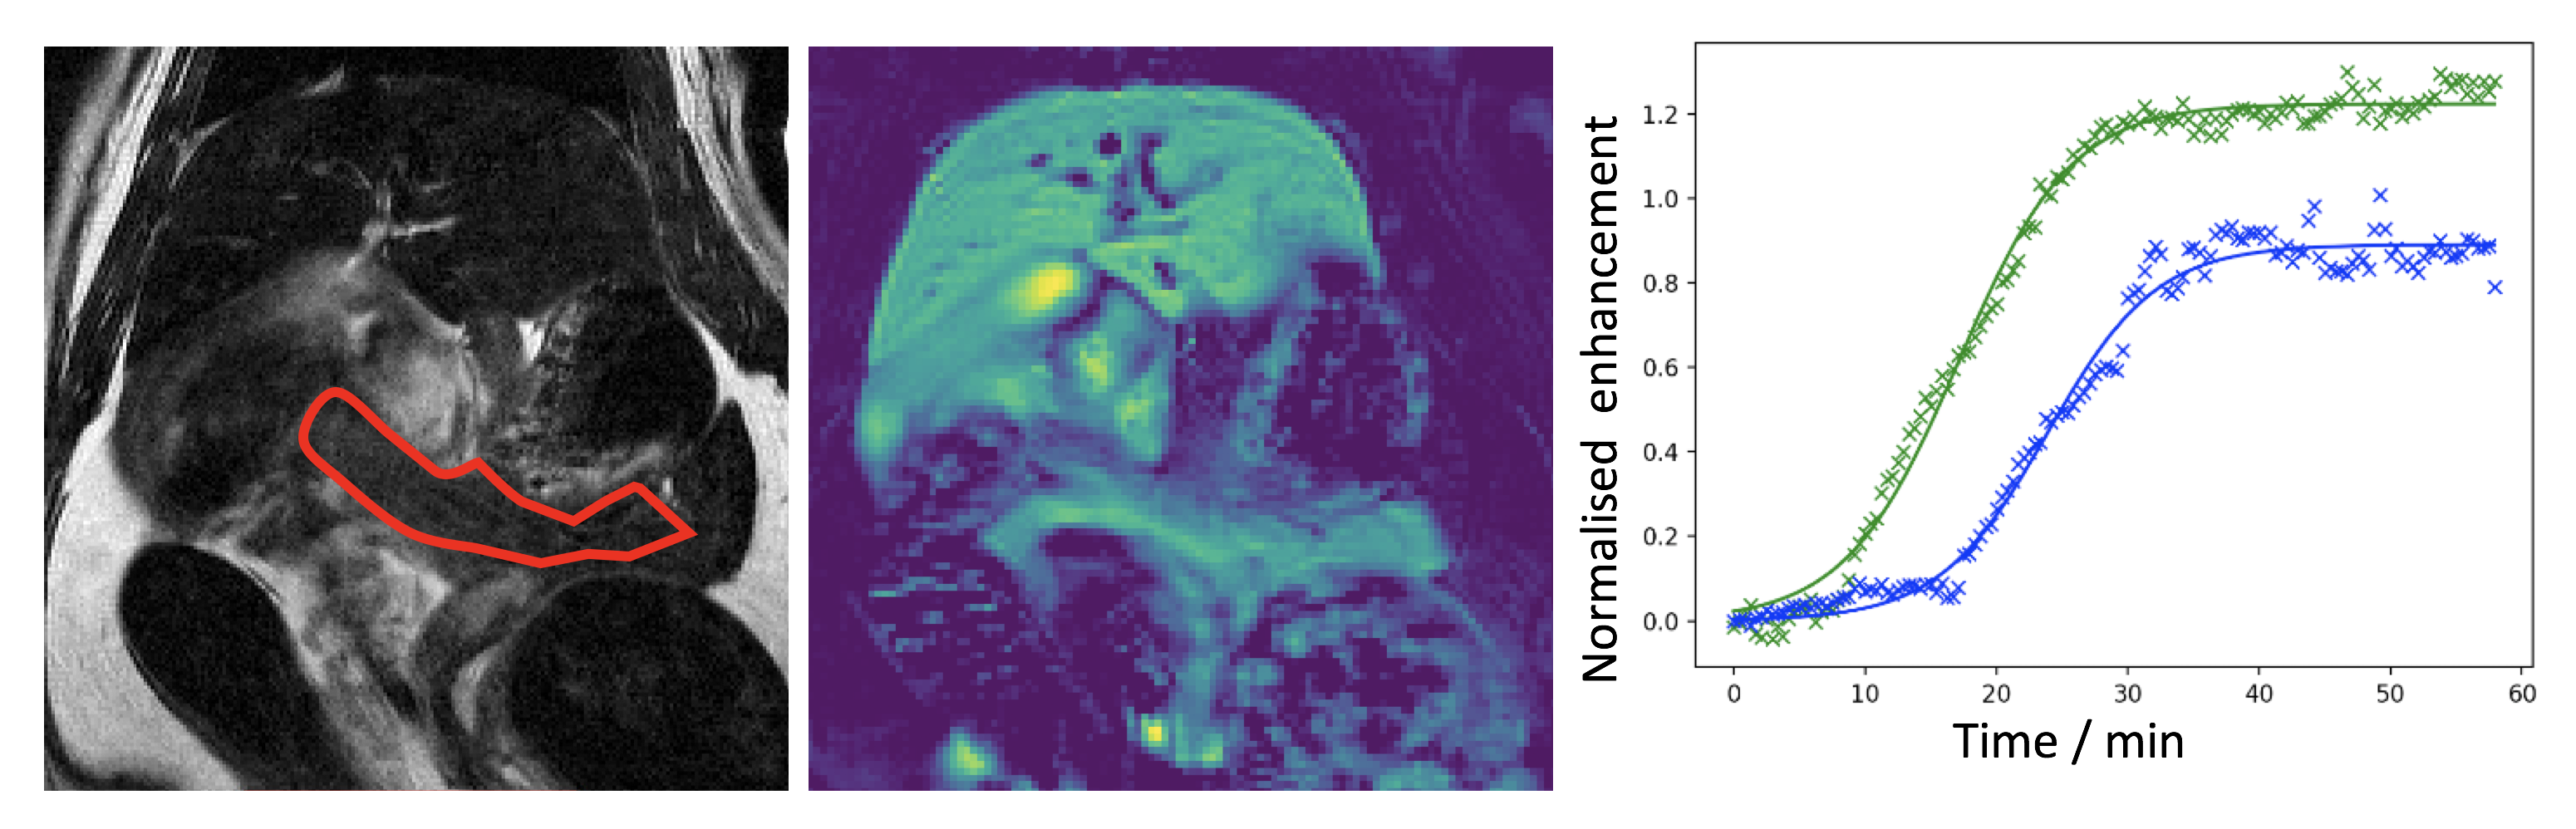
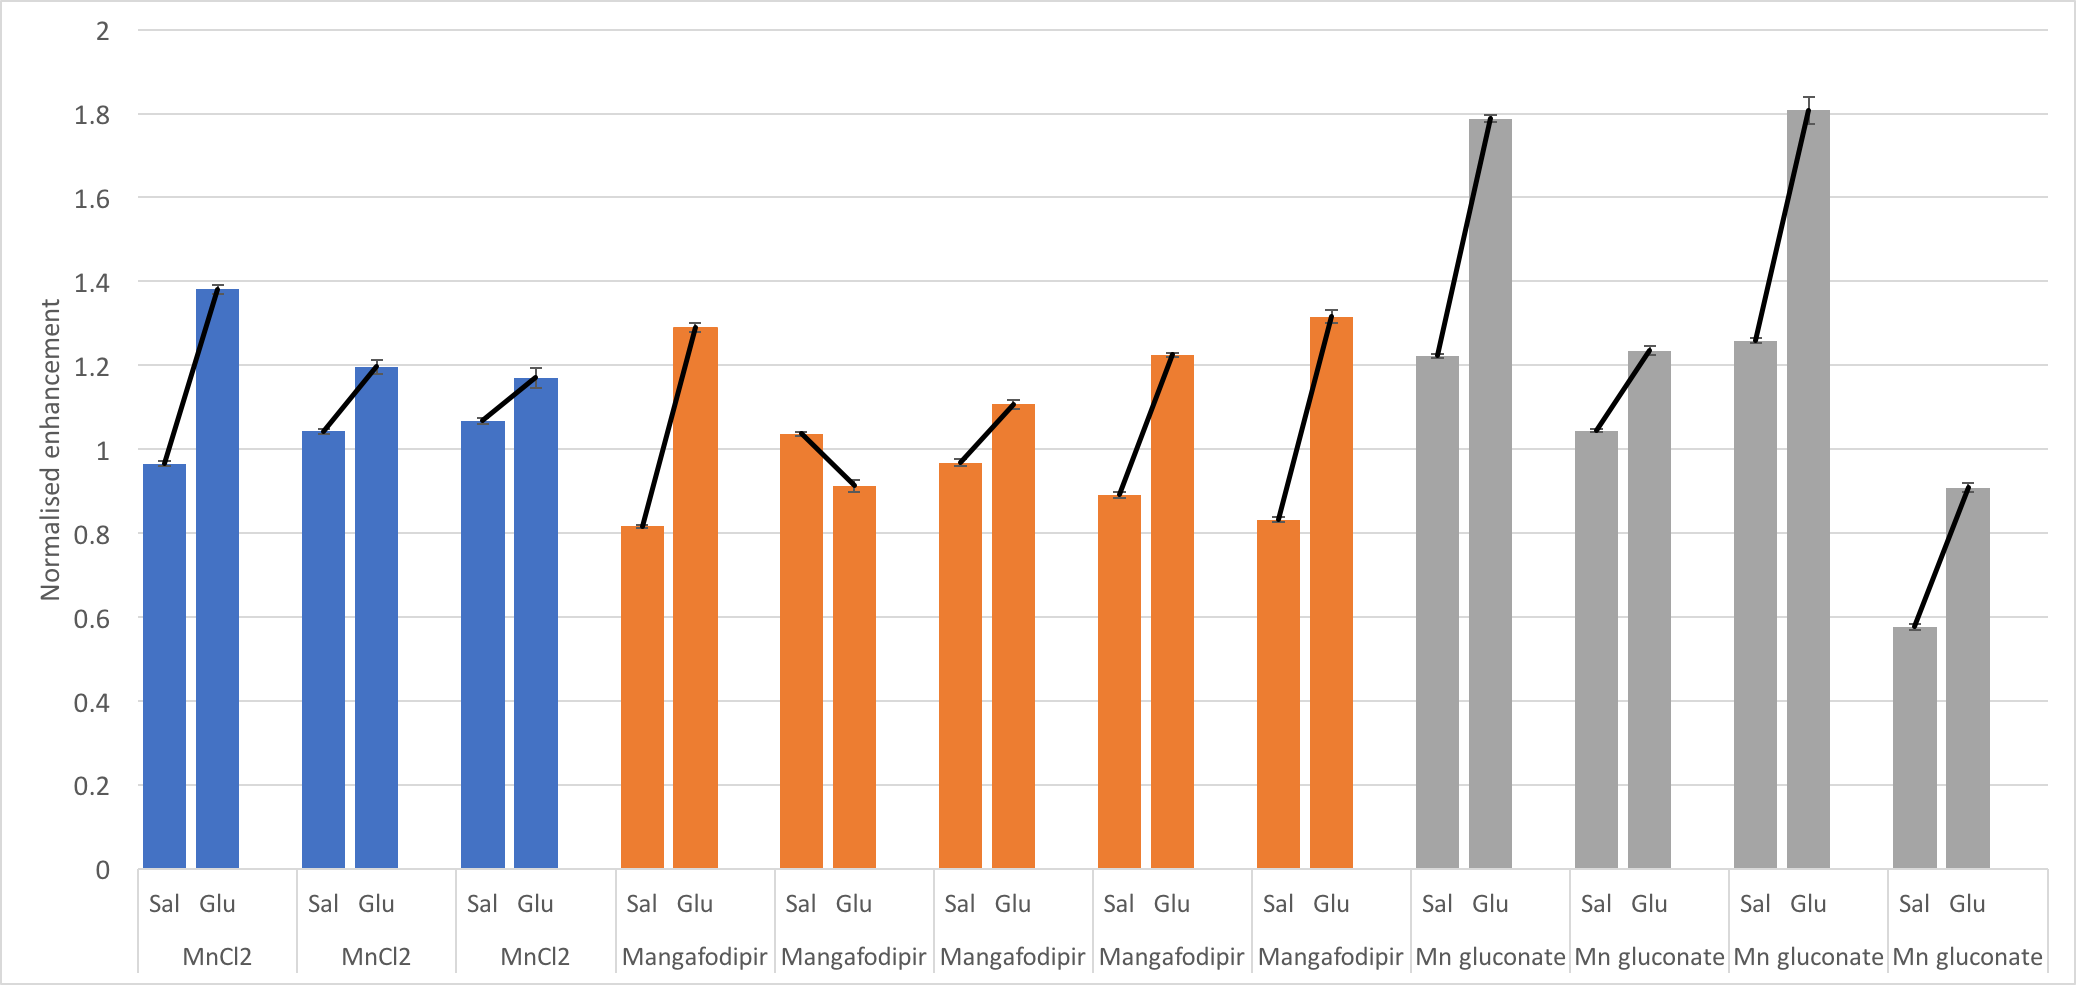
One rat died in an early experiment where the MnCl2 was infused over 10 minutes, leading to the 20 minute infusion used for all subsequent experiments. Five rats were removed from analysis due to technical issues with the injections or imaging, leaving 12 complete datasets (3 MnCl, 5 mangafodipir, 4 Mn gluconate). Figure 1 shows example images, enhancement curves and fits from one subject. Fig. 2 shows sigmoid fit plateau height within the pancreas normalised to that from the liver for saline and glucose challenges for each rat. For saline vs glucose challenge, mean increase in plateau height ± sd were: 22±18% for MnCl2, 31±29% for mangafodipir and 41±17% for Mn gluconateConclusion
All three contrast agents produced similar enhancement, with greater plateau height under glucose challenge in all but one case. Following on from successful previous studies in diabetic mice, both agents available for use in humans show potential for translation into a clinical study investigating beta cell imaging of the pancreas in type 1 diabetes mellitus and potentially type 2 diabetes.Acknowledgements
We would like to thank Ross Lennen for assisting with the animal experiments and Pat Antkowiak for helpful discussions regarding image analysis.References
[1] G.C. Weir, S. Bonner-Weir, A. Sharma, Regulation of Insulin Secretion and Islet Cell Function, in: J. Skyler (Ed.), Atlas Diabetes Fourth Ed., Springer US, Boston, MA, 2012: pp. 1–17. doi:10.1007/978-1-4614-1028-7_1.
[2] R.A. Oram, A.G. Jones, R.E.J. Besser, B.A. Knight, B.M. Shields, R.J. Brown, A.T. Hattersley, T.J. McDonald, The majority of patients with long-duration type 1 diabetes are insulin microsecretors and have functioning beta cells, Diabetologia. 57 (2014) 187–191. doi:10.1007/s00125-013-3067-x.
[3] M.H. Mendonca-Dias, E. Gaggelli, P.C. Lauterbur, Paramagnetic contrast agents in nuclear magnetic resonance medical imaging., Semin. Nucl. Med. 13 (1983) 364–376.
[4] S. Dryselius, E. Grapengiesser, B. Hellman, E. Gylfe, Voltage-dependent entry and generation of slow Ca2+ oscillations in glucose-stimulated pancreatic beta-cells., Am. J. Physiol. 276 (1999) E512-8. http://www.ncbi.nlm.nih.gov/pubmed/10070018.
[5] P.F. Antkowiak, S.A. Tersey, J.D. Carter, M.H. Vandsburger, J.L. Nadler, F.H. Epstein, R.G. Mirmira, Noninvasive assessment of pancreatic β-cell function in vivo with manganese-enhanced magnetic resonance imaging, Am. J. Physiol. - Endocrinol. Metab. 296 (2009) E573-8. doi:10.1152/ajpendo.90336.2008.
[6] P.F. Antkowiak, M.H. Vandsburger, F.H. Epstein, Quantitative pancreatic β-cell MRI using manganese-enhanced Look-Locker imaging and two-site water exchange analysis, Magn. Reson. Med. 67 (2012) 1730–1739. doi:10.1002/mrm.23139.
[7] P.F. Antkowiak, B.K. Stevens, C.S. Nunemaker, M. McDuffie, F.H. Epstein, Manganese-enhanced magnetic resonance imaging detects declining pancreatic β-cell mass in a cyclophosphamide-accelerated mouse model of type 1 diabetes, Diabetes. 62 (2013) 44–48. doi:10.2337/db12-0153.
[8] A. Meyer, K. Stolz, W. Dreher, J. Bergemann, V. Holebasavanahalli Thimmashetty, N. Lueschen, Z. Azizi, V. Khobragade, K. Maedler, E. Kuestermann, Manganese-Mediated MRI Signals Correlate With Functional β-Cell Mass During Diabetes Progression, Diabetes. 64 (2015) 2138–2147. doi:10.2337/db14-0864.
[9] D. Botsikas, S. Terraz, L. Vinet, S. Lamprianou, C.D. Becker, D. Bosco, P. Meda, X. Montet, Pancreatic magnetic resonance imaging after manganese injection distinguishes type 2 diabetic and normoglycemic patients, Islets. 4 (2012) 243–248. doi:10.4161/isl.20857.
[10] K.G. Toft, S.O. Hustvedt, D. Grant, I. Martinsen, P.B. Gordon, G.A. Friisk, A.J. Korsmo, T. Skotland, Metabolism and pharmacokinetics of MnDPDP in man, Acta Radiol. 38 (1997) 677–689.
Figures