0556
Characterization of Breast Lesion using T1-perfusion MRI: Semi- Quantitative Vs Quantitative Analysis1Centre for Biomedical Engineering, Indian Institute of Technology Delhi, New Delhi, India, 2Department of Biomedical Engineering, AIIMS Delhi, New Delhi, India, 3Department of Radiology and Imaging, Fortis Memorial Research Institute, Gurgaon, New Delhi, India
Synopsis
In this study role of hemodynamic parameters (breast-blood-volume and breast blood-flow), obtained using T1-perfusion MRI data of breast, in the differentiation of benign from malignant breast lesions and classification of malignant lesions into different grades is evaluated. Hemodynamic parameters were also compared with the tracer kinetic parameters and semi-quantitative T1-perfusion analysis in term of grading. The high sensitivity and specificity of breast-blood-volume in differentiating between benign and malignant as well as in the grading of breast lesions (grade-I, grade-II and grade-III) were observed.
INTRODUCTION:
Treatment planning and management approaches depend upon lesions grades. Grade-I patients have a significantly better survival rate than grade-II and grade-III patients as previously reported(1-2). Contrast enhanced T1-perfusion MRI is widely used for a variety of clinical purposes such as post-treatment evaluation, detection and evaluating response to chemotherapy etc. The advantage of T1-perfusion is its high sensitivity, particularly for early invasive lesions(3-5). The semi-quantitative approach provides only information about the tissue vasculature like average concentration, time to peak, wash-in slope, wash-out slope etc(6-9). On other hand, quantitative analysis of T1-perfusion data provides estimation of physiological parameters of tissue3. The overlapping of kinetic curves usually misleads the clinician9. Previously, hemodynamic parameters using first pass analysis were reported for grade-II and grade-III of breast patient10. The objective of this study was to quantify the hemodynamic parameters by first pass analysis of T1-perfusion MRI data of human breast and to compare with the existing tracer kinetic parameters and semi-quantitative T1-perfusion analysis in terms of characterizing these into malignant or benign; and grading of these malignant breast lesions.METHODS:
All the MRI experiments were performed at 3T whole body Ingenia MRI system (Philips Healthcare, The Netherlands) using a 7 channel biopsy compatible breast coil. Fifty female subjects, 15 benign and 35 malignant (5 grade-I, 19 grade-II, 11 grade-III and) with breast lesions, were scanned for MRI data.
MRI Data acquisition: After a localizer, 2D T1-Weighted(W), T2-W, and PD-W images with and without fat suppression were acquired using turbo spin echo pulse sequence for multiple slices covering entire breast tissue. FOV=338×338mm2, slice thickness=3mm and acquisition matrix 452×338 were used for T1-W, T2-W and PD-W images. In this study, TR/TE=2821ms/30ms, TR/TE=2823ms/100ms and TR/TE=557ms/10ms for PD-W, T2-W T1-W images respectively. Contrast (Gd-BOPTA (Multihance, Bracco, Italy)) enhanced T1-perfusion MRI was performed using a 3-dimensional fast field echo sequence (TR/TE=3.0ms/1.5ms, flip angle=12o, matrix size=228*226, acquisition time 222seconds, 40 dynamics and 5.4 seconds temporal resolution).
Data Processing: Data were processed using in house written programs in MATLAB 2014a. After pre-processing, T1-perfusion MRI data were analyzed using semi-quantitative approach5 (kinetic curve types I, II or III), generalized tracer kinetic model5(Ktrans, Ve, Vp and Kep) and first pass analysis11 (hemodynamic parameters). Relative quantification of breast blood volume (BBV), leakage corrected BBV(BBVcorr) and breast blood flow(BBF) was performed by placing an ROI in the normal fibro-glandular tissue from the contra-lateral or same side of the breast. Receiver operating characteristic (ROC) curve, Chi-squared, and T-test were used for statistical analysis.
RESULTS:
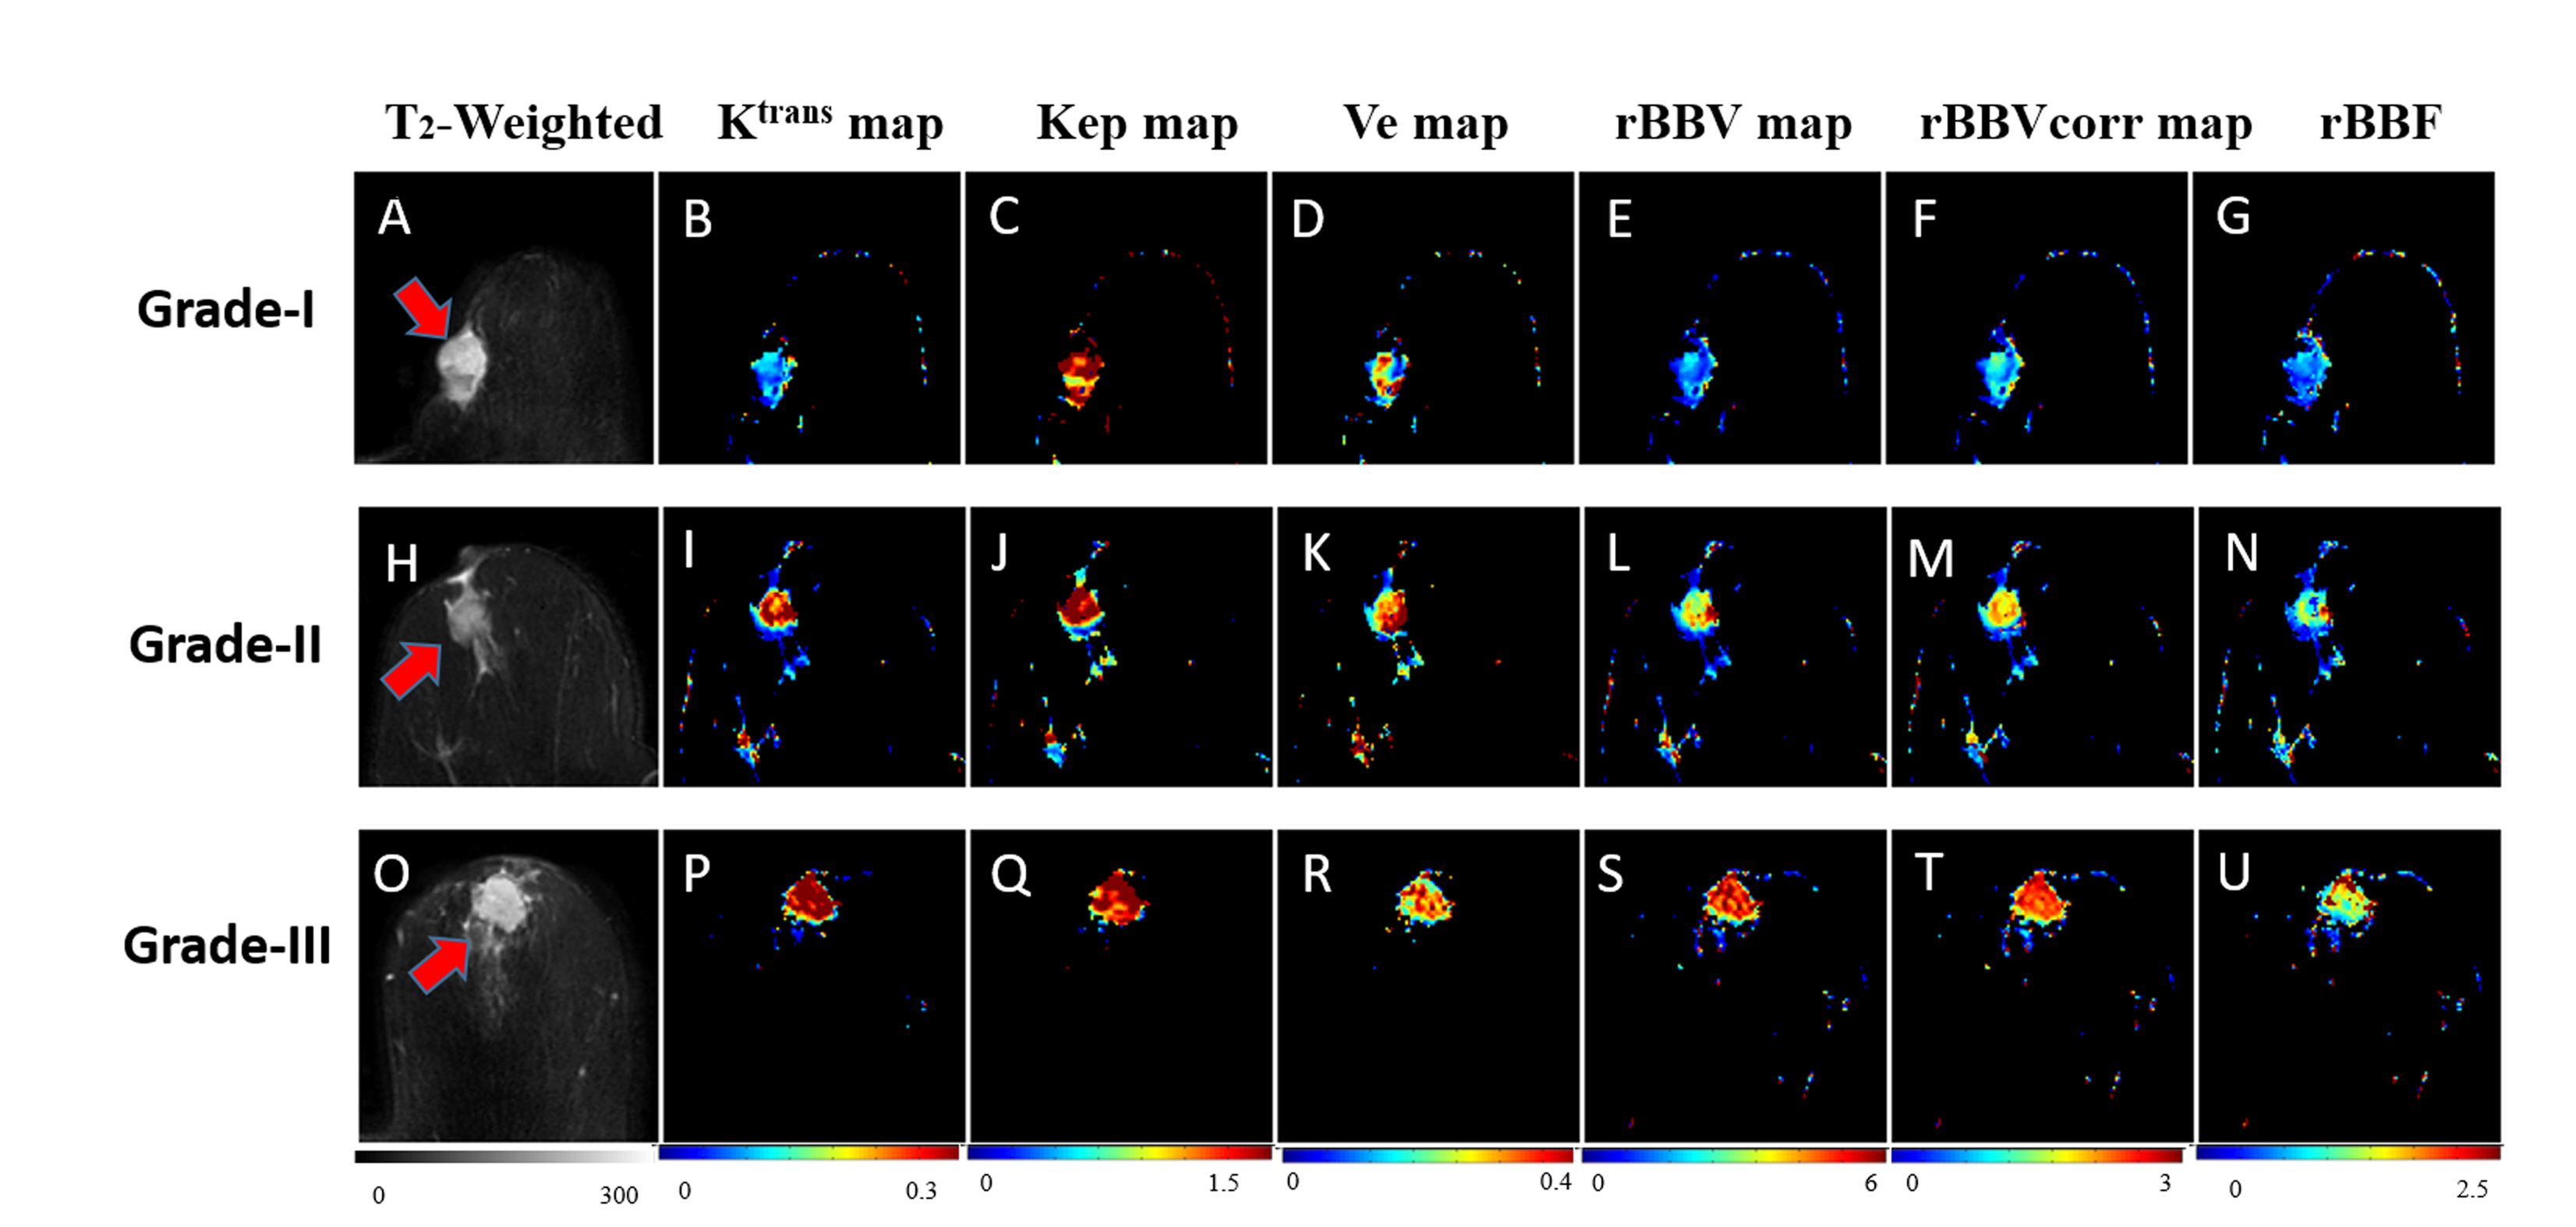
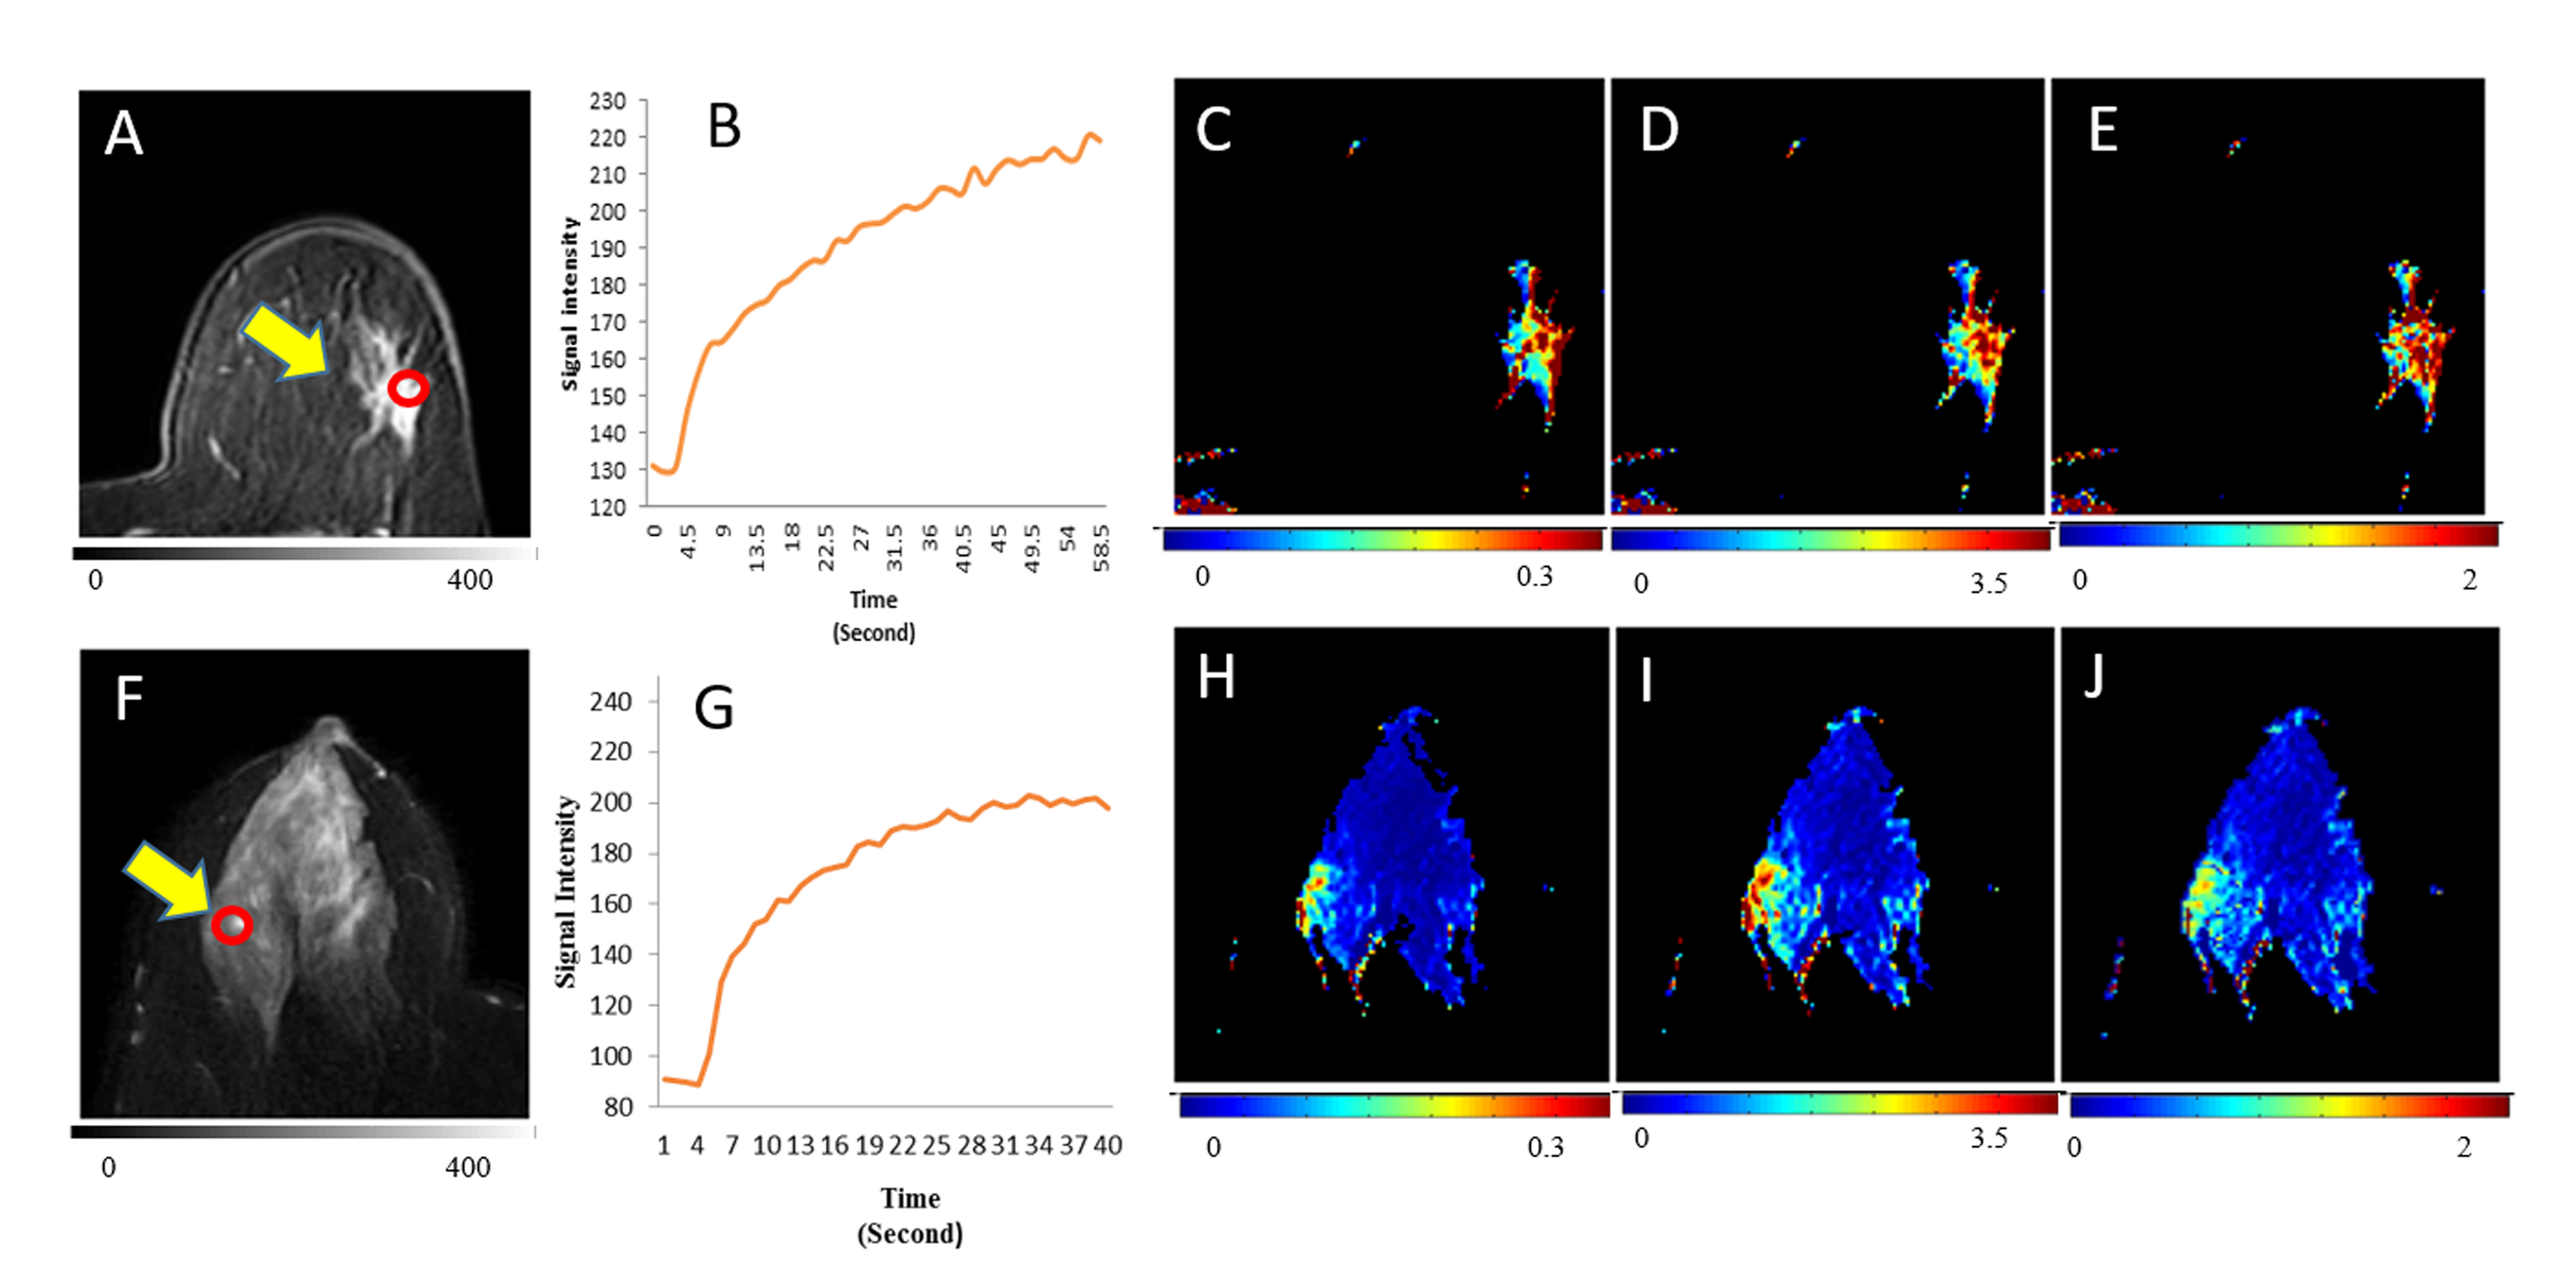
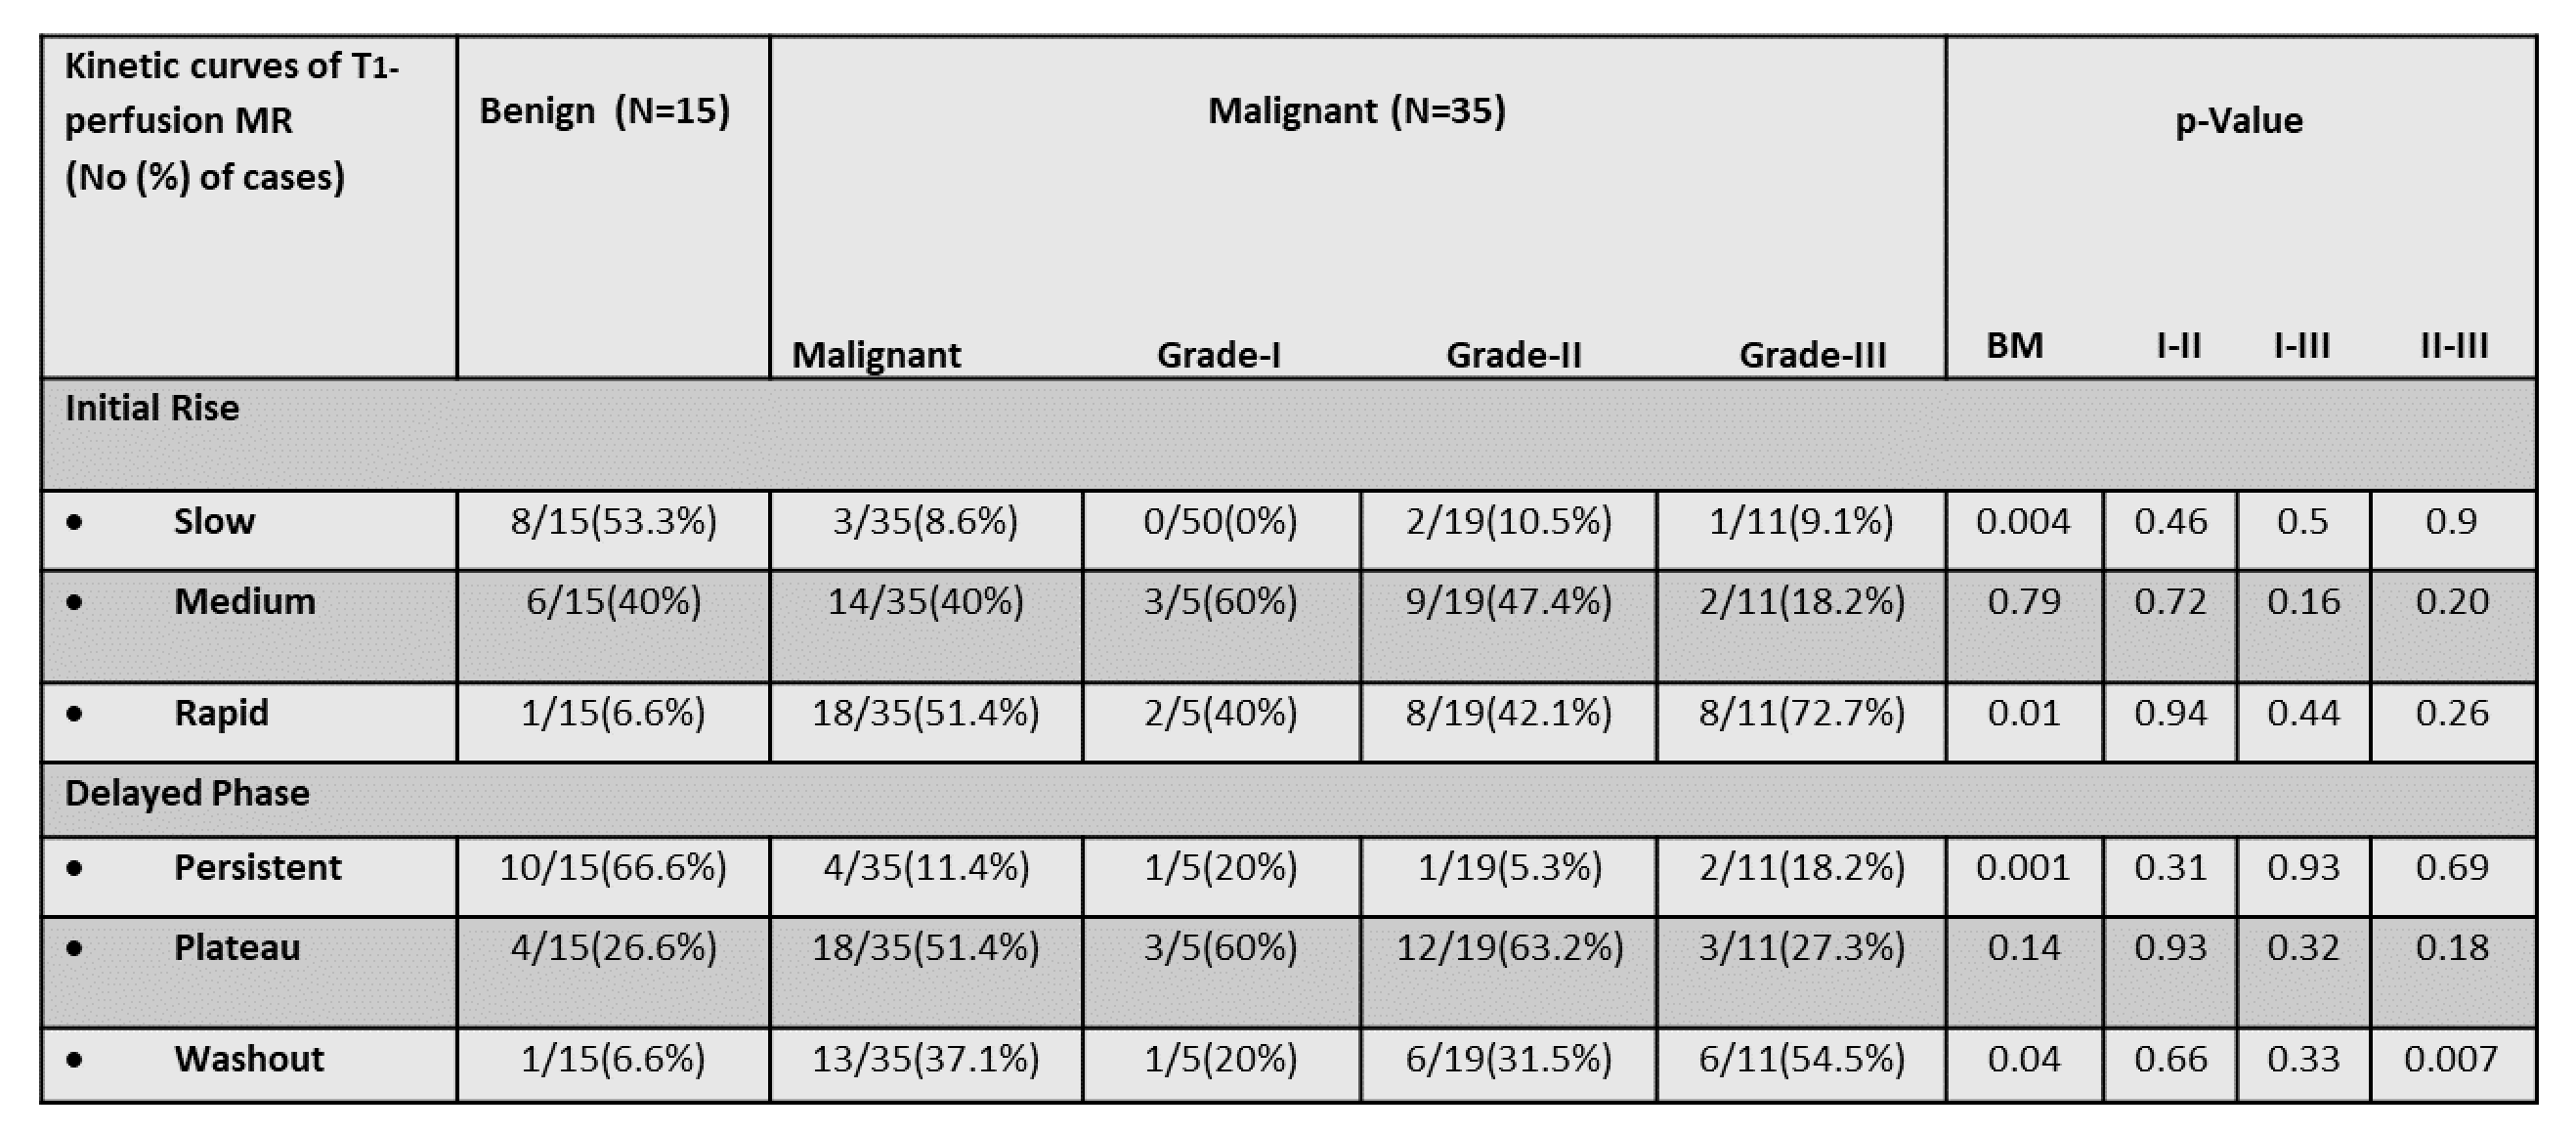
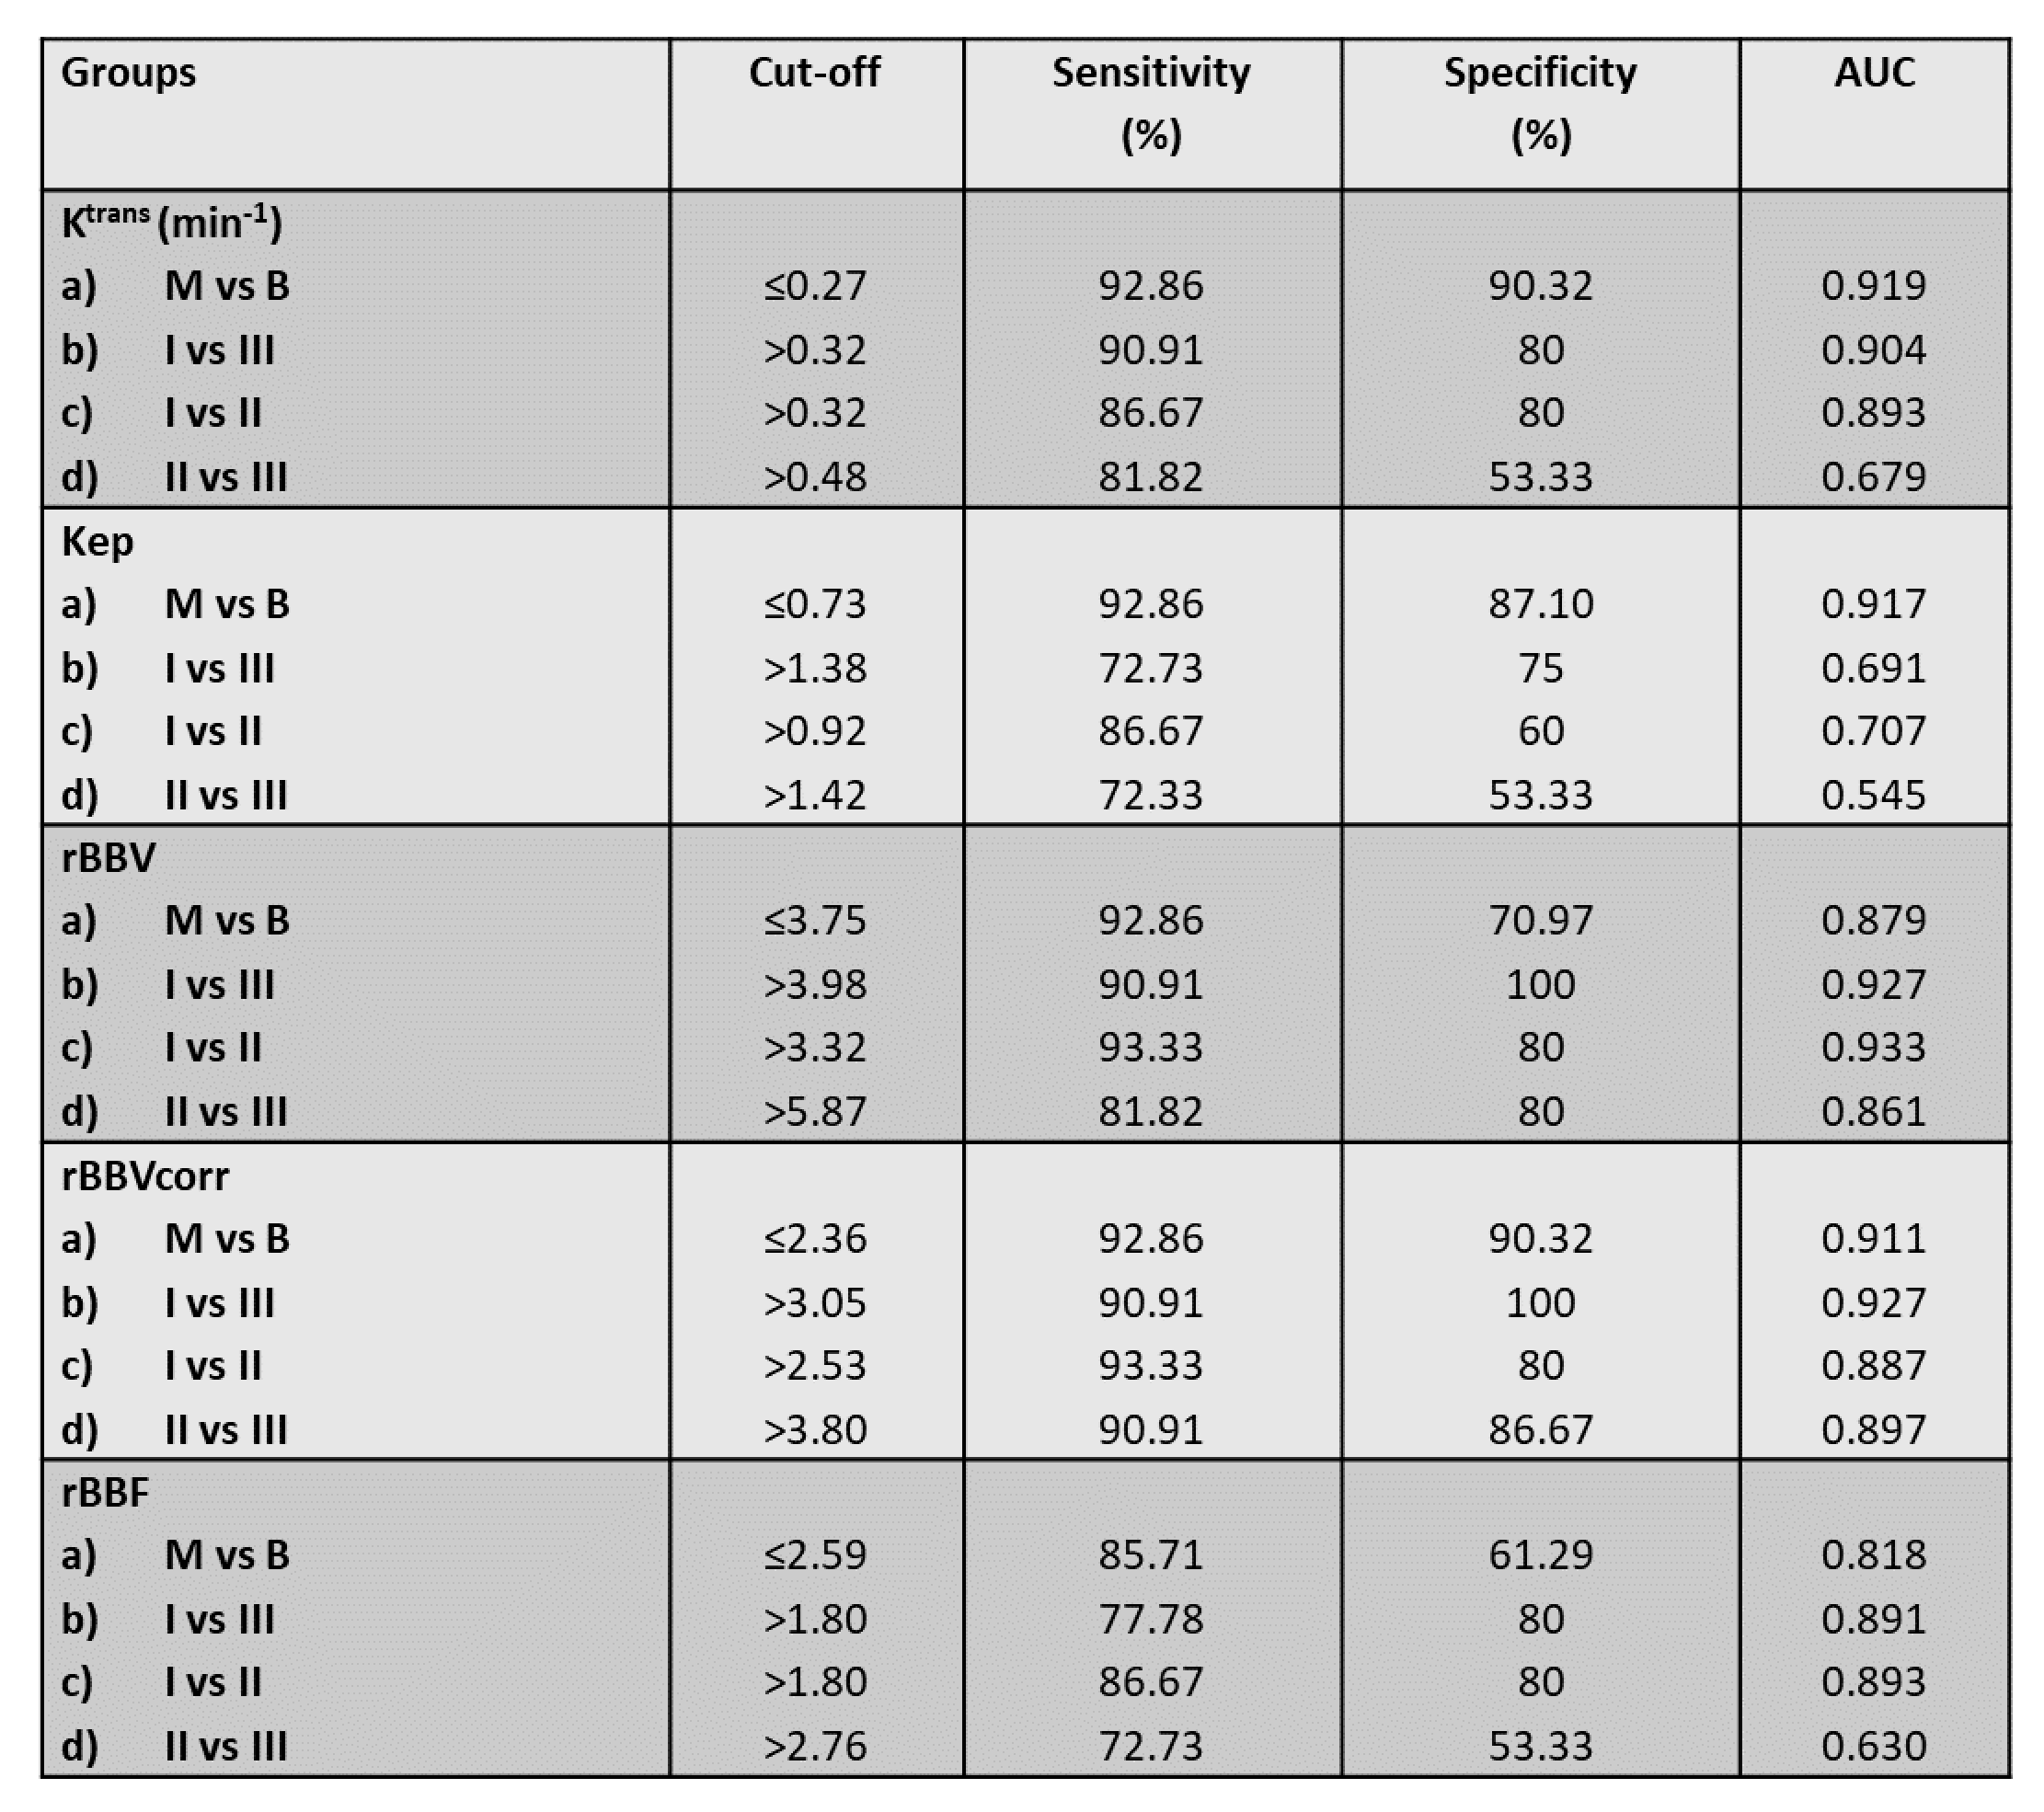
All quantitative parameters except leakage volume (Ve) and semi-quantitative curves (type-I and III) provided statistically significant (p<0.05) difference between benign and malignant lesions (p<0.05). Grade-III lesions(54.5%) showed more washout curves compared to grade-I (20%) and grade-II (31.5%) as shown in Table-1. MRI images of different grades along with color maps of various parameters are shown in Figure-1. Kinetic parameters, particularly Ktrans provided a significant difference between all grades except grade-II vs III. rBBVcorr provided highest sensitivity and specificity using ROC curve analysis compared to other parameters in differentiation between different grades of malignant breast lesions as shown in Table-II. Figure-2 shows two cases for evaluation of suspicious lesion. The semi-quantitative analysis misclassifies lesions as benign (Figure-2(a)) and malignant (Figure-2(b)) whereas quantitative perfusion parameters suggested that Figure-2(a) is a case with the malignant lesion and Figure-2(b) is a case of the benign lesion, which was validated by histology results.DISCUSSION:
In the current study,
rBBVcorr and Ktrans showed highest sensitivity and specificity for differentiation between benign and malignant lesions. Similar results
have been reported in the literature(4-5). It was found that tracer kinetic parameters were not able to
differentiate among grades -I, II and III which is also in agreement with the previously
reported study4. This can also be linked with biological characteristics of
the lesions. Rapid angiogenesis of malignant lesions was correlated with high
permeability as compared to benign. Moreover, tumor angiogenesis increases with
increase in grade which leads to increase in BBV. The sensitivity and
specificity of rBBVcorr were high in
differentiating between benign and malignant as well as in the grading of
breast lesions which suggests its utility in
improving non-invasive imaging assessment as compared to conventional imaging.CONCLUSION:
Quantitative parameters, particularly rBBVcorr and Ktrans provided highest sensitivity and specificity in differentiating benign from malignant breast lesions. Moreover, parameter rBBVcorr appears to be a biomarker for grading of various malignant breast lesions with very high sensitivity and specificity.Acknowledgements
The authors acknowledge an internal grant from IIT-Delhi and technical support of Philips India Limited in MRI data acquisition. We thanks, Prof. RKS Rathore for technical support in DCE-perfusion analysis; Dr. Indrajit Saha for providing technical support for MRI data acquisition; Dr. Priti Jain for data handling and providing biopsy reports and Dr. Meenakshi Singhal for clinical input.References
1. Elston C, Ellis IO (1991) Pathological prognostic factors in breast cancer. I. The value of histological grade in breast cancer: experience from a large study with long-term follow-up. Histopathology 19:403–410.
2. Robbins P, Pinder S, de Klerk N, et al (1995) Histological grading of breast carcinomas: A study of interobserver agreement. Hum Pathol 26:873–879.
3. Yang S-N, Li F-J, Chen J-M, et al (2016) Kinetic Curve Type Assessment for Classification of Breast Lesions Using Dynamic Contrast-Enhanced MR Imaging. PLoS One 11:1–10.
4. Zhen-Shen Ma et al. “Quantitative analysis of 3-Tesla magnetic resonance imaging in the differential diagnosis of breast lesions” Experimental and Therapeutic Medicine 9: 913-918, 2015.
5. Khouli RH El, Macura KJ, Kamel IR, et al (2011) 3 Tesla Dynamic Contrast Enhanced Magnetic Resonance Imaging of the Breast: Pharmacokinetic Parameters versus Conventional Kinetic Curv. AJR AM J Roentgenol 197:1498–1505.
6. Fusco R, Filice S, Granata V, et al (2013) Can semi-quantitative evaluation of uncertain (type II) time-intensity curves improve diagnosis in breast DCE-MRI. J Biomed Sci Eng 6:418–425.
7. Goto M, Ito H, Akazawa K, et al (2007) Diagnosis of breast tumors by contrast-enhanced MR imaging: Comparison between the diagnostic performance of dynamic enhancement patterns and morphologic features. J Magn Reson Imaging 25:104–112.
8. Fw F, Jd A, Rm S, Jc W (1993) Differentiation of benign from malignant breast masses by time intensity evaluation of contrast enhanced MRI . Magn Reson Imaging 11:617–20.
9. Macura KJ, Ouwerkerk R, Jacobs M a, Bluemke D a (2006) Patterns of enhancement on breast MR images: interpretation and imaging pitfalls. RadioGraphics 26:1719–1734.
10. Snekha Sehrawat , Pradeep Kumar Gupta , Meenakshi Singhal , Rakesh Kumar Gupta , and Anup Singh(2017). Quantification of tracer kinetic and hemodynamic parameters of human breast tumor and fibro-glandular tissue using DCE-MRI data. Proc. Intl. Soc. Mag. Reson. Med. 25 (2017).
11. Singh A, Haris M, Rathore D et al.. Quantification of physiological and hemodynamic indices using T1 dynamic contrast enhanced MRI in intracranial mass lesions. J. Magn. Reson. Imaging 2007;26:871–880. doi:10.1002/jmri.21080.
Figures