0555
Influence of whole-brain DCE-MRI (k,t) sampling strategies on variance of pharmaco-kinetic parameter estimates1Electrical Engineering Department, University of Southern California, Los Angeles, CA, United States
Synopsis
We investigate the influence of 2D $$$(k_y,k_z,t)$$$ sampling strategies on the minimum achievable variance without bias for pharmaco-kinetic parameter estimation in 3D whole-brain DCE-MRI (equivalent to the best possible precision without bias). Cramér-Rao analysis is combined with a pathologically- and anatomically-realistic digital reference object to objectively compare measurement procedures independent of any estimator. This study did not identify any significant difference between lattice and random undersampling, or between their uniform and variable density variants.
Introduction
Dynamic contrast enhanced MRI (DCE-MRI) of the brain provides a powerful tool to non-invasively assess neurovascular parameters, such as permeability of the brain-blood barrier ($$$\boldsymbol{K}_t$$$), plasma ($$$\boldsymbol{v}_p$$$), and interstitial volume ($$$\boldsymbol{v}_e$$$). DCE-MRI has potential to monitor early treatment response in brain tumor therapy. Yet in order to make reliable predications the entire measurement and estimation procedure has to become accurate, precise, and reproducible 1. In this work, we focus on one specific aspect of this measurement chain by objectively comparing ($$$\boldsymbol{k}$$$,t) sampling patterns in a framework that works independent of any specific estimator. Undersampling in each time frame is inevitable to achieve desired temporal resolution to reliably capture bolus arrival, accumulation, and wash-out, while still maintaining a clinically relevant FOV and high spatial resolution 2. This raises the question which under sampling strategy allows for estimation of pharmaco-kinetic (PK) parameter with lowest variance.Methods
Framework
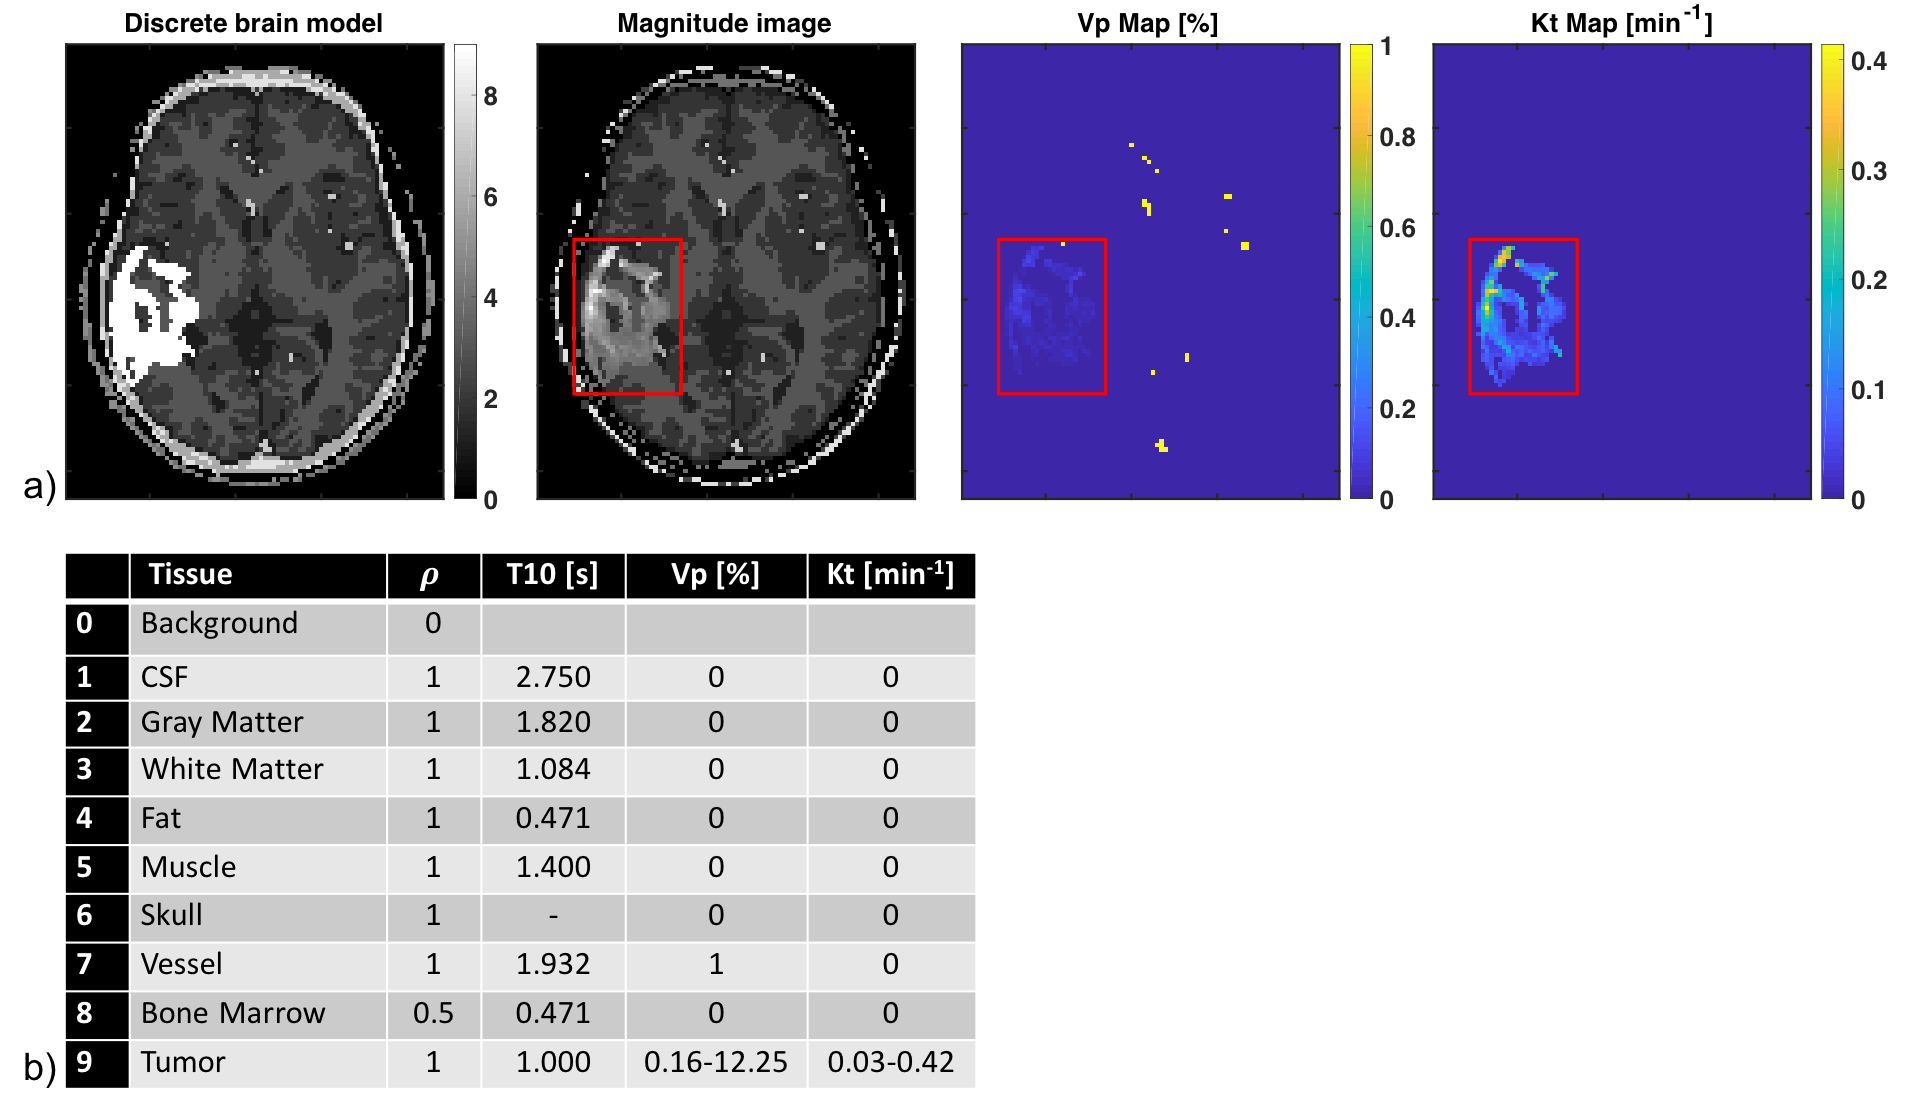
The Cramér-Rao bound (CRB) gives a lower bound on variances of any unbiased estimator, and has been widely used to optimize MRI experiment design 3-5. Evaluation of the CRB requires the derivatives of the DCE-MRI forward model with respect to the parameters being estimated. The forward model was simulated by PK modeling based on the Patlak model, an SPGR sequence, sensitivity encoding, and Fourier undersampling. A population based arterial input function (AIF) was chosen for this simulation 6. Coil sensitivities and noise covariance matrix for an eight-channel head array were taken from measurements. The derivative of the forward model needs to be evaluated at the parameter being estimated. Hence, a pathologically- and anatomically-realistic digital reference object (DRO) was taken to be the ground-truth (Figure 1) 7. CRBs were computed for pre-contrast white matter SNR=10, flip angle of 24°, and 50 time frames at 5s temporal resolution. As a linear system model allows the existence of the minimum variance unbiased estimator in the Gaussian noise case, pharmaco-kinetic model and flip angle were chosen to operate the signal equation in the linear regime 5.
Sampling schemes
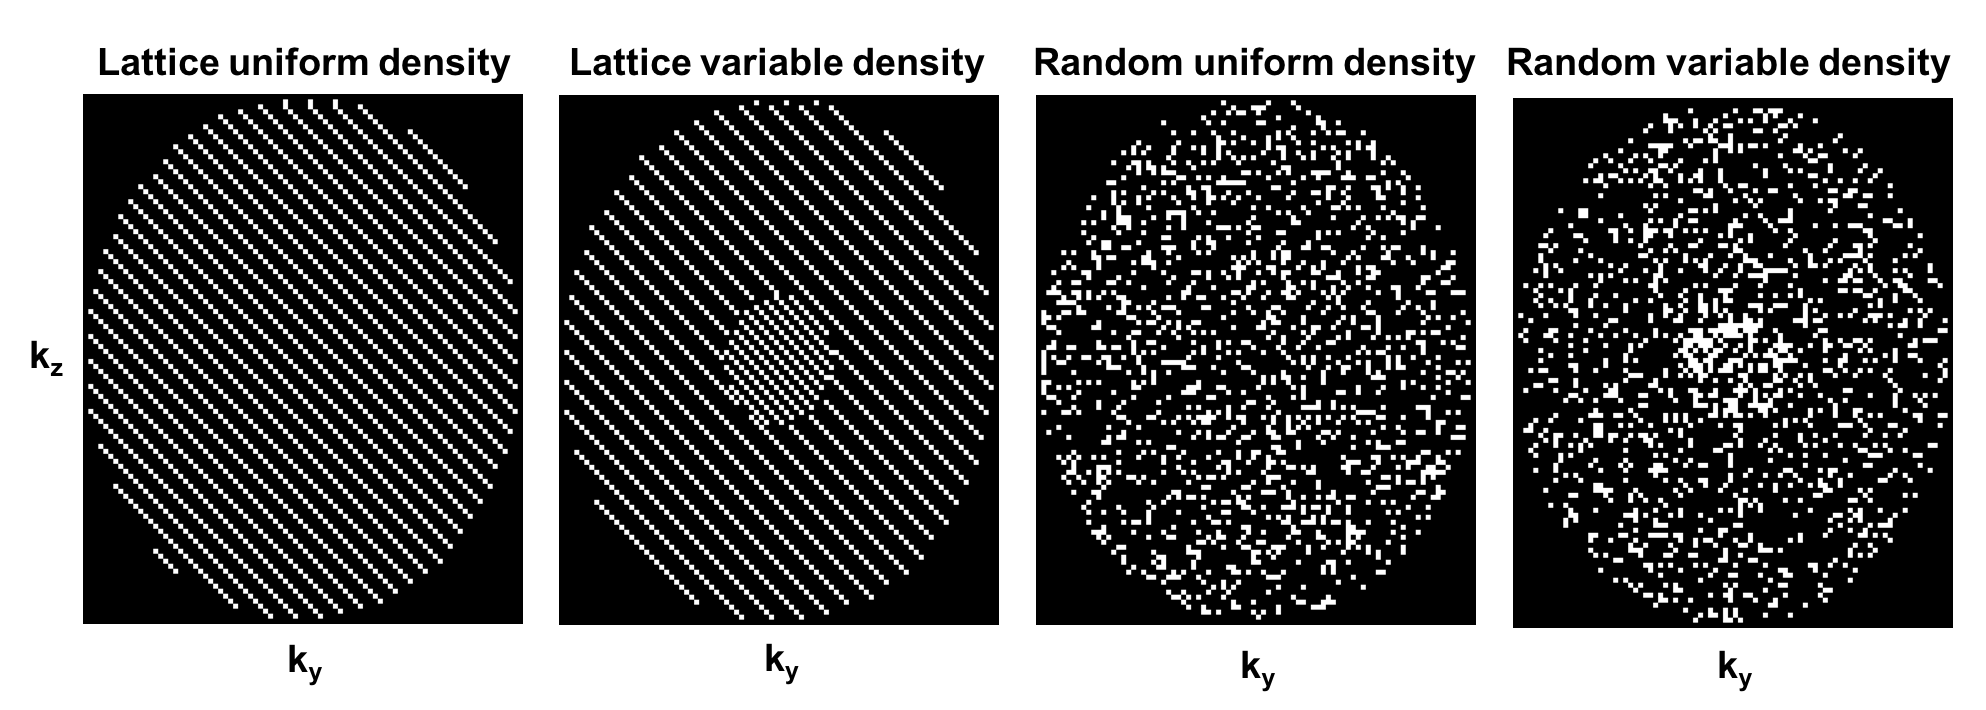
Cartesian sampling schemes can broadly be classified into k-space region sampling (e.g., Keyhole, TRICKS), lattice-based, and random sampling with uniform or variable density variants (e.g., kt-SENSE, DISCO, TWIST, kt-SPARSE). Early in this study, we found that k-space region sampling schemes often lead to very ill-conditioned or even singular Fisher Information matrices, which indicate that certain PK parameters cannot be estimated with finite variance 8. Hence, zone-based sampling is omitted a-priori from the comparison of candidate sampling patterns, shown in Figure 2. The undersampling factors for each sampling schemes shown in Figure 2 were R=2,5,10,15.
Results
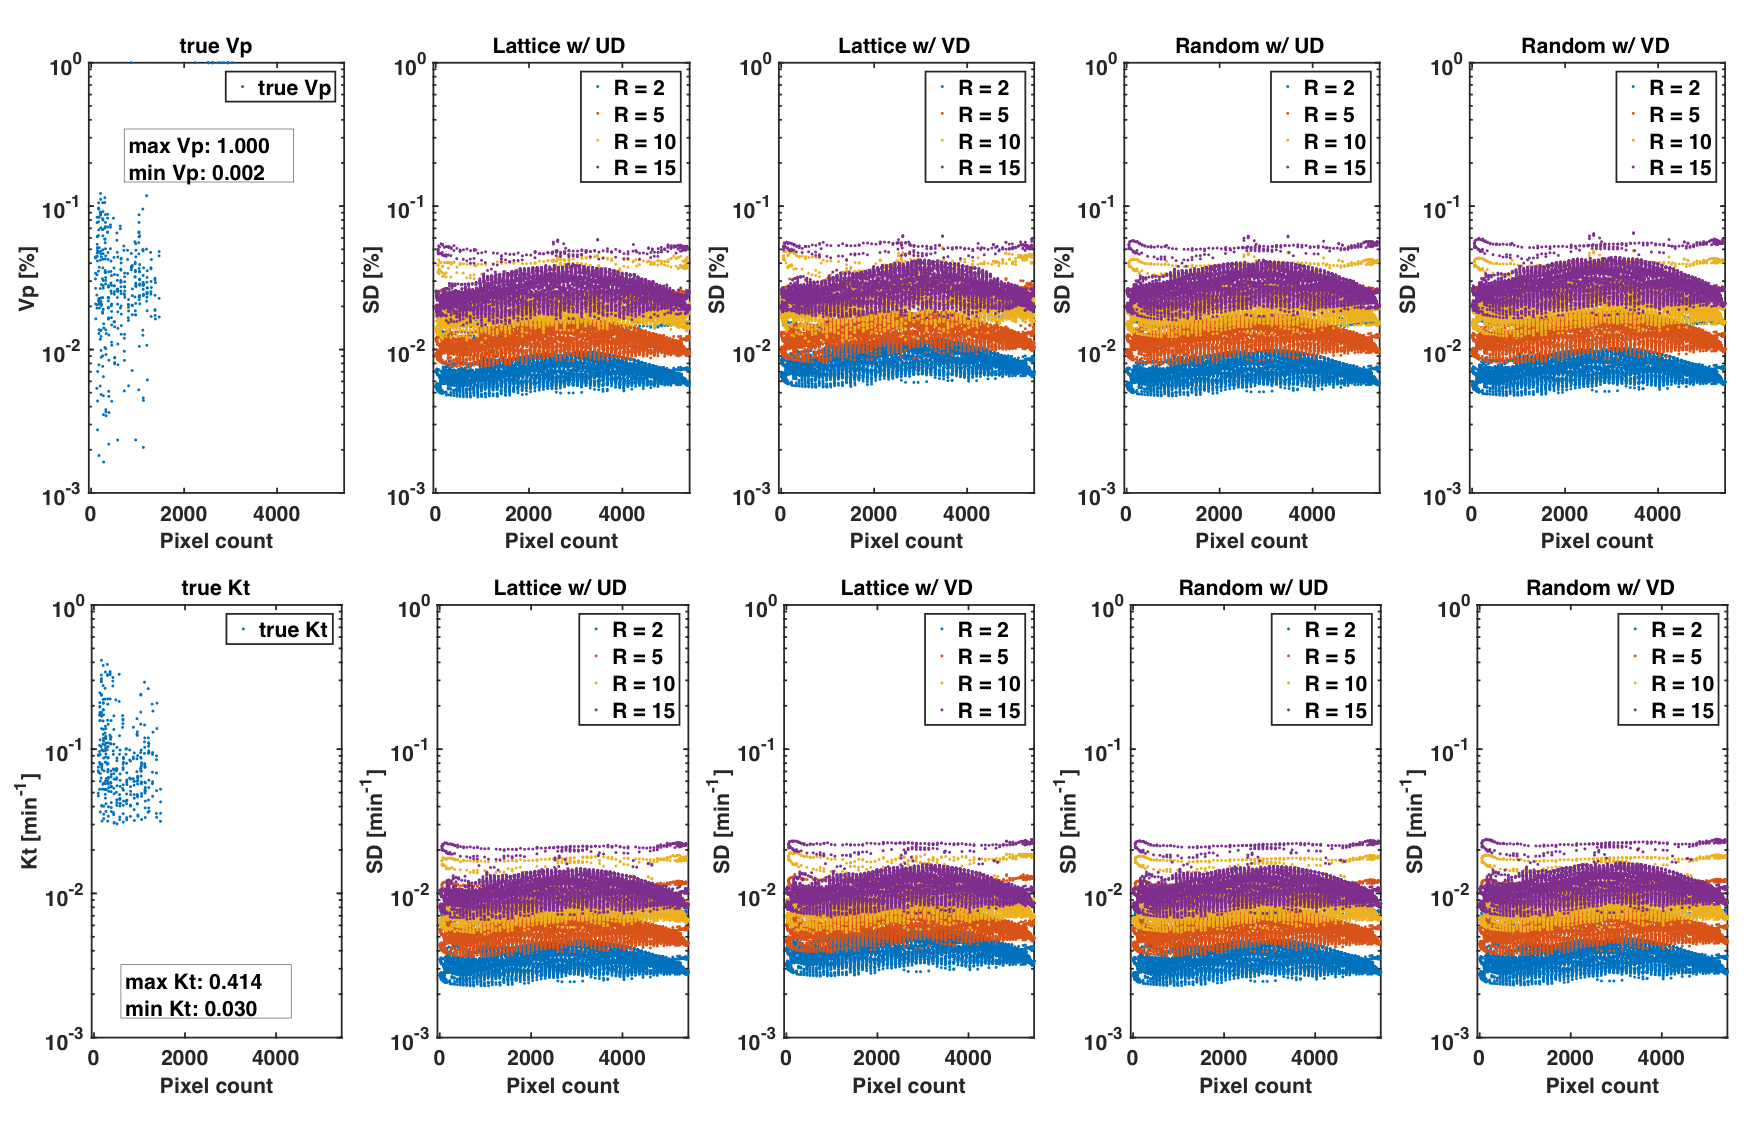
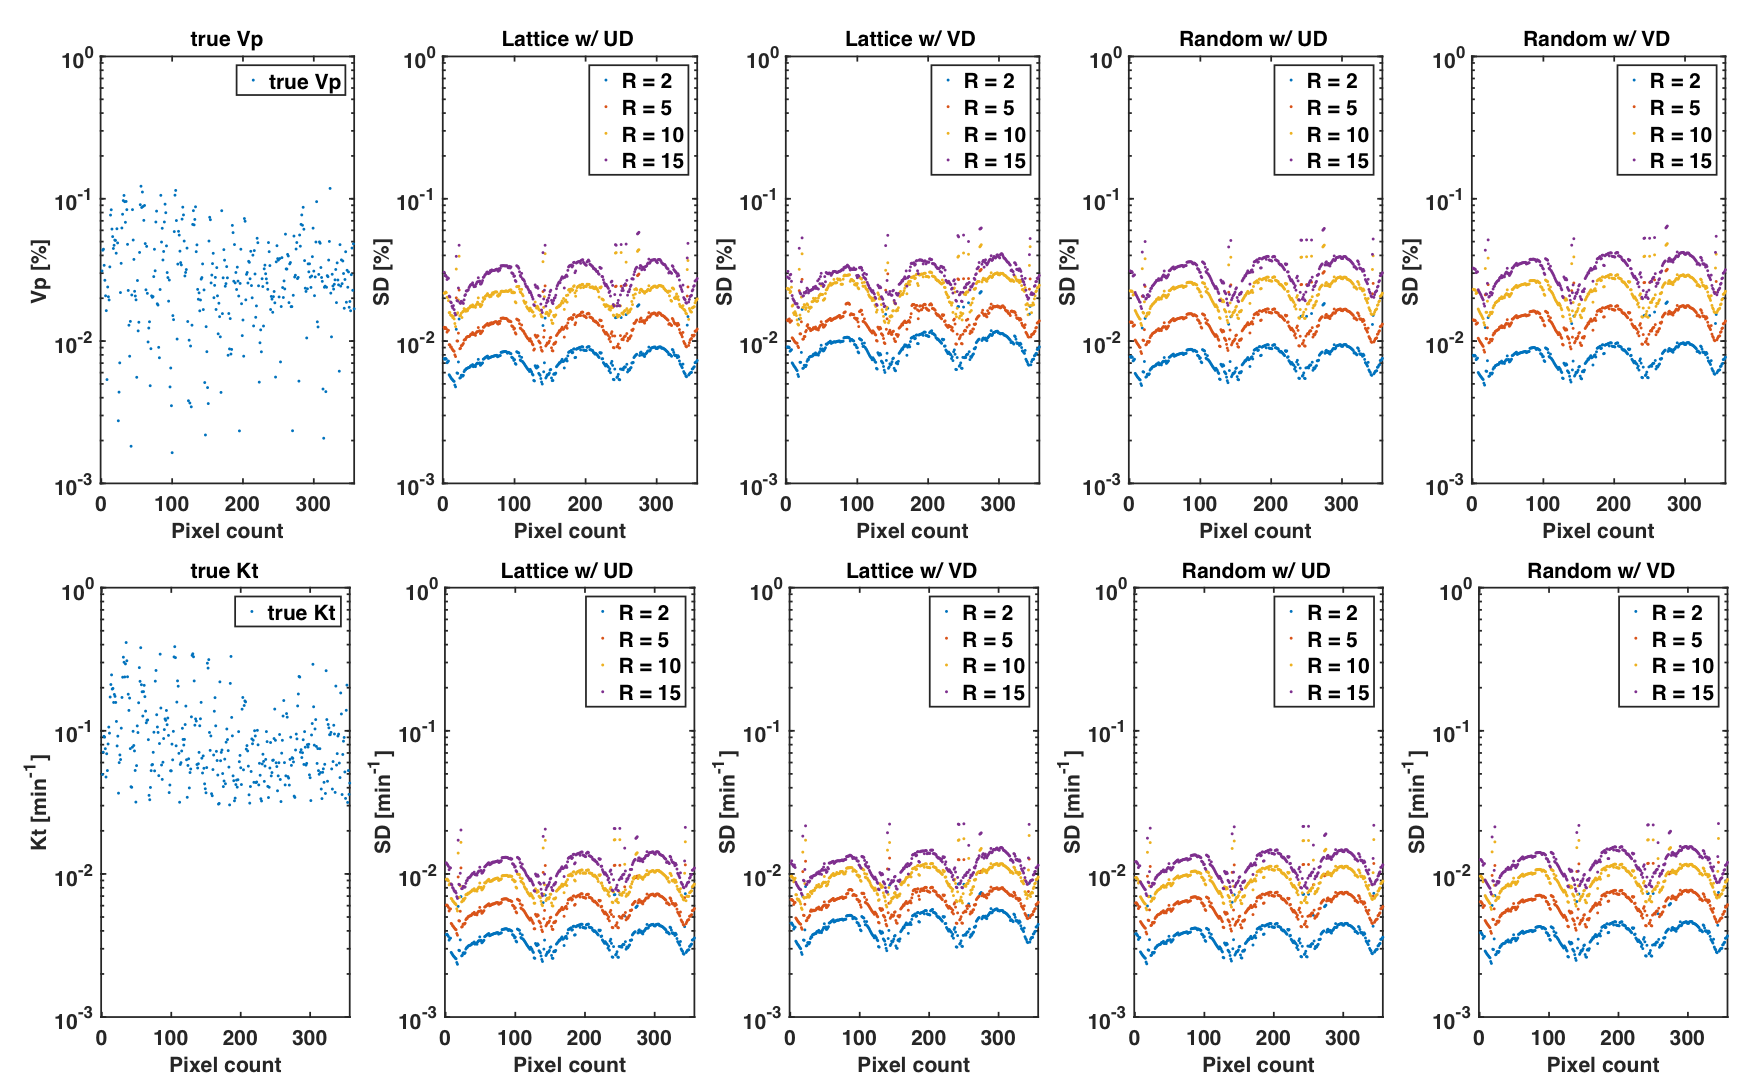
Figure 3 illustrates the best achievable precision for the PK parameters $$$\boldsymbol{v}_p$$$ and $$$\boldsymbol{K}_t$$$ as predicted by the CRB for the whole DRO, while Figure 4 contains the bounds for the tumor ROI only. Monte-Carlo simulations using direct reconstruction of PK parameters 9 have previously confirmed tightness of the bound (not shown). We observed no difference in the minimum achievable variance for pharmaco-kinetic parameter estimation, between lattice and random sampling, nor between uniform and variable density variants. Pairwise differences in $$$\boldsymbol{v}_p$$$ standard deviation were all at least 3-fold lower than the tumor average $$$\boldsymbol{v}_p$$$ value, and 50-fold lower for the clinically relevant $$$\boldsymbol{K}_t$$$ parameter.Discussion
In this work, we used Cramér-Rao analysis to objectively compare lattice-based sampling with random sampling both in their uniform and variable density variants. Extending on the results in a previous study 3 which analyzed common 1D undersampling strategies, the sampling patterns in this study had no discernible impact on the minimum achievable variance for PK parameter estimation. Note that the actual performance of a DCE measurement also depends on the availability of a numerically stable post processing procedure to estimate PK parameters with the predicted variance.
An important limitation of this study is that we assumed perfect knowledge of the AIF, bolus arrival time, and coil sensitivities, and no motion. During a clinical scan these assumptions do not hold. Sampling pattern may indirectly influence PK measurement precision through the ability to more precisely estimate AIF, bolus arrival time, and coil sensitivities, and to correct for motion artifacts.
Acknowledgements
We thank Ryan Bosca for providing the tumor data and helping to generate the DRO.References
1. Y. Cao, “The Promise of Dynamic Contrast-Enhanced Imaging in Radiation Therapy,” Semin. Radiat. Oncol., vol. 21, no. 2, pp. 147–156, 2011.
2. A. K. Heye, R. D. Culling, M. D. C. Valdes Hernandez, M. J. Thrippleton, and J. M. Wardlaw, “Assessment of blood-brain barrier disruption using dynamic contrast-enhanced MRI. A systematic review,” NeuroImage Clin., vol. 6, pp. 262–274, 2014.
3. Y. Bliesener, S. G. Lingala, J. P. Haldar, and K. S. Nayak, “Comparison of (k,t) sampling schemes for DCE MRI pharmacokinetic parameter estimation,” ISMRM 25th Sci. Sess., vol. 10, p. 1909, 2017.
4. S. Cavassila, S. Deval, C. Huegen, D. Van Ormondt, and D. Graveron-Demilly, “Cramér-Rao bounds: An evaluation tool for quantitation,” NMR Biomed., vol. 14, no. 4, pp. 278–283, 2001.
5. S. M. Kay, Fundamentals of Statistical Signal Processing: Estimation Theory, vol. I, no. 4. 1993.
6. G. J. M. Parker, C. Roberts, A. Macdonald, G. A. Buonaccorsi, S. Cheung, D. L. Buckley, A. Jackson, Y. Watson, K. Davies, and G. C. Jayson, “Experimentally-derived functional form for a population-averaged high-temporal-resolution arterial input function for dynamic contrast-enhanced MRI,” Magn. Reson. Med., vol. 56, no. 5, pp. 993–1000, 2006.
7. R. J. Bosca and E. F. Jackson, “Creating an anthropomorphic digital MR phantom—an extensible tool for comparing and evaluating quantitative imaging algorithms,” Phys. Med. Biol., vol. 61, no. 2, pp. 974–982, 2016.
8. P. Stoica and T. L. Marzetta, “Parameter Estimation Problems with Singular Information Matrices,” Methods, vol. 49, no. 1, pp. 87–90, 2001.
9. Y. Guo, S. G. Lingala, Y. Zhu, R. M. Lebel, and K. S. Nayak, “Direct estimation of tracer-kinetic parameter maps from highly undersampled brain dynamic contrast enhanced MRI,” Magn. Reson. Med., vol. 78, no. 4, pp. 1566–1578, 2017.
Figures