0553
Measurement of artifact-free arterial input functions for T1-weighted dynamic contrast-enhanced MRI: Inter- and intra-patient variability1Department of Biomedical Imaging Science, University of Leeds, Leeds, United Kingdom, 2Department of Medical Physics, German Oncology Centre, Limassol, Cyprus, 3Department of Medical Physics & Engineering, Leeds Teaching Hospitals NHS Trust, Leeds, United Kingdom, 4Department of Radiology, Leeds Teaching Hospitals NHS Trust, Leeds, United Kingdom
Synopsis
In 2006, Parker et al published a population-average AIF that has subsequently been used by numerous investigators for both simulation and data analysis. Despite its utility, the published AIF suffers from a number of limitations. In this study we tried to address many of these limitations and made measurements in a population of patients with advanced breast cancer, resulting in a total of 74 individual AIFs. We fitted each AIF with a physiological model and assessed inter- and intra-patient variability.
Introduction
Tracer kinetic modeling of dynamic contrast-enhanced (DCE) MRI data allows the measurement of tissue hemodynamic characteristics and an essential requirement of such modeling is measurement of the arterial input function (AIF)1. Due to several acquisition limitations (e.g. limited temporal resolution, partial volume, B1 inhomogeneity, incomplete RF spoiling and inflow effects) accurate sampling of the AIF is not always possible, and is often replaced with a population-average AIF (AIFpop)2. We have addressed these limitations and measured AIFs in a series of patients, used a functional form to fit to each AIF and assessed the level of variability both between and within patients.Methods
Thirty-three female patients with locally advanced breast cancer undergoing neoadjuvant chemotherapy were enrolled in this prospective multiple visit MRI study. Data were acquired, at 1.5 T (Siemens Aera), in the transverse plane using a bilateral breast coil and a flexible matrix coil. The latter was positioned on the patients’ back to enhance the signal from the descending aorta. A 3D inversion recovery (IR) prepared TurboFLASH sequence (Table 1) was used for T1 measurement before and after the dynamic acquisition. High temporal resolution DCE data were acquired using a 3D FLASH sequence (Table 1) interleaved with the acquisition of high spatial resolution data3. Gd-DOTA (Doteram) was administered intravenously using a power injector at a dose of 0.1 mmol/kg, followed by 20 ml of saline, at a rate of 3 ml/s.
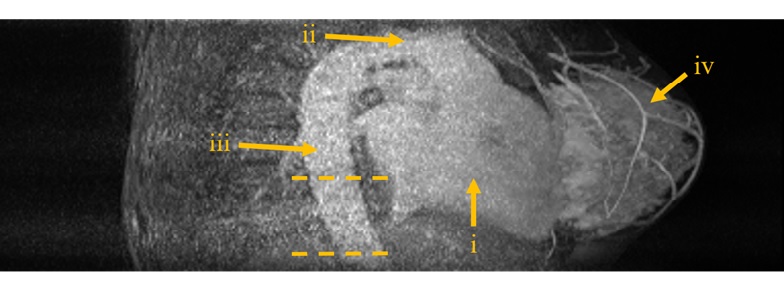
Regions of interest (ROIs) were drawn in the descending aorta on several inferior slices (Figure 1). T1 relaxation times were estimated by fitting the IR turboFLASH signal equation to the measured signal at both baseline and tail4,5 and a bookend correction was applied to the signal intensity time series as described by Cron et al6. Contrast agent concentration was calculated using a Dotarem relaxivity of 4.2 s-1 mM-1 in blood7. For accurate interpolation and integration, a functional form of the AIF8 was fitted to the acquired data. Using the area under the first pass peak (AUC1st) and indicator dilution principles the patients’ cardiac output (CO) was estimated at each visit9. To assess reproducibility of AIF measurement we examined the variability of pre-contrast T1, AUC1st and CO estimates using a one-way analysis of variance (ANOVA) for repeated measurements and the inter- and intra-patient coefficients of variability (COV).
Results
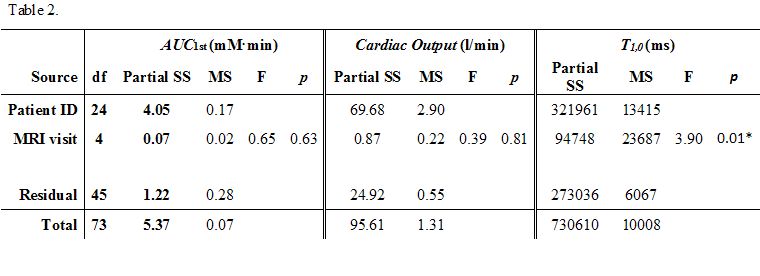
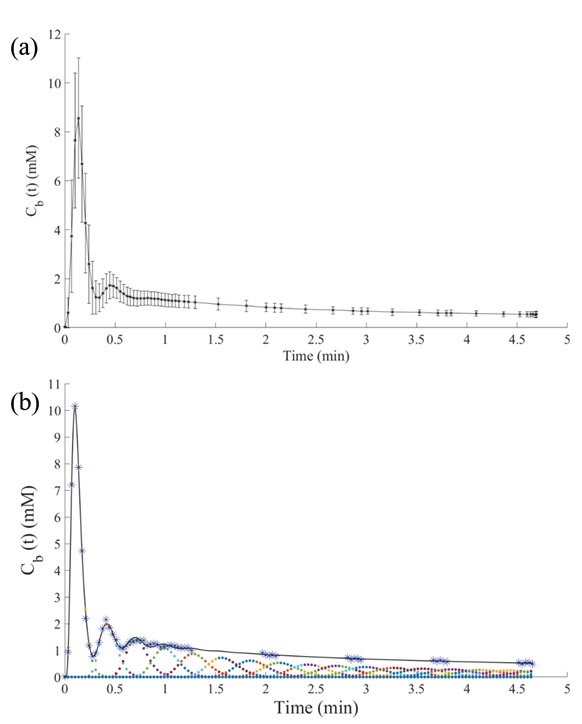
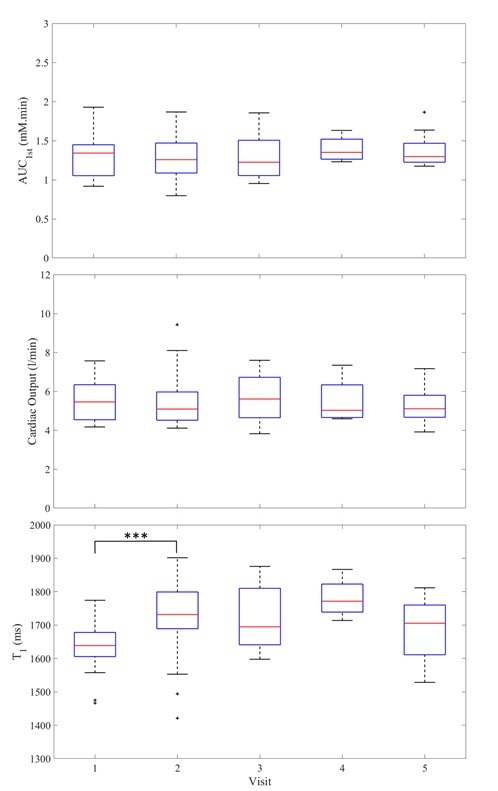
After removing sub-optimal data (no back coil, non-standard injection, motion artifact or missing IR data) 74 data sets from 33 patients, who made up to 5 visits each, were analyzed. Figure 2a shows AIFpop calculated from all data sets. Figure 2b demonstrates how well the functional form fits to an individual AIF. Figure 3 shows boxplots for pre-contrast T1, AUC1st and CO per visit. The ANOVA test (Table 2) demonstrated that there were no significant differences between visits for both AUC1st and CO, but there was a significant difference in the blood T1 of visits 1 and 2. Furthermore, for both AUC1st and CO the variability within patients (mean squares (MS) = 0.02 (mM.min)2 and 0.22 (l/min)2, respectively) was lower than the variability between patients (MS = 0.17 (mM.min)2 and 2.90 (l/min)2). Moreover, the inter- and intra-patient COV were estimated to be 21% and 11% for AUC1st, 19% and 11% for CO and 4.6% and 4.4% for T1.Discussion
Figure 2 demonstrates that the temporal characteristics of the first, second and third bolus passes seen in an individual AIF (Fig. 2b) are lost in AIFpop (Fig. 2a). Furthermore, analysis of AUC1st and CO demonstrate that inter-patient variability was higher than intra-patient variability. Even within the same patient, the AIF may exhibit variability because of changes in weight, CO, kidney function or hematocrit (the increase in T1 seen at visit 2 reflects a significant decrease in hematocrit induced by the 1st cycle of chemotherapy). CO estimates (5.5 ± 1.1 l/min over all visits) are in very good agreement with the typical range expected in female patients at rest and lying prone10. This contrasts with an unrealistically high CO of 10.5 l/min9 estimated from the AIFpop of Parker et al2.Conclusion
We addressed previous limitations by acquiring data at high temporal resolution, in a large vessel while suppressing inflow and using a bookend T1 correction to make artifact-free measurements of the AIF. Using a physiologically-based AIF model we have demonstrated that intra-patient reproducibility is excellent, and CO is within expected values, whereas inter-patient variability is high and use of an AIFpop for monitoring individual patients is likely to introduce errors into tracer kinetic analysis.Acknowledgements
The study was funded by Breast Cancer Now (award 2014MayPR241).References
1. Sourbron SP, Buckley DL. Tracer kinetic modelling in MRI: estimating perfusion and capillary permeability. Phys Med Biol. 2012;57:R1-R33.
2. Parker GJ, Roberts C, Macdonald A, Buonaccorsi GA, Cheung S, Buckley DL, et al. Experimentally-derived functional form for a population-averaged high-temporal-resolution arterial input function for dynamic contrast-enhanced MRI. Magn Reson Med. 2006;56:993-1000.
3. Georgiou L, Sharma N, Broadbent DA, et al. Estimating Breast Tumor Blood Flow During Neoadjuvant Chemotherapy Using Interleaved High Temporal and High Spatial Resolution MRI. Magn Reson Med. 2017;DOI 10.1002/mrm.26684.
4. Brix G, Schad LR, Deimling M, et al. Fast and precise T1 imaging using a TOMROP sequence. Magn Reson Imaging. 1990;8:351-356.
5. Kershaw LE, Hutchinson CE, Buckley DL. Benign prostatic hyperplasia: Evaluation of T1, T2, and microvascular characteristics with T1-weighted dynamic contrast-enhanced MRI. J Magn Reson Imaging. 2009;29:641-648.
6. Cron GO, Santyr G, Kelcz F. Accurate and Rapid Quantitative Dynamic Contrast-Enhanced Breast MR Imaging Using Spoiled Gradient-Recalled Echoes and Bookend T 1 Measurements. Magn Reson Med. 1999;753:746-753.
7. Rohrer M, Bauer H, Mintorovitch J, Requardt M, Weinmann H-J. Comparison of magnetic properties of MRI contrast media solutions at different magnetic field strengths. Invest Radiol. 2005;40:715–724.
8. Horsfield MA, Thornton JS, Gill A, Jager HR, Priest AN, Morgan B. A functional form for injected MRI Gd-chelate contrast agent concentration incorporating recirculation, extravasation and excretion. Phys Med Biol. 2009;54:2933–2949.
9. Yang C, Karczmar GS, Medved M, Oto A, Zamora M, Stadler WM. Reproducibility assessment of a multiple reference tissue method for quantitative dynamic contrast enhanced-MRI analysis. Magn Reson Med. 2009;61:851-9.
10. Dharmavaram S, Jellish WS, Nockels RP, et al. Effect of Prone Positioning Systems on Hemodynamic and Cardiac Function During Lumbar Spine Surgery: An Echocardiographic Study. Spine. 2006;31:1388-1393.
Figures
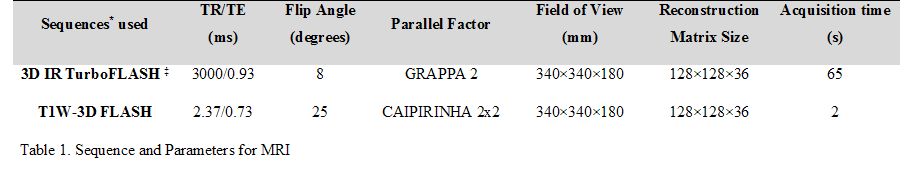
*CAIPIRINHA=controlled aliasing in parallel imaging results in higher acceleration, FLASH=fast low angle shot, GRAPPA=generalized auto-calibrating partially parallel acquisition, IR=inversion recovery, T1W=T1-weighted.
‡ IR-TR of 3000 ms repeated at 4 inversion times: 100/600/1200/2800 ms.