0551
Improving Arterial Spin Labeling using Deep Learning1Department of Bio and Brain Engineering, Korea Advanced Institute of Science & Technology (KAIST), Daejeon, Republic of Korea, 2Department of Radiology, Seoul National University College of Medicine, Seoul, Korea, Democratic People's Republic of
Synopsis
We proposed a new convolutional neural network (CNN) framework to quantify cerebral blood flow (CBF) in Hadamard-encoded pseudo-continuous arterial spin labeling (HE-pCASL). Improving sensitivity and robustness in ASL signals allows CNNs to quantify CBF accurately with a smaller number of data acquisitions. The proposed methods outperformed the conventional averaging method in both normal and pathologic regions. Therefore, CNNs can be a good alternative to quantify CBF in ASL imaging.
Introduction
Multiple post-labeling delay (PLD) arterial spin labeling (ASL) can be performed for accurate quantification of cerebral blood flow (CBF), but it requires a long scan time. Hadamard-encoded ASL is a complicated but efficient way to achieve the goal [1], but it requires acquisition and processing of many datasets with various labeling and PLD blocks, leading to high sensitivity to motion and lower temporal resolution. In this study, we propose a deep learning framework that enables to quantify cerebral blood flow (CBF) with higher accuracy and robustness using a smaller number of temporal encoding points. The proposed method was tested in patients with perfusion abnormality.Methods
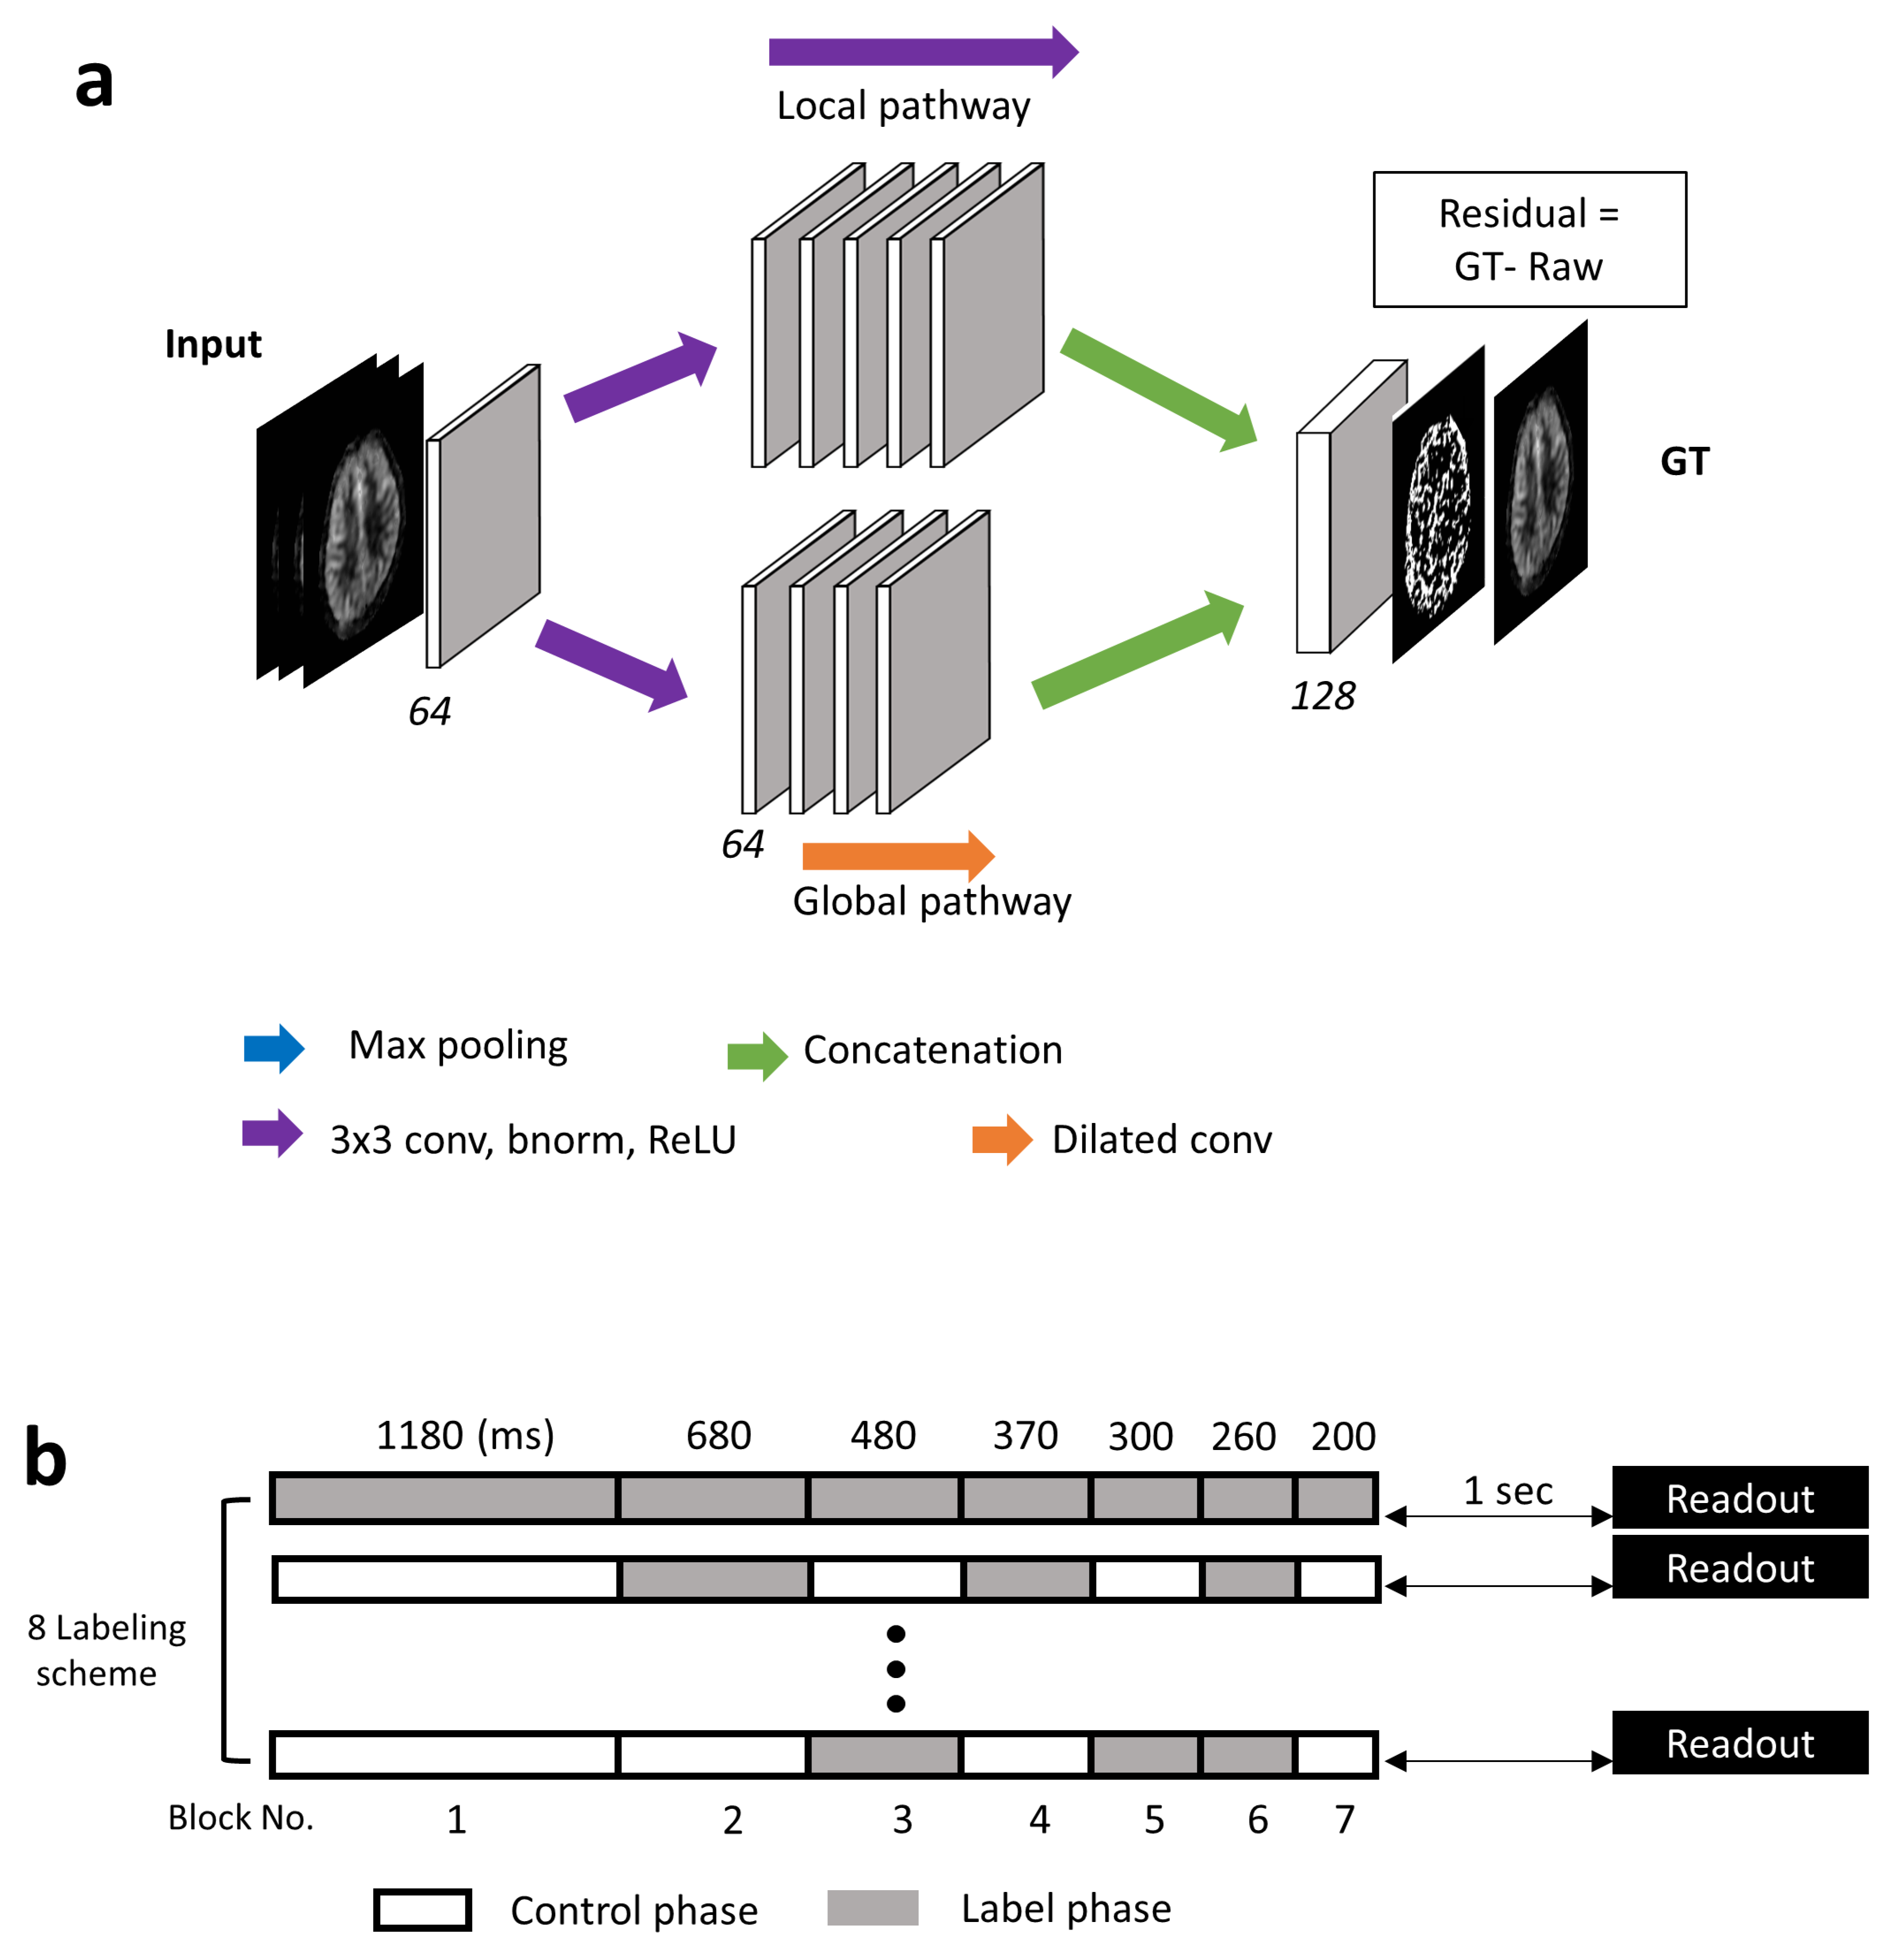
The proposed CNN framework consisted of two parallel pathways for extracting multi-scale information efficiently; (i) a local pathway for extracting low level features and (ii) a global pathway for incorporating large scale contextual information (Fig. 1a). The global pathway had four dilated convolution layers with dilation factors of 2, 4, 8, and 16, to aggregate large scale information without losing resolution. Then, both local and global pathways were concatenated for integrating the multi-scale contextual information. Finally, CNNs were trained through residual learning [2, 3].
This was a retrospective study with approval from the institutional review board and waiver of informed consent. The proposed CNN was evaluated using 114 datasets of Hadamard-encoded pCASL in 3T MRI scanner (Discovery MR750w, GE Healthcare, Milwaukee, Wisconsin, USA). The default parameters in experiments and simulations were: FOV=240×240×140 mm3, matrix = 128×128×28, slice thickness=4mm, and TR/TE =5901/11ms. Hadamard-encoded RF pulse combinations were used to generate 8 baseline images, which were combined in different ways to reconstruct seven perfusion images with PLDs ranging from 1.0 to 3.3 sec (Fig. 1b) [1]. Using signal-weighted delay (WD) measurement and the kinetic model, seven CBF maps were quantified from the seven PLD perfusion images separately [4, 5]. GT was calculated by averaging all the seven PLD data. CBF maps of the proposed CNN and average (Avg) were produced by taking 2nd, 4th, and 6th PLD data.
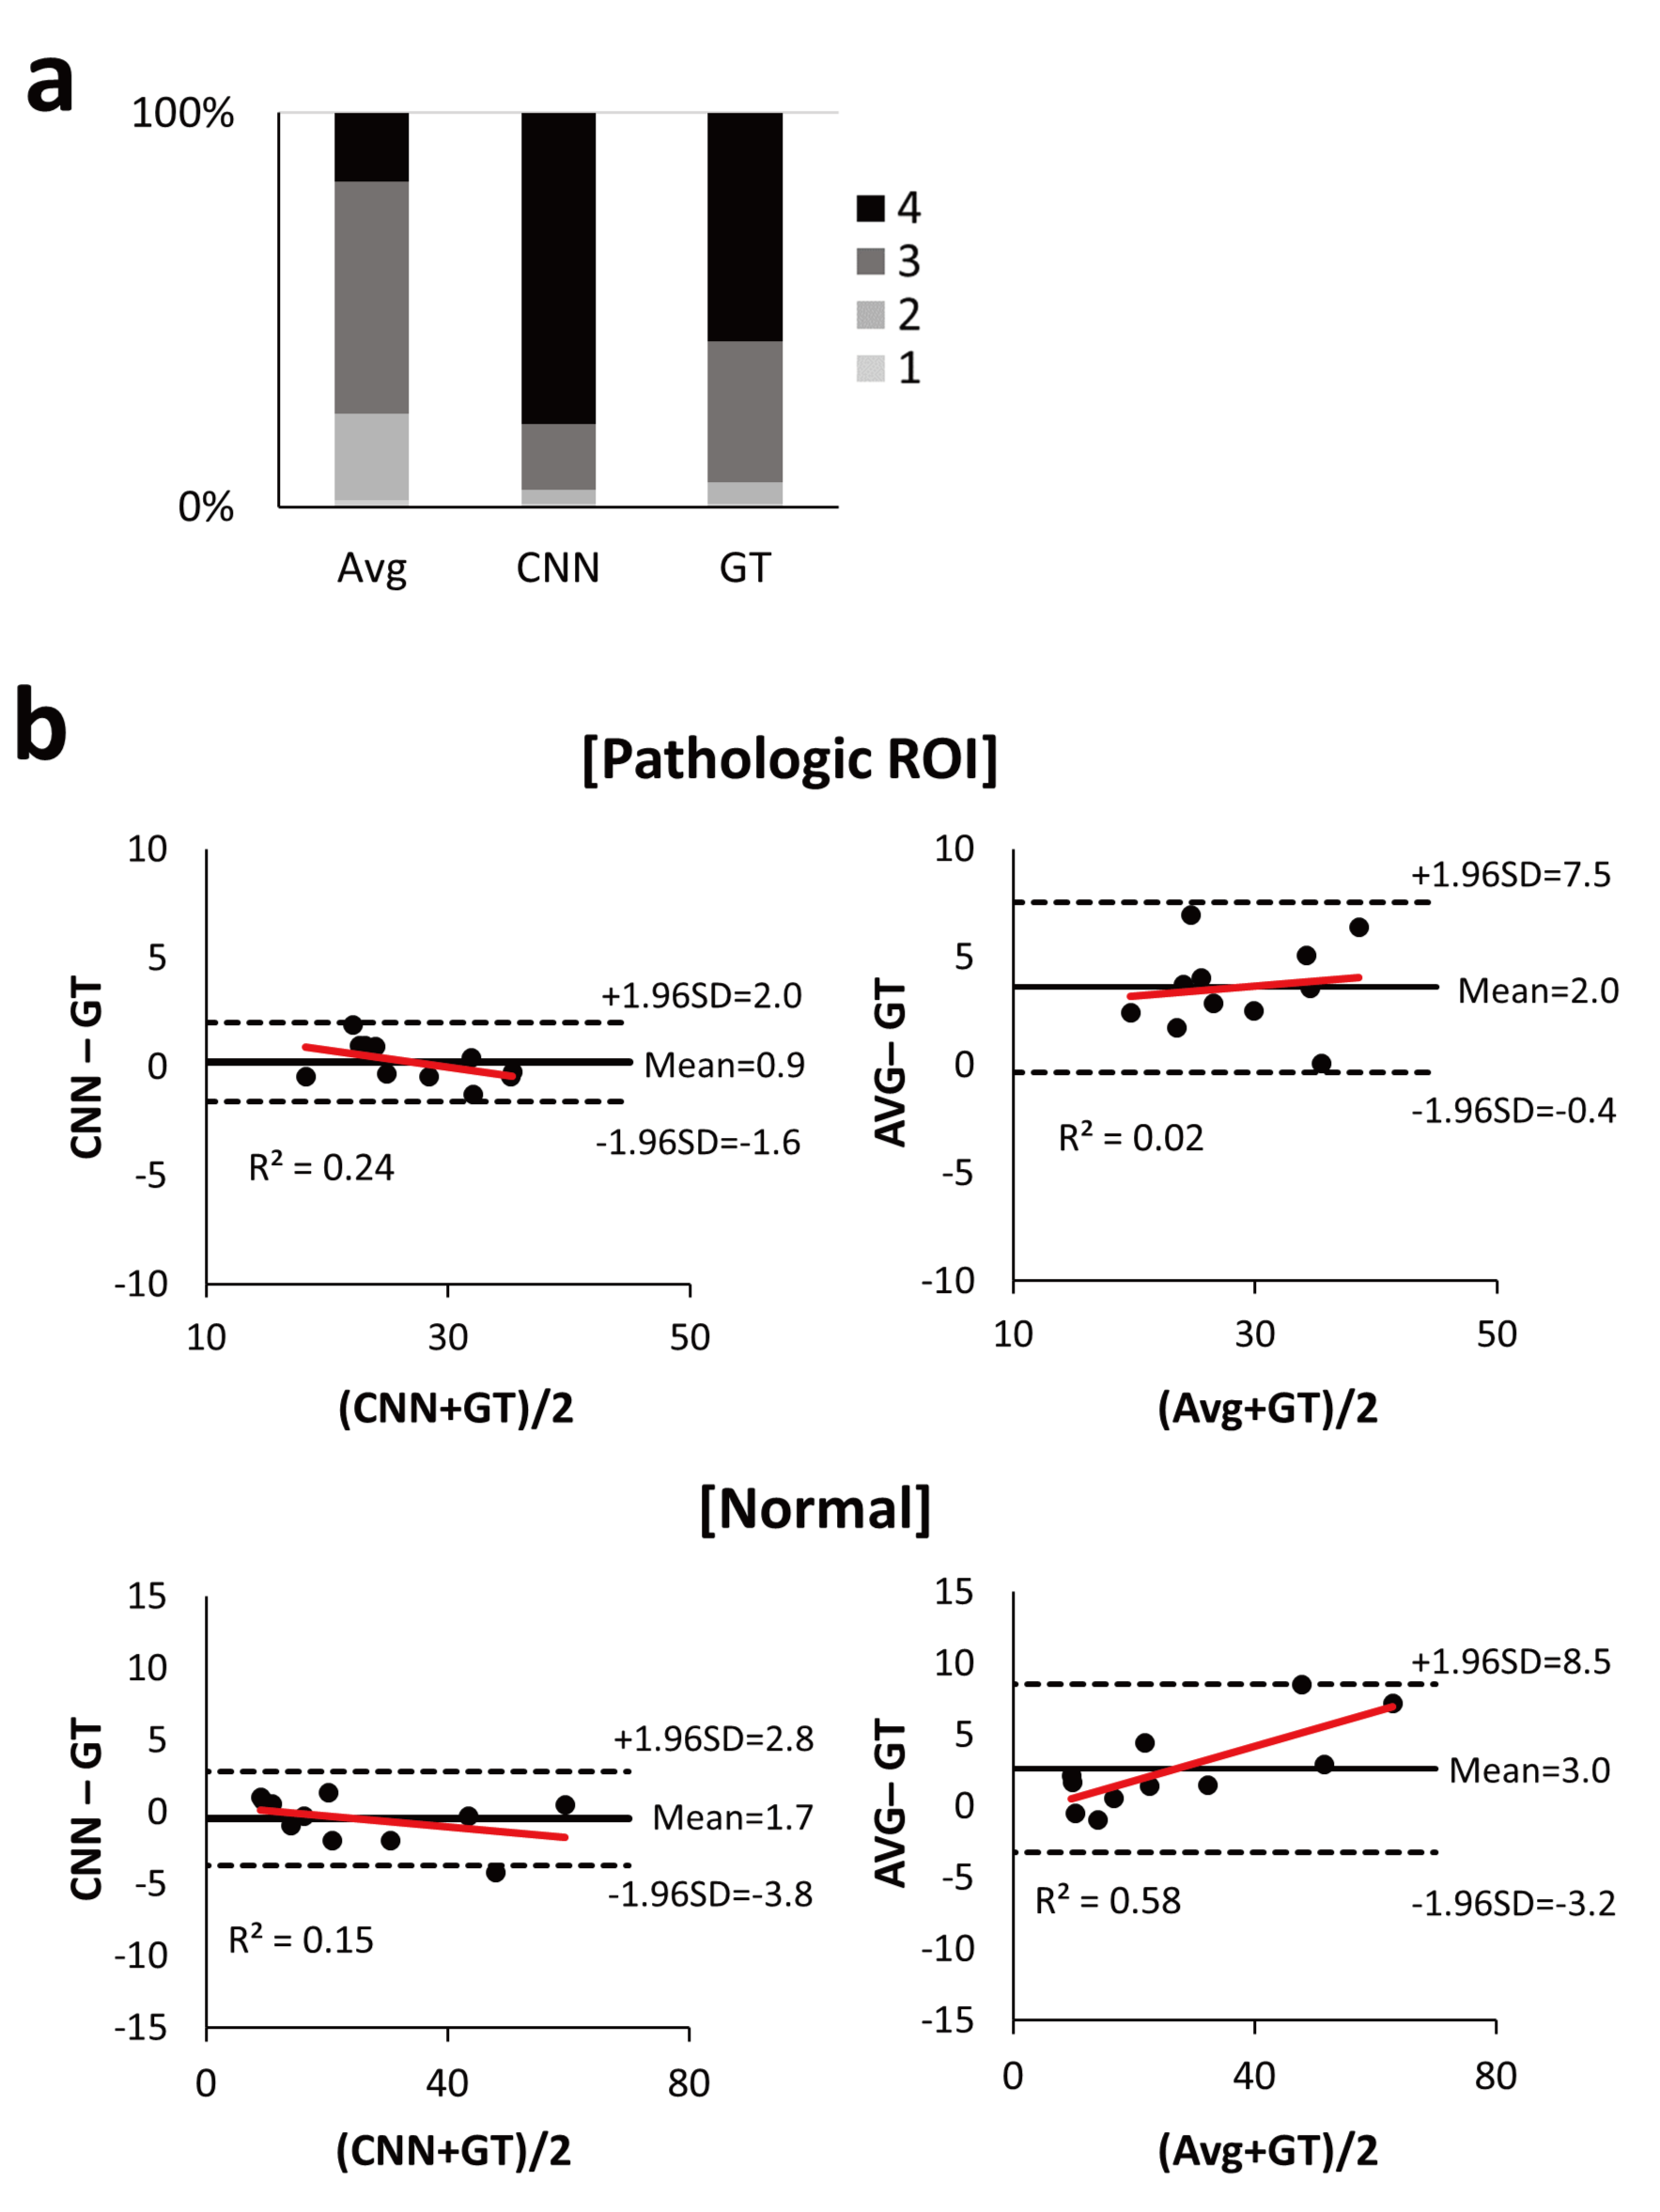
The performance of CNNs was evaluated by averaging mean square error (MSE) values from N-fold cross validation (N=6): datasets of 95 selected patients and the remaining 19 patients were used for training and testing, respectively. After cross-validation, CNNs were trained using the datasets of all the 114 patients and tested using datasets of separate 26 stroke patients. Performance of CNNs was compared to that of Avg in terms of MSE using the paired t-test. The radiologic scores were also qualitatively assessed using a four-point scale (1 = severe noise/motion artifact, 2 = moderate noise/motion artifact, 3 = mild noise/motion artifact, 4 = clear perfusion map) by a blinded radiologist and statistically compared using the Wilcoxon signed-rank test. Two regions of interest (ROIs) representing normal and pathologic regions were manually drawn by a radiologist in the images of the perfusion abnormalities with the largest lesion size. For the normal and pathologic ROIs, concordance between CBF maps from GT and CNN/Avg were evaluated with Bland-Altman analysis.
Results
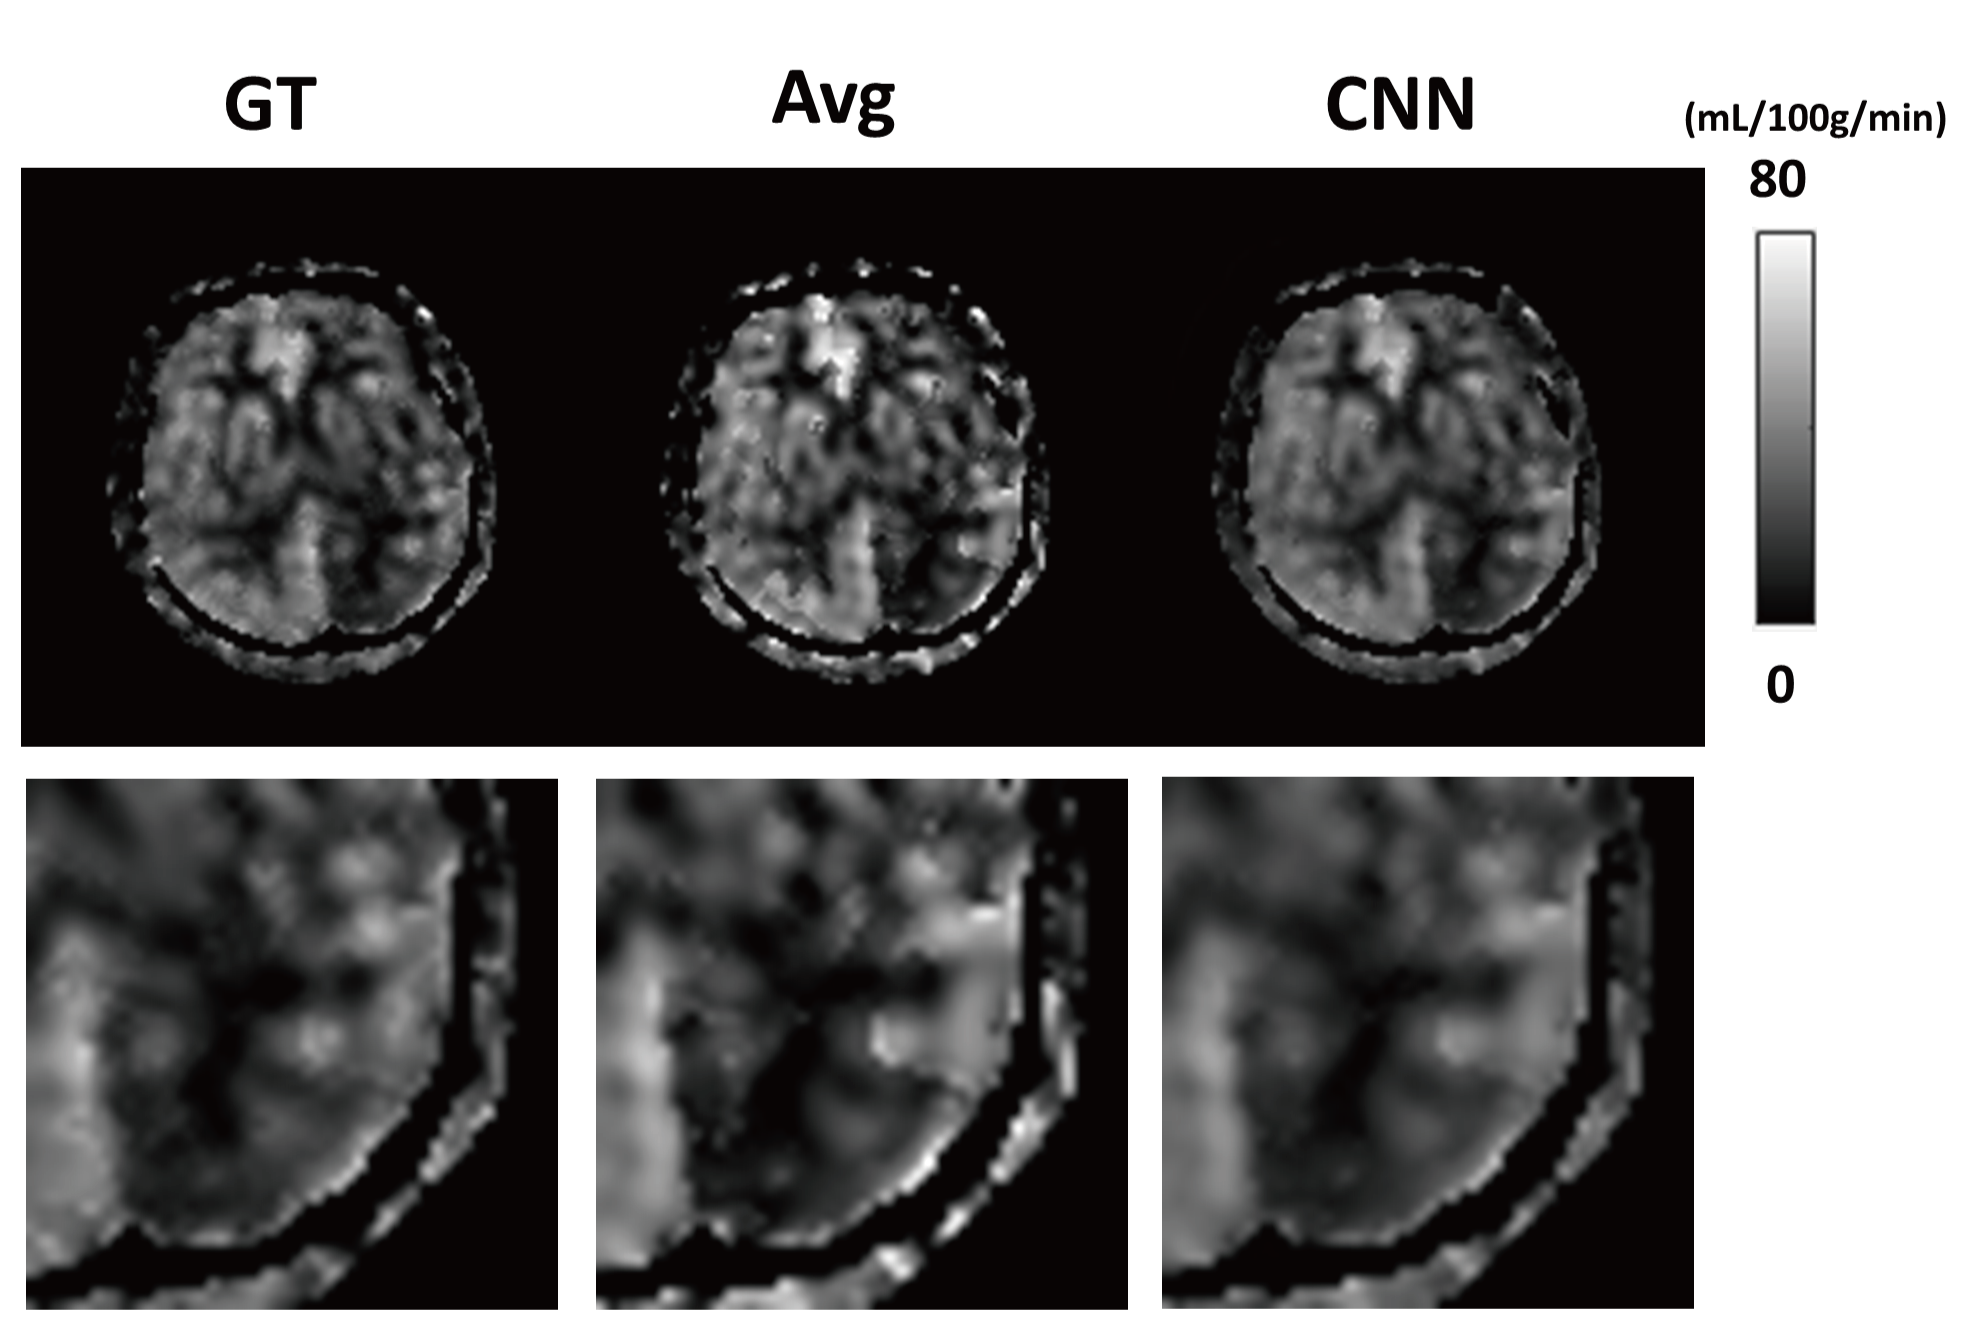
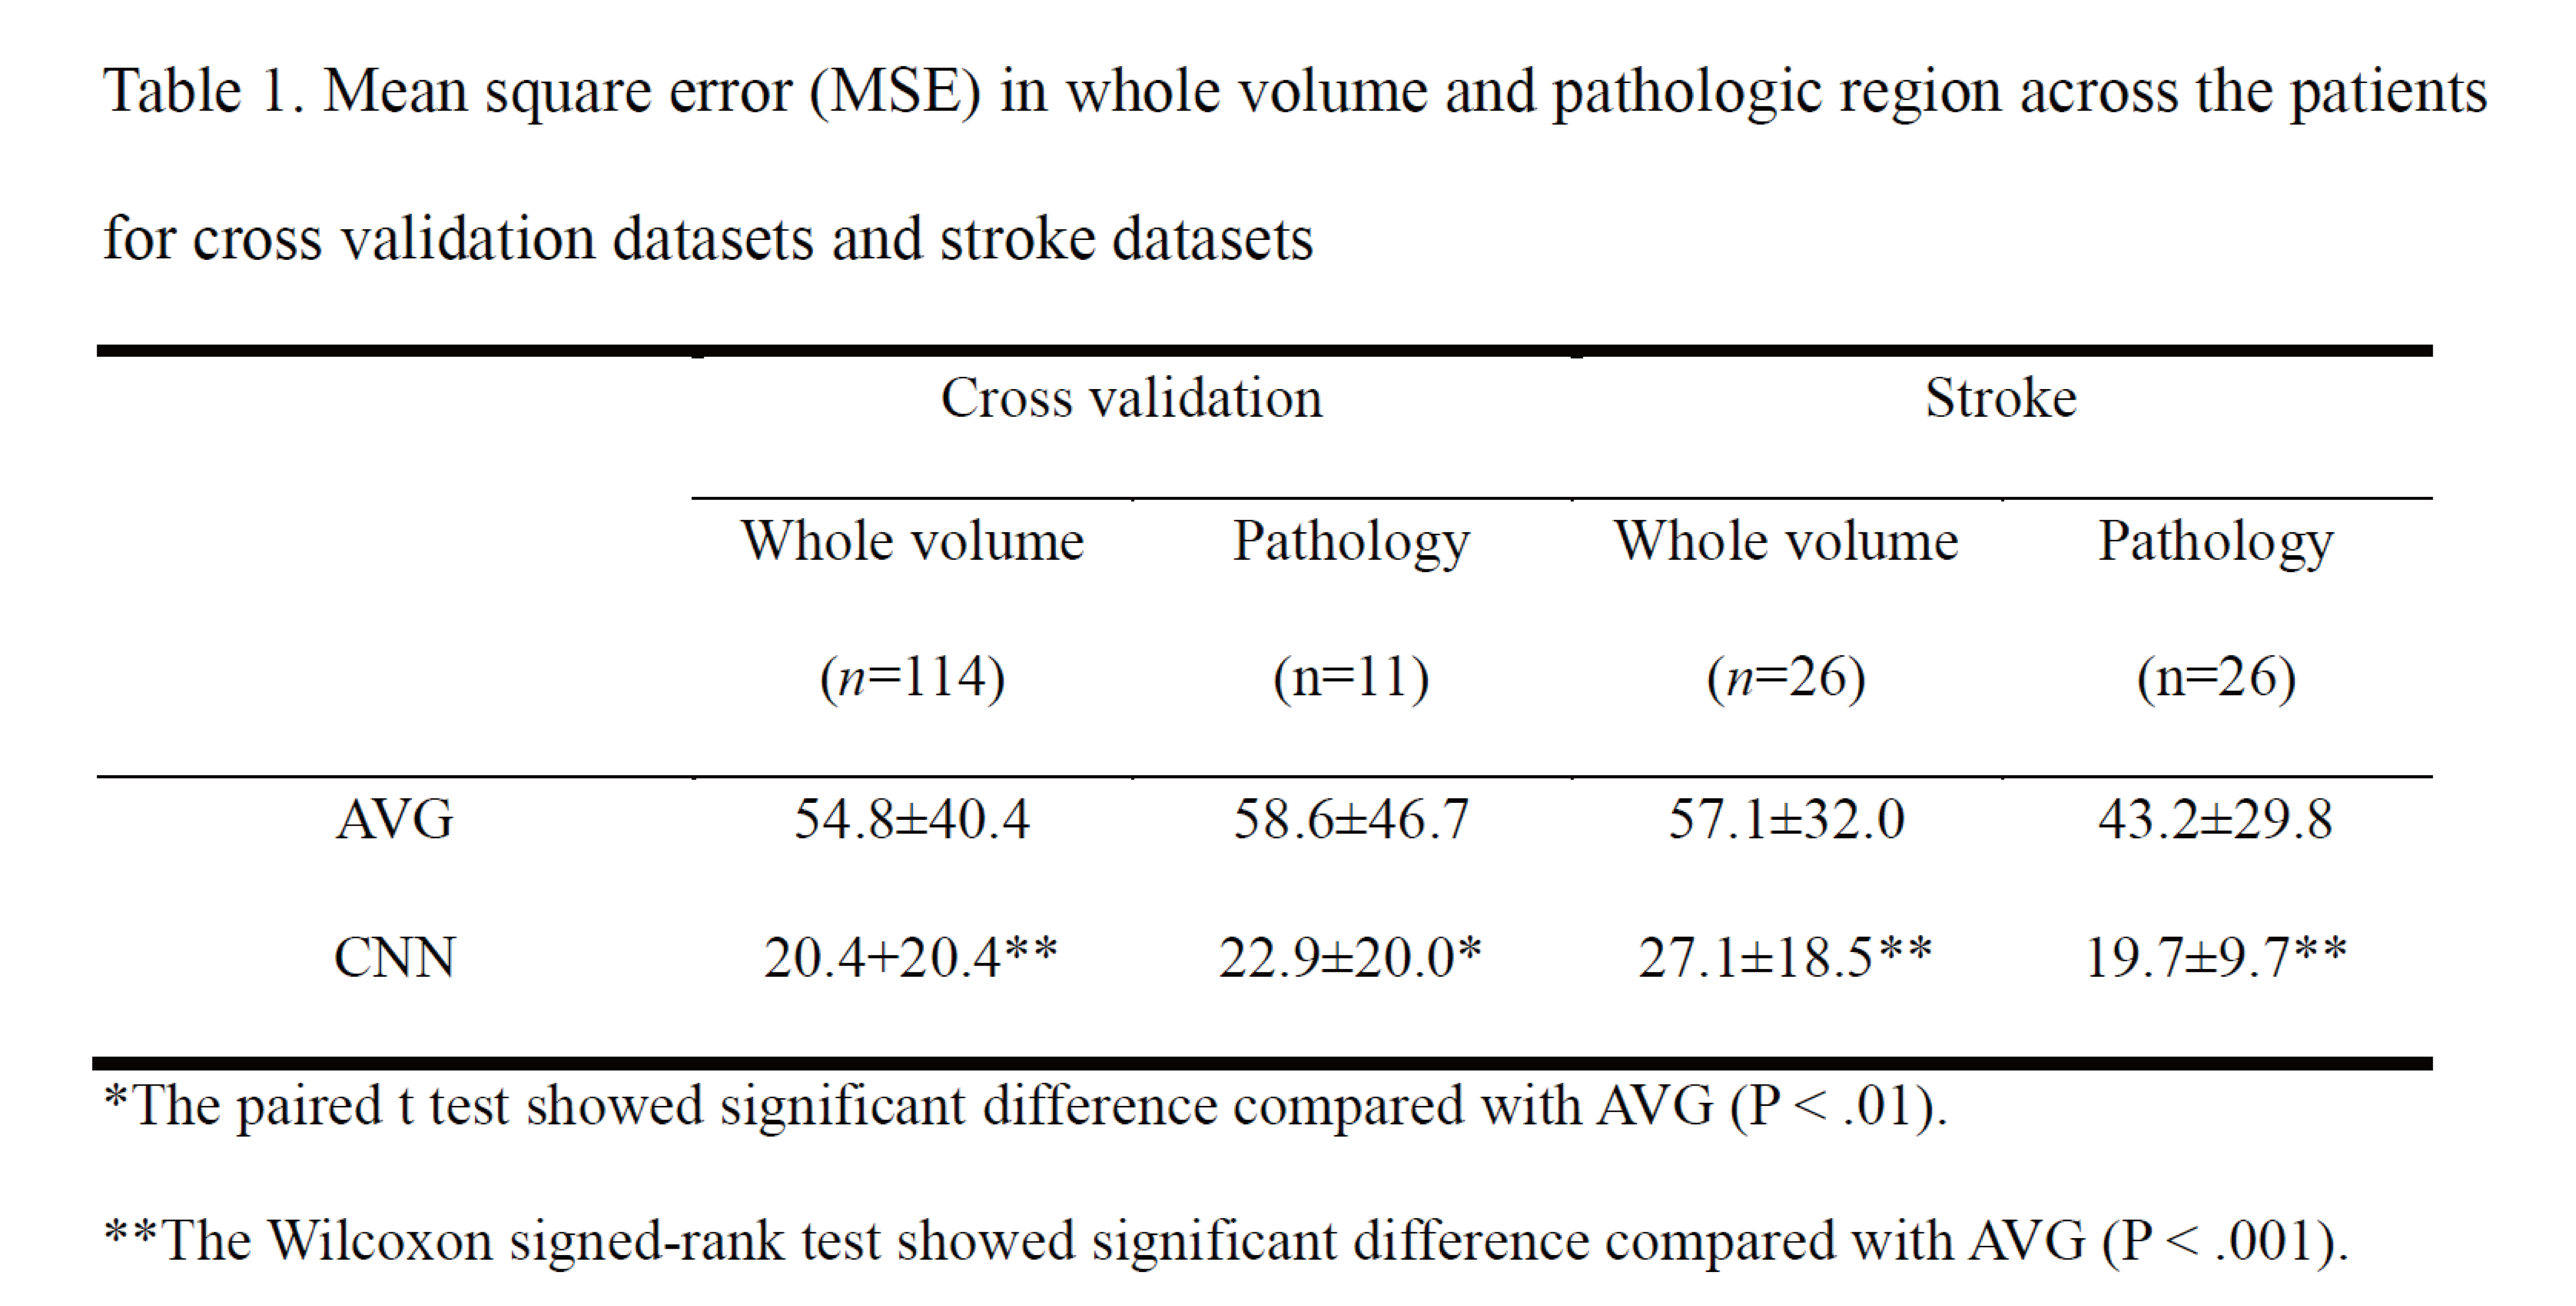
In cross validation, CNNs provided CBF maps closer to those of GT than Avg (Fig. 2). MSE values of CNNs were significantly lower than those of Avg in the entire datasets (n=114) and pathologic ROIs (n=11) (Table 1), indicating that CNNs provide more accurate CBF maps than Avg irrespective of the presence of pathology. CNNs showed higher radiologic score than those of Avg (P<.001) (Fig. 3a). Bland-Altman analysis showed narrower limit of agreement for CNN than those for Avg, irrespective of presence of pathology (Fig. 3b). The results of 26 stroke patients were consistent with those of the cross validation (Fig. 4). MSE of CNNs was smaller than that of Avg in the whole image volumes and stroke regions (Table 1), indicating that CNNs maintain their performance in the stroke regions. CNNs showed significantly higher radiologic score than Avg (P<.001) (Fig. 4a). Bland-Altman analysis in the ROIs showed smaller mean bias and narrower limit of agreement for CNN (Fig. 4b).Discussion
CBF maps from three PLD datasets with CNNs were comparable to those from seven PLD datasets with Avg, implying reduction in scan time for separate multiple-PLD ASL studies and reduction in number of temporal encoding points for Hadamard encoded ASL studies. Fewer temporal encoding points for Hadamard‑encoded pCASL will provide additional advantages of less sensitivity to motion artifacts and higher temporal resolution.Conclusion
CNNs generate more accurate CBF maps in ASL perfusion imaging than Avg for a small number of temporal encoding points, which was proved in both normal and pathology. Therefore, CNNs can be a good processing strategy for ASL.Acknowledgements
This work was supported by the Korea Health Technology R&D Project through the Korea Health Industry Development Institute (KHIDI), funded by the Ministry of Health & Welfare of South Korea (HI16C1111), by the National Research Foundation of Korea (2017R1A2B2006526), by the Bio & Medical Technology Development Program of the NRF funded by the Korean government, MSIP (2015M3A9A7029740), by the Brain Research Program through the National Research Foundation of Korea (NRF) funded by the Ministry of Science, ICT & Future Planning (2016M3C7A1914002), by Creative-Pioneering Researchers Program through Seoul National University (SNU), and by Project Code (IBS-R006-D1).References
1. Wells JA, Lythgoe MF, Gadian DG, Ordidge RJ, Thomas DL. In vivo Hadamard encoded continuous arterial spin labeling (H-CASL). Magn Reson Med 2010;63(4):1111-1118.
2. He K, Zhang X, Ren S, Sun J. Deep Residual Learning for Image Recognition. ArXiv pre-prints.
3. Kim J, Lee JK, Lee KM. Accurate Image Super-Resolution Using Very Deep Convolutional Networks. ArXiv pre-prints.
4. Wang DJ, Alger JR, Qiao JX, Gunther M, Pope WB, Saver JL, Salamon N, Liebeskind DS, Investigators US. Multi-delay multi-parametric arterial spin-labeled perfusion MRI in acute ischemic stroke - Comparison with dynamic susceptibility contrast enhanced perfusion imaging. Neuroimage Clin 2013;3:1-7.
5. Dai W, Robson PM, Shankaranarayanan A, Alsop DC. Reduced resolution transit delay prescan for quantitative continuous arterial spin labeling perfusion imaging. Magn Reson Med 2012;67(5):1252-1265.
Figures