0550
The Influence of the cardiac cycle on velocity-selective and acceleration-selective Arterial Spin Labeling1C.J. Gorter Center for High Field MRI, Leiden University Medical Center, Leiden, Netherlands, 2Imaging Division, University Medical Center Utrecht, Utrecht, Netherlands
Synopsis
In this study we investigated whether velocity-selective arterial spin labeling (VS-ASL) and acceleration-selective spin labeling (Acc-ASL) can be used to measure pulsatility in the microvascular system of the brain, since the amount of generated label will depend on the velocity or acceleration of the spins at the moment the VS-ASL (Acc-ASL) module is applied. Results showed no significant variation in the amount of label when applying these modules at different cardiac phases. However, the generated label did show a pattern which coincides with the flow territories, suggesting a underlying physiological cause.
Introduction
Velocity-selective arterial spin labeling (VS-ASL)1 and acceleration-selective arterial spin labeling (Acc-ASL)2 are two ASL methods that exhibit smaller transit time artifacts by also labeling spins within the imaging region, based on their velocity or acceleration. However, because of pulsatility of blood flow, variations can be expected in the amount of label created, dependent on the cardiac phase during which the VS- or Acc-ASL module is performed. It is important to know whether this effect is significant for the correct interpretation of these techniques, as well as to maximize temporal SNR. In addition, this information could be highly interesting for the purpose of quantifying pulsatility in the smallest vessels, i.e. determining the pulse wave velocity up to the level of the microvasculature. In this study effects of the cardiac cycle on the produced amount is investigated for both VS-ASL and Acc-ASL.Methods
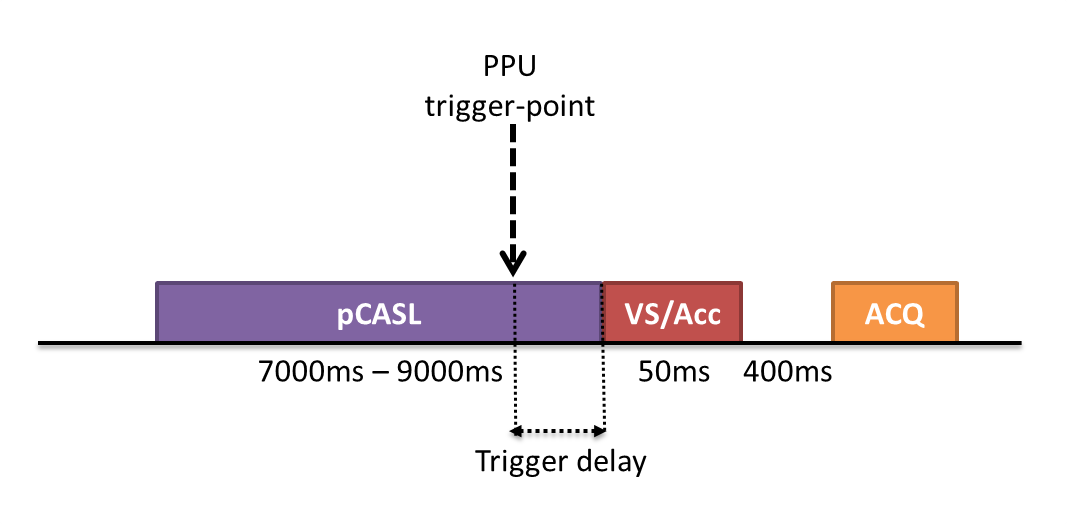
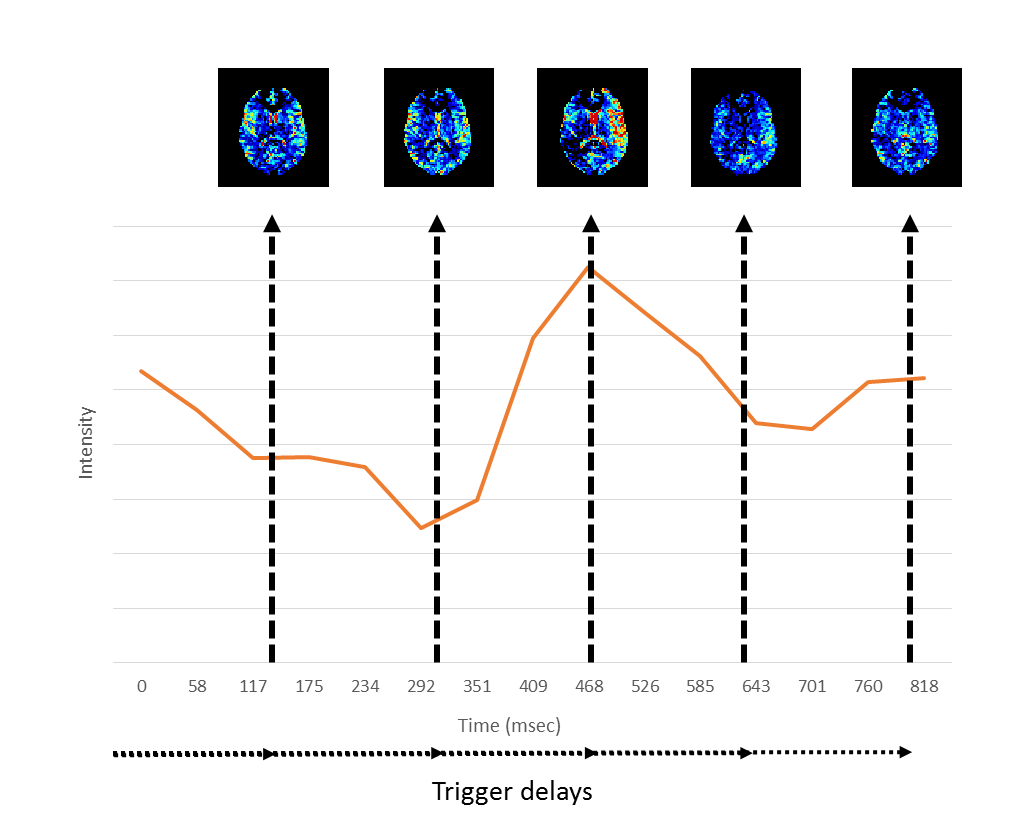
Measurement of the influence of the cardiac cycle on ASL is always challenging, since the cardiac cycle can affect the labeling process, as well as the transport of the label during the post-labeling-delay (PLD). To isolate the effect on the labeling, pCASL with a long labeling-duration of approximately 7 seconds was used to fill up the vasculature with label, followed by crushing with a VS- or Acc-ASL saturation module applied at different cardiac phases (see Figure 1). The scans combining pCASL with a VS-ASL or Acc-ASL module had a total scan time of 35mins, with ten averages for each label/control combination, a scan resolution of 3x3x7mm, seventeen slices, TR/TE of 10000ms/14ms and a 2D-EPI single-shot readout. For the VS-ASL module a gradient strength of 13mT/m was used and for Acc-ASL 30mT/m, both used a gradient duration of 1ms and total duration of 37ms, thereby encoding a cut-off velocity of 2cm/s and cut-off acceleration of 1.3m/s2. The end of pCASL-labeling and therefore the start of the VS- and Acc-ASL module was triggered using a PPU-device on the left index finger. Five trigger-delays at equal interval were calculated based on a phase-contrast scan of the labeling location (Figure 3). Furthermore, a flow-territory scan3 and 3DT1 was acquired.
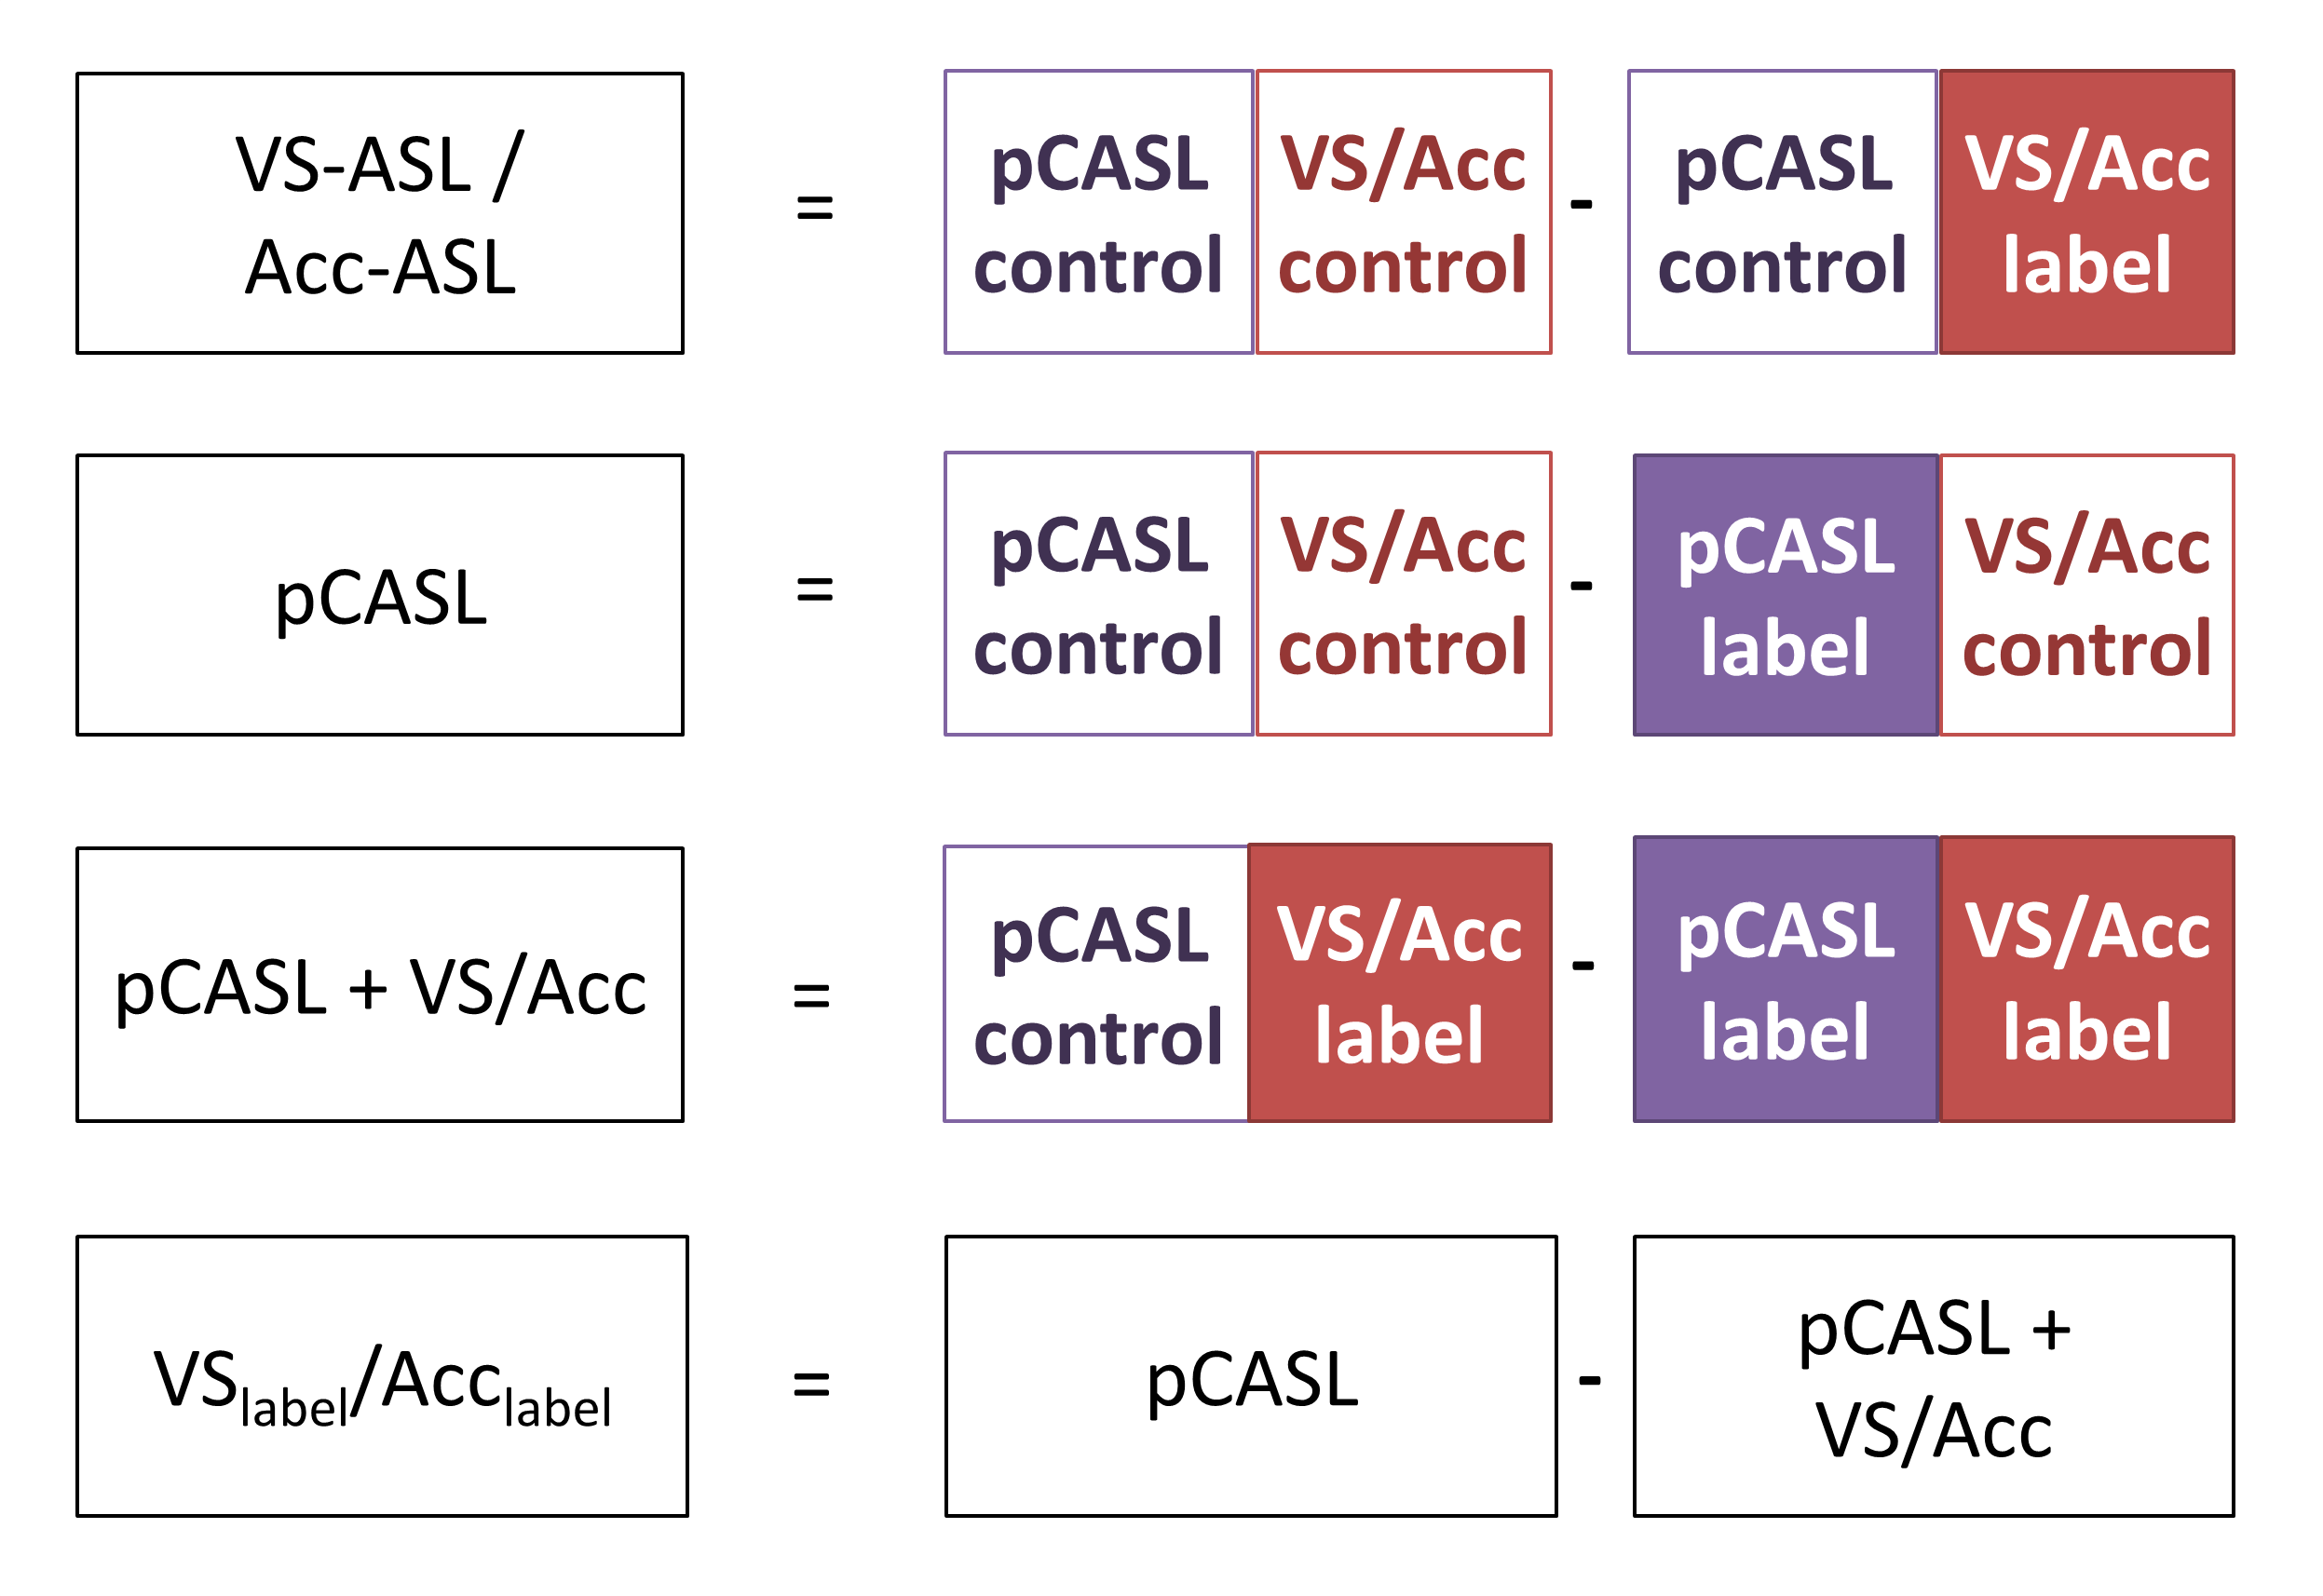
Eight volunteers (mean age 26 years) were scanned with VS-ASL and nine (32 years) with Acc-ASL, who all gave written informed consent prior to inclusion. All volunteers were scanned on a 3T Achieva (Philips) using a 32-channel head coil. The acquired data allowed reconstruction of a short PLD VS- or Acc-ASL image, a pCASL image, a crushed pCASL image (pCASL followed by VS (or Acc) crushing) and an image, named VSlabel (Acclabel), that aims to isolate the effect of VS- or Acc-ASL crushing on the pCASL label (Figure 2). To test whether VS (Acc) encoding at a certain cardiac phase is more stable than untriggered encoding, signal variation between different cardiac phases was calculated from the median of the gray matter signal (averaged per flow-territory) over all dynamics, and standardized with respect to the median signal over all cardiac phases. Finally the standardized deviations were averaged over all volunteers. In addition, a one-way ANOVA was performed for each flow-territory to test for significant differences in VSlabel (Acclabel) between the cardiac phases. All analyses were performed in MATLAB and the SPM12 toolbox.
Results
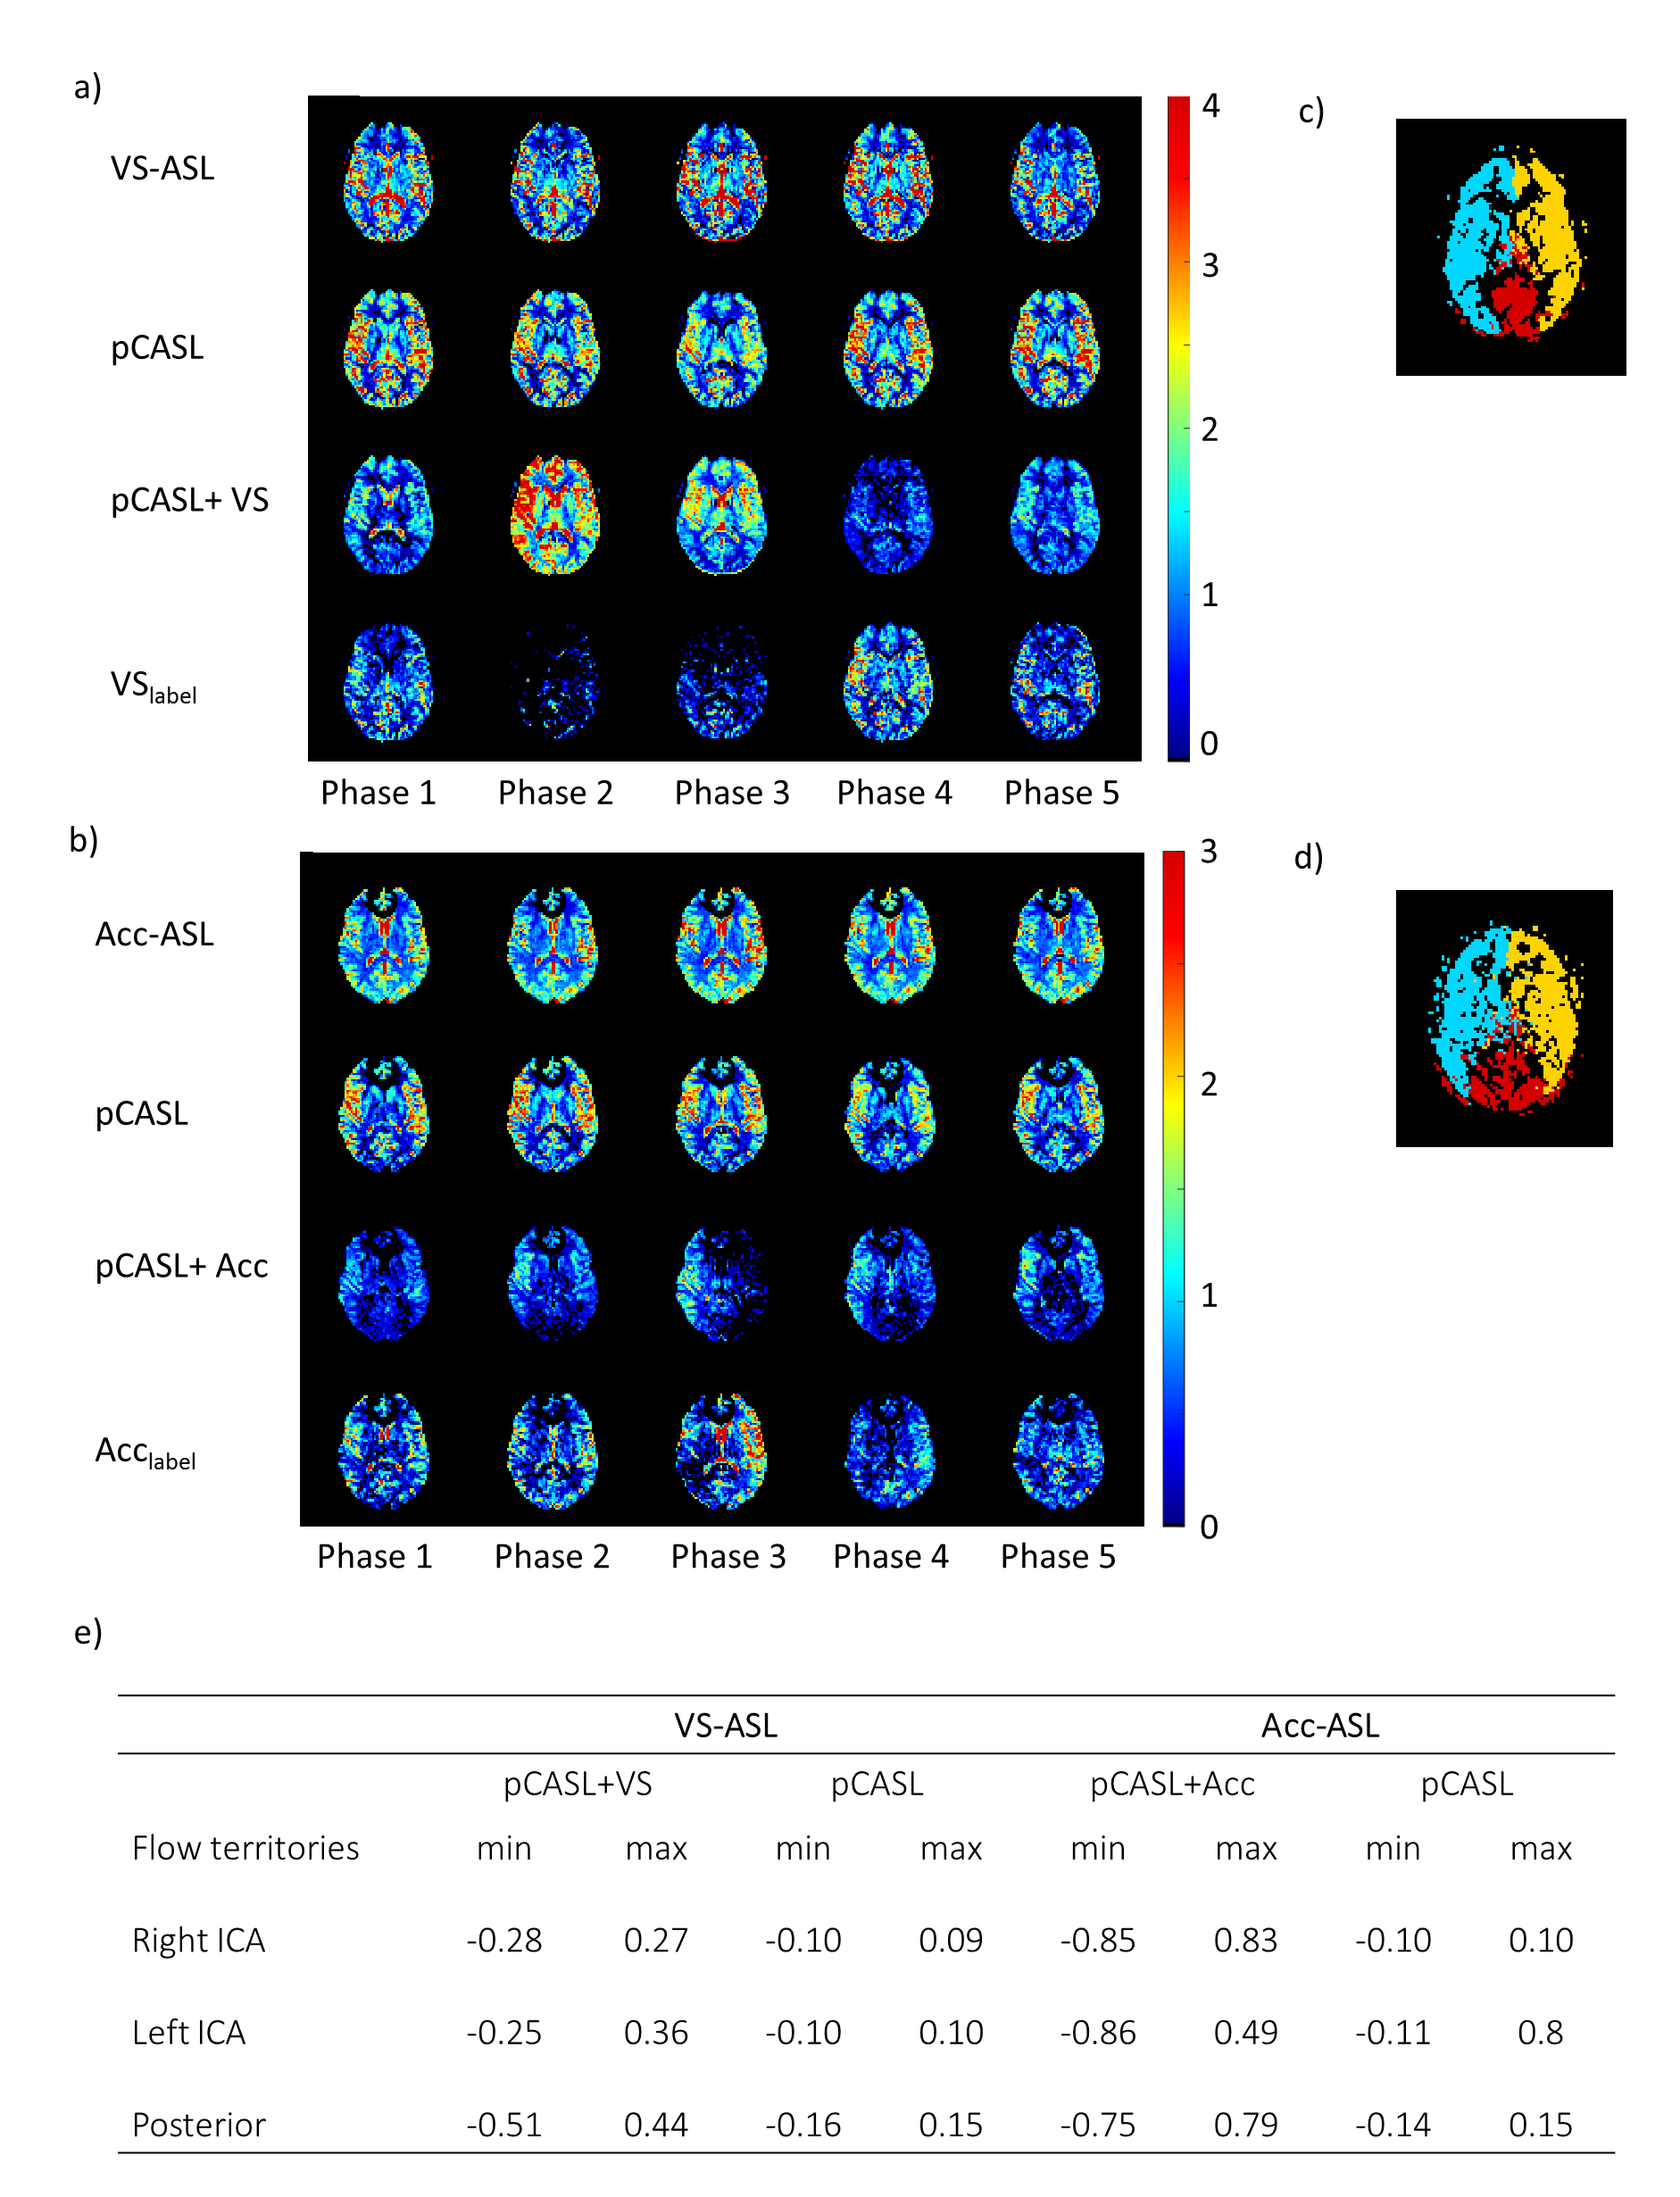
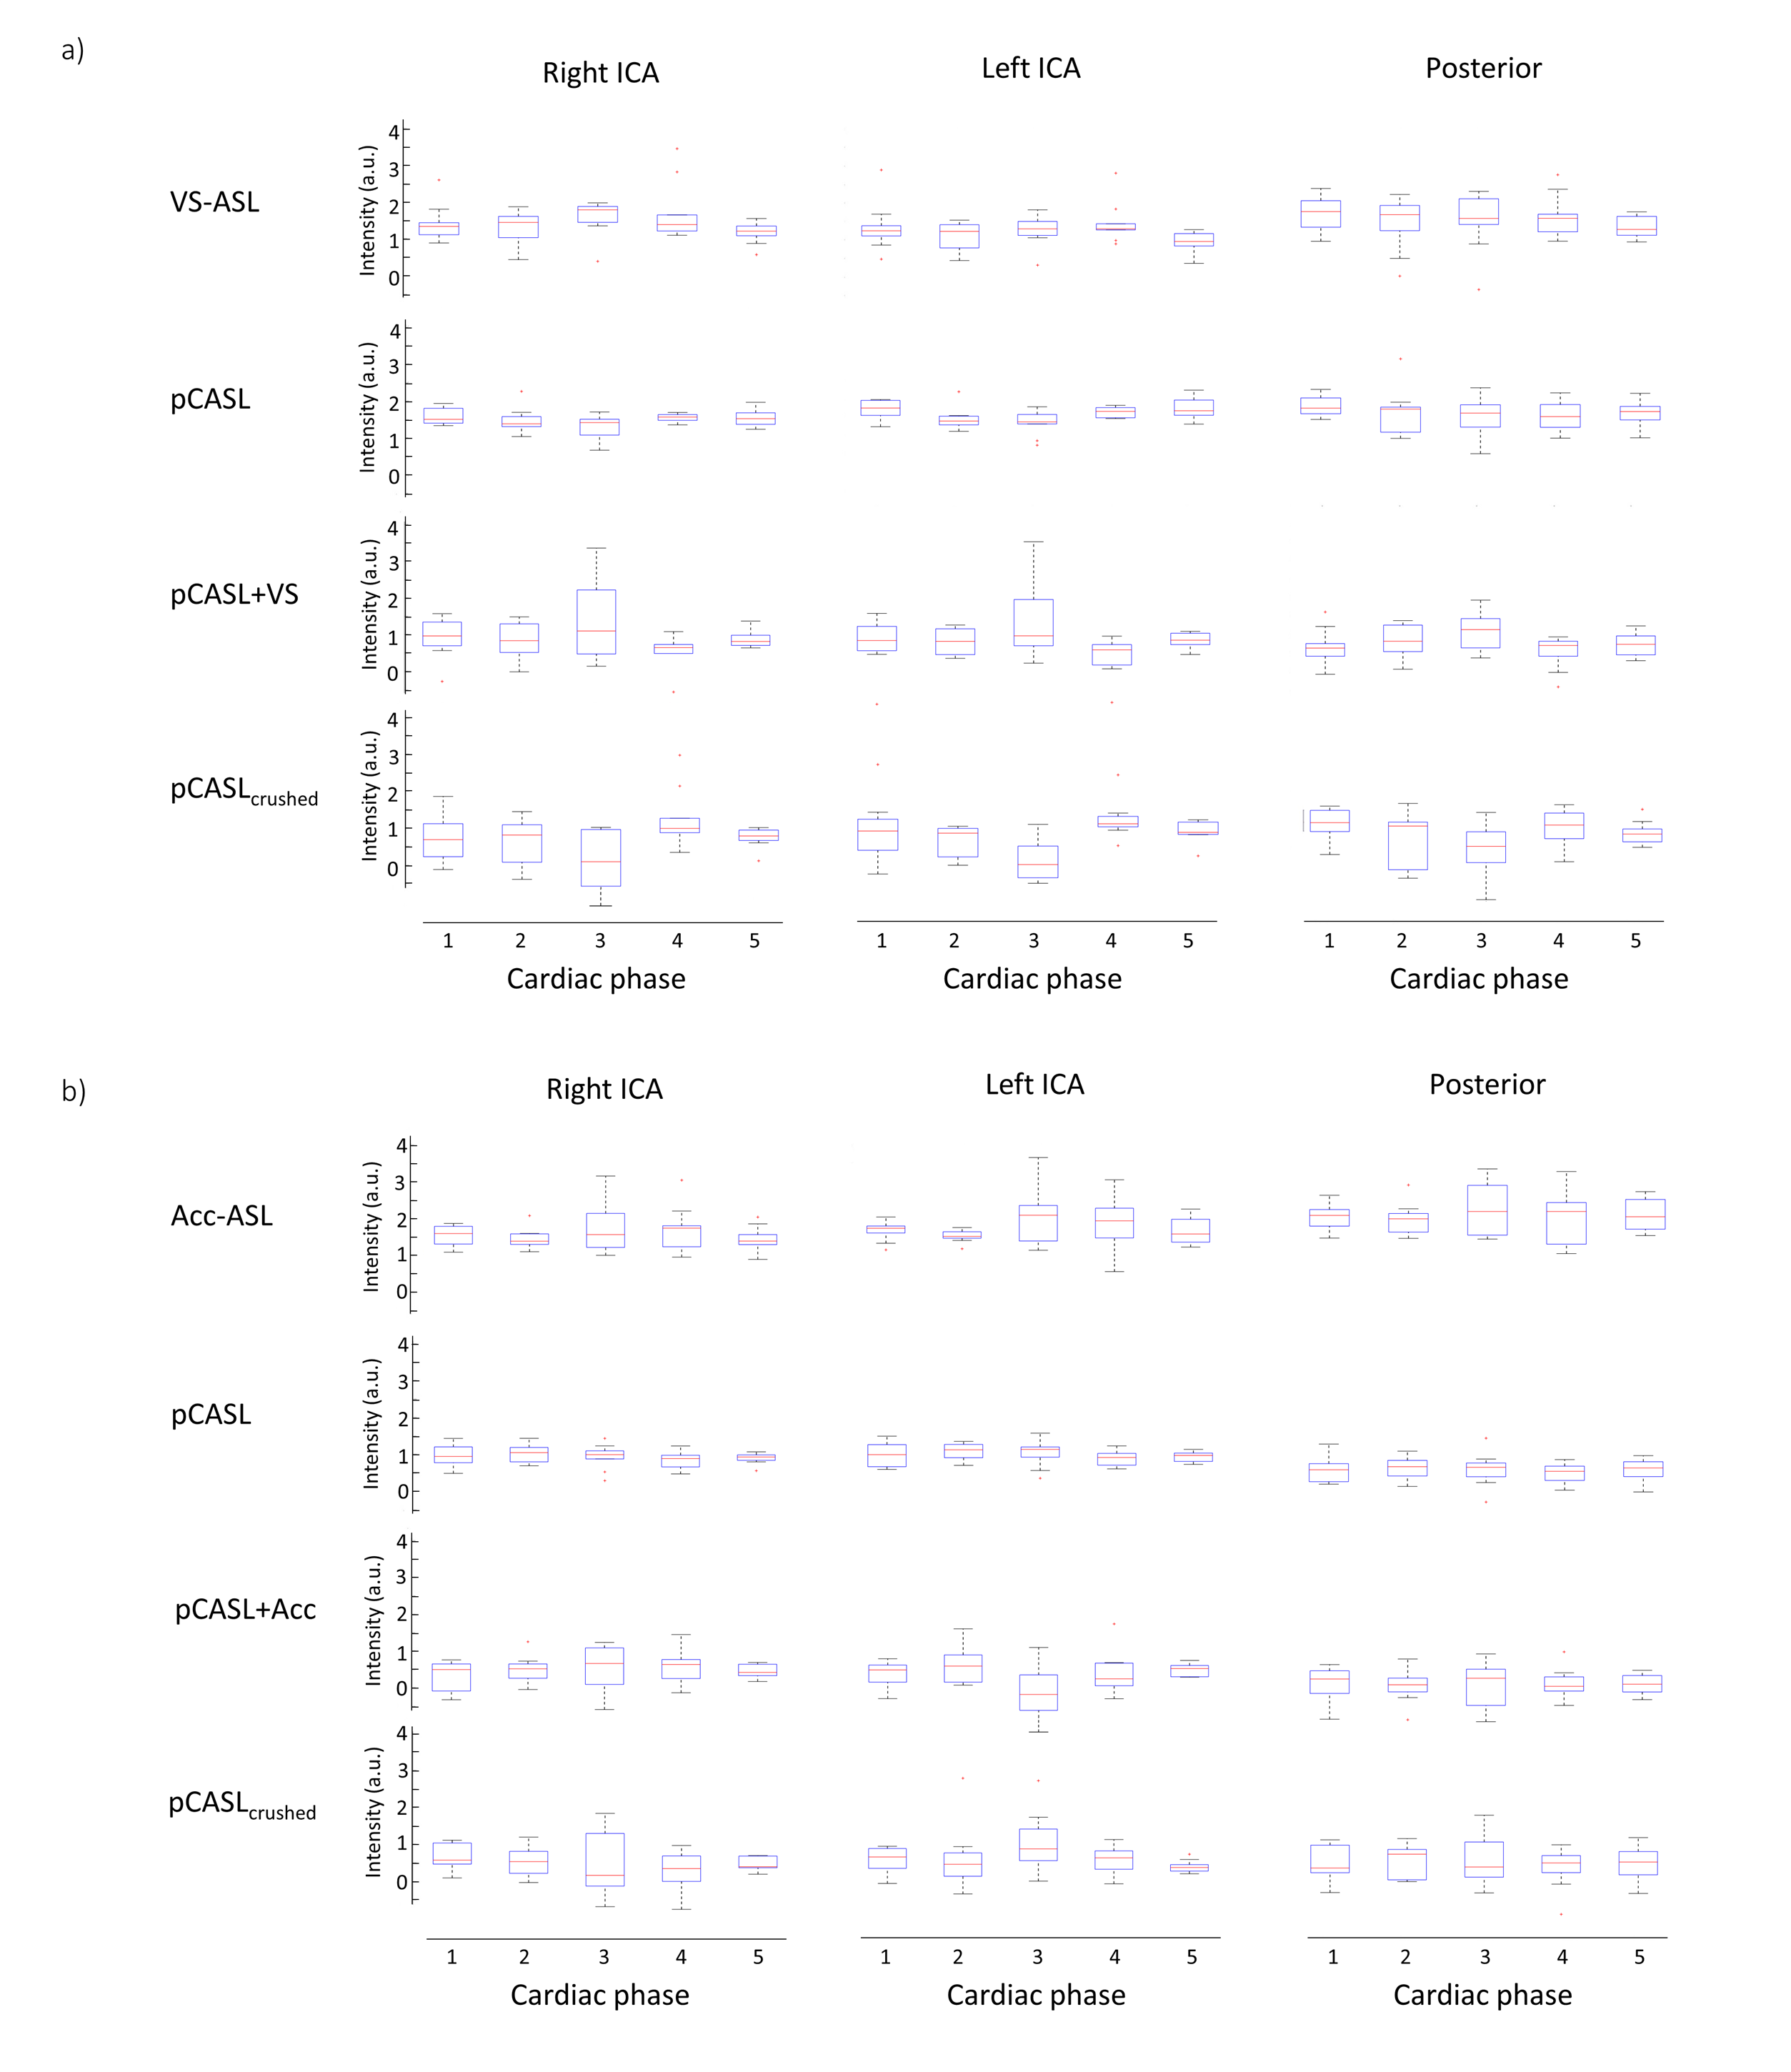
For both volunteer groups, the pCASL images showed only slight variation in gray matter signal over the cardiac phases (see Figure 3-5). However, more variation is observed between the cardiac phases for the VSlabel and Acclabel images (two representative volunteers are shown in Figure 4). Quantification of the variation between the cardiac phases showed that the median gray matter pCASL signal varied <15%, while the median gray matter pCASL+VS signal varied up to 51%, and pCASL+Acc up to 86% (see table in Figure 4e). However, the gray matter VSlabel and Acclabel signal did not differ significantly (ANOVA) between the cardiac phases, which was likely due to large variance of the individual dynamics (Figure 5). Remarkably, when looking at the VSlabel and Acclabel-signal for the different cardiac phases spatially coherent patterns can be recognized that resemble the flow territories.Discussion & conclusion
The amount of crushing by VS- and Acc-ASL did not differ significantly between the cardiac phases. However, a spatial pattern can be recognized in the VSlabel (Acclabel) images coinciding with the flow territories, which suggests an underlying physiological cause for the variation in the amount of crushing. This study has shown promising signs that VS-ASL and Acc-ASL can be used to measure pulsatility in the microvasculature, but covering the cardiac cycle with more than five phases seems essential to capture the pressure wave at microvascular level.Acknowledgements
This project is supported by NWO-TTW, project number 14951.References
1. Wong, E. C., Cronin, M., Wu, W.C., Inglis, B., Frank, L.R., Liu, T.T. Velocity-selective arterial spin labeling. Magn. Reson. Med. 55, 1334–41 (2006).
2. Schmid, S., Ghariq, E., Teeuwisse, W. M., Webb, A. & van Osch, M. J. P. Acceleration-selective arterial spin labeling. Magn. Reson. Med. 71, 191–199 (2014).
3. Wong, E. C. Vessel-encoded Arterial Spin-Labeling Using Pseudocontinuous Tagging. Magn. Reson. Med. 1091, 1086–1091 (2007).
Figures