0549
Exploiting small fluctuations in labeling efficiency in pseudo-continuous arterial spin labeling for combined flow-territory determination and CBF-mapping1Department of Radiology, Leiden University Medical Center, Leiden, Netherlands
Synopsis
Since the labeling efficiency in pCASL is dependent on velocity and off-resonance effects, one could imagine that small natural occurring fluctuations at the labeling plane would lead to similar fluctuations in the ASL-signal. Such fluctuations at the brain level would be similar for voxels belonging to the same flow territory and might enable detection of flow territories, e.g. by an ICA-type of resting-state ASL analysis that is normally used for identification of neuronal networks. By deliberately manipulating the labeling efficiency, we can report that with small fluctuations in labeling efficiency flow territories can be determined, which diminish in robustness for smaller fluctuations.
Introduction
Pseudo-continuous arterial spin labeling (pCASL) is a readily available technique that may be used in a clinical setting [1, 2], as well as for neuroscience applications, such as identification of neuronal networks [3]. Knowing that the labeling efficiency in pCASL is dependent on velocity and off-resonance effects [4], one could imagine that small natural occurring fluctuations of the local conditions at the labeling plane would lead to similar fluctuations in the ASL-signal at brain level. Such fluctuations of cerebral ASL-signal will be similar for voxels belonging to the same flow-territory. It might therefore be expected that such fluctuations could be picked-up in an ICA-type of resting-state analysis aimed at identification of neuronal networks, thereby providing estimates of the flow-territories. This could be a way of acquiring flow-territory information for free from a 2D-multi-slice pCASL scan, which normally has many (>25) repeated measurements. A first pilot study showed that it is unfortunately difficult to immediately identify the flow territories from an ICA-analysis. Therefore, the goal of this study was to study what level of variations are needed to allow flow-territory detection by an ICA resting-state ASL-analysis. To this end, we created deliberate fluctuations of labeling efficiency in left-right direction by adding a vessel-encoding gradient [1] with variable strength into the sequence. When tiny fluctuations would be sufficient, this would enable an almost ‘free’ approach for obtaining combined CBF and flow-territory information from a single scan.Methods
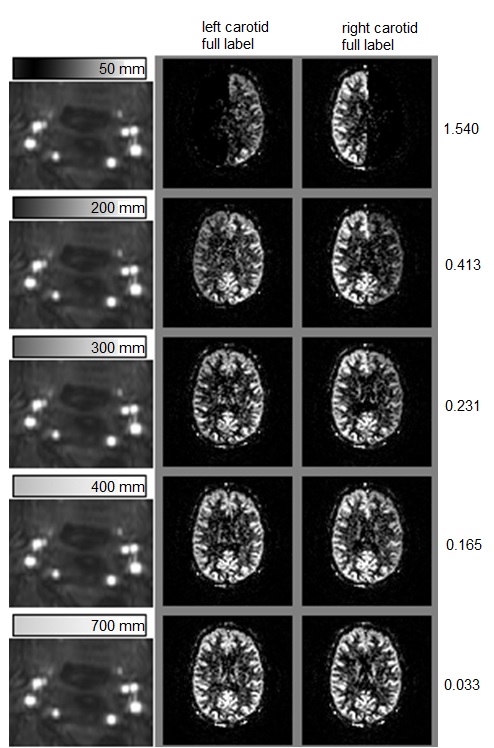
Healthy subjects (n=5, mean age 30.4±7.6, male/female=4/1) were scanned on a 3-Tesla MRI scanner (Philips, the Netherlands) using a protocol containing a 3DT1, standard pCASL, a time-of-flight angiogram of the labeling plane, a planning-free flow-territory mapping scan which provides the gold standard territories, and a range of pCASL-scans with an vessel-selective gradient in the left-right direction with varying gradient strengths according to a predefined scheme (see Figure 1). The phase accrual over the labeling train was adapted to result in optimal labeling conditions at the right ICA for the first label-control pair, after which the phase accrual was adjusted to yield optimal labeling in the left ICA. These 4 conditions were subsequently repeated 20 times (6 minutes total scan-time). Subsequently, the gradient strength was adjusted for the next scan. The scans were analyzed with FMRIB Software Library v5.0 [5] and in-house developed Matlab R2016a algorithms (The MathWorks, Massachusetts).
The effect of the vessel-encoding gradient was expressed for each flow-territory as:
relative efficiency fluctuations = (SIperfect_label_conditon – SIsub_optimal_labeling) / SIpCASL
(i.e. for the right ICA territory of Figure 1: third column minus second column divided by non-selective pCASL).
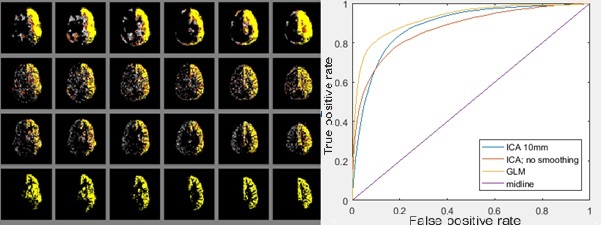
Flow territories were determined in two different ways. The first exploits the knowledge when the labeling efficiency was varied by designing a general linear model (GLM) without blurring [6], whereas the second is the blind “Multivariate exploratory linear optimized decomposition into independent components (MELODIC)” method (that could be used when exploiting naturally occurring fluctuations). Finally, MELODIC was repeated after blurring with a 10mm Gaussian kernel. The ICAs were visually checked for components that represented flow territories.
The robustness of the method was assessed with receiver operating characteristic (ROC) curves, while only including intracranial voxels that were not part of the posterior circulation territory as taken from the gold-standard flow-territory mapping.
Results
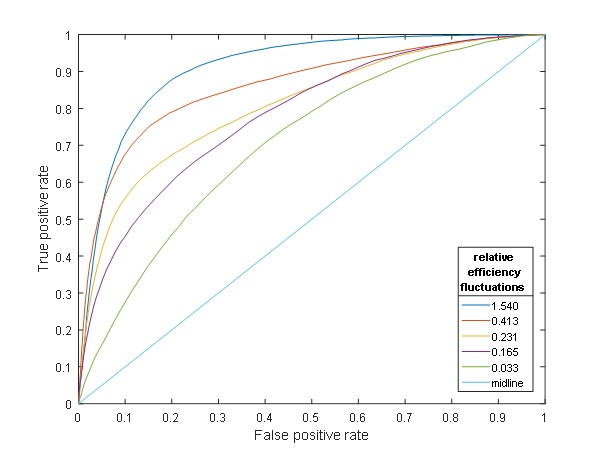
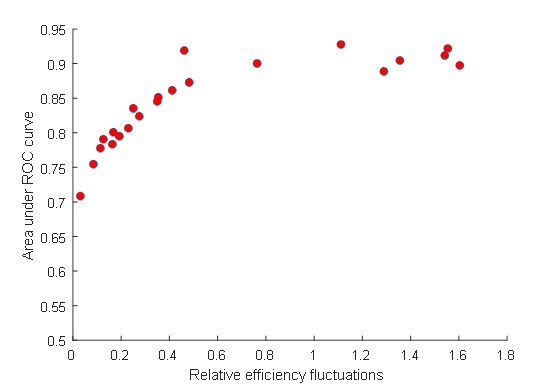
Applying a vessel-encoding gradient in the labeling plane affected indeed the labeling efficiency (Figure 1). This allowed identification of the flow territories, which was most robustly picked up by the GLM-approach (Figure 2). For the smaller fluctuations in labeling efficiency the ICA based approach without blurring failed to detect the territories. The relationship between relative efficiency fluctuations and the area-under-the-ROC for the GLM-based method is shown in Figure 3 (one subject) and 4 (all subjects).Discussion
In this proof-of-principle study we showed that with the introduction of off-resonance effects by means of a vessel-encoding gradient it becomes possible to determine flow territories. The performance becomes weaker in robustness when the introduced fluctuations are smaller. Since on average the labeling efficiency will be lower, the approach based on the inclusion of a vessel-encoding gradient comes with an SNR penalty for the determination of the CBF-map. When an area of .85 under the ROC is assumed to be a proper fit, labeling efficiency fluctuations of just under 20%-point are sufficient when using the GLM-approach. From these findings it becomes also clear that the sole exploitation of natural occurring fluctuations may be insufficient to allow flow-territory detection. Future research will include seed-based correlation as well as multiscale approaches that might improve detection rate.Acknowledgements
We thank Sophie Schmid, Wouter Teeuwisse and Annemarieke van Opstal for their help with acquiring scan data.
This research has been made possible by the Dutch Heart Foundation and the Netherlands Organisation for Scientific Research (NWO), as part of their joint strategic research programme: "Earlier recognition of cardiovascular diseases”. This project is partially financed by the PPP Allowance made available by Top Sector Life Sciences & Health to the Dutch Heart foundation to stimulate public-private partnerships. This research was also supported by the EU under the Horizon2020 program (project: CDS-QUAMRI), and the CAVIA project (nr. 733050202), which has been made possible by ZonMW
References
1. Wong, E.C., Vessel-encoded arterial spin-labeling using pseudocontinuous tagging. Magn Reson Med, 2007. 58(6): p. 1086-91.
2. Gevers, S., et al., Robustness and reproducibility of flow territories defined by planning-free vessel-encoded pseudocontinuous arterial spin-labeling. AJNR Am J Neuroradiol, 2012. 33(2): p. E21-5.
3. Dai, W., et al., Quantifying fluctuations of resting state networks using arterial spin labeling perfusion MRI. J Cereb Blood Flow Metab, 2016. 36(3): p. 463-73.
4. Aslan, S., et al., Estimation of labeling efficiency in pseudocontinuous arterial spin labeling. Magn Reson Med, 2010. 63(3): p. 765-71.
5. Woolrich, M.W., et al., Bayesian analysis of neuroimaging data in FSL. Neuroimage, 2009. 45(1 Suppl): p. S173-86.
6. Winkler, A.M., et al., Permutation inference for the general linear model. NeuroImage, 2014. 92(Supplement C): p. 381-397.
Figures