0548
Rethinking vascular artifacts: testing the sensitivity of ASL vascular signal as a biomarker of disease1Rochester Institute of Technology, Rochester, NY, United States, 2Helmholtz-Zentrum Dresden-Rossendorf Institut für Radiopharmazeutische Krebsforschung PET-Zentrum, Dresden, Germany, 3The University of Alabama at Birmingham, Birmingham, AL, United States, 4Columbia University Medical Center, New York, NY, United States
Synopsis
Collateral perfusion has a major effect on clinical outcome in carotid steno-occlusive disease. Arterial spin labeling (ASL) may provide a biomarker of collateral perfusion by measuring arterial transit time (ATT) in addition to cerebral blood flow (CBF). However, the concomitant measurement of ATT and CBF is not feasible for clinical applications. As an alternative, ATT can be estimated from single post-labeling delay ASL image using the spatial coefficient of variance (CoV). In this study, we investigate whether the spatial CoV lateralization through collateral perfusion can predict the side of carotid occlusion as a proof-of-principle. In addition to spatial CoV, we also investigated whether temporal variance (tVAR) of the ASL signal could be used as a predictor of occlusion versus stenosis.
Introduction
It was recognized early on in the development of ASL that the vascular signal can be a significant confound in measuring tissue perfusion. To this end, Alsop et al. proposed introducing a post-label delay (PLD) to allow the labeled blood to arrive at the level of micro-vasculature and preferably wash-out from the macro-vasculature1. Considering, however, that the ASL signal decays during PLD, a compromise is usually made between minimizing the effect of the vascular signal and optimizing SNR. The choice of PLD, however, is complicated in clinical applications – such as carotid occlusive disease – where arterial transit times (ATT) are prolonged and can vary considerably across and within patients. In these cases, a concomitant measurement of both CBF and ATT would be ideal. However, ATT acquisition leads to longer scanning time, lower SNR, and higher motion sensitivity2,3. A recent study used the spatial coefficient of variation (sCoV) of ASL as a proxy for the ATT measurement in group analysis4. Here, we tested the utility of sCoV for within-patient analysis. For this, we compared the sensitivity of sCoV to that of baseline CBF to predict the side of the affected hemisphere in patients with carotid occlusive disease. We also investigated the temporal variance of the ASL signal (tVAR) and its feasibility in detecting differences between occlusion and stenosis.Methods
Background suppressed pCASL images were acquired on 31 patients (age 73.9 ± 9.6 y, 18 men) with asymptomatic unilateral carotid occlusion/stenosis (≥ 99%), using the following parameters: labeling duration = 1950 ms, PLD range = 1200-1680 ms, number of control/label pairs = 60, TE/TR = 14ms/4500ms. Details of the recruitment criteria and CBF computation can be found in Marshall et al.5.The random sample consensus (RANSAC) algorithm was used to bisect the images into left and right hemispheres in each patient’s native space. Gray matter (GM) CBF and GM sCoV were computed within the anterior and posterior vascular territories for the left and right hemispheres, independently6. The asymmetry index (AI) was calculated for mean CBF and sCoV, for each of the 4 territories, as per Mutsaerts et al.4. Images of the temporal variance of the ASL (tVAR) were also computed for each patient over 60 time-points (~9s apart). Vascular signal was identified using thresholded histograms.Results
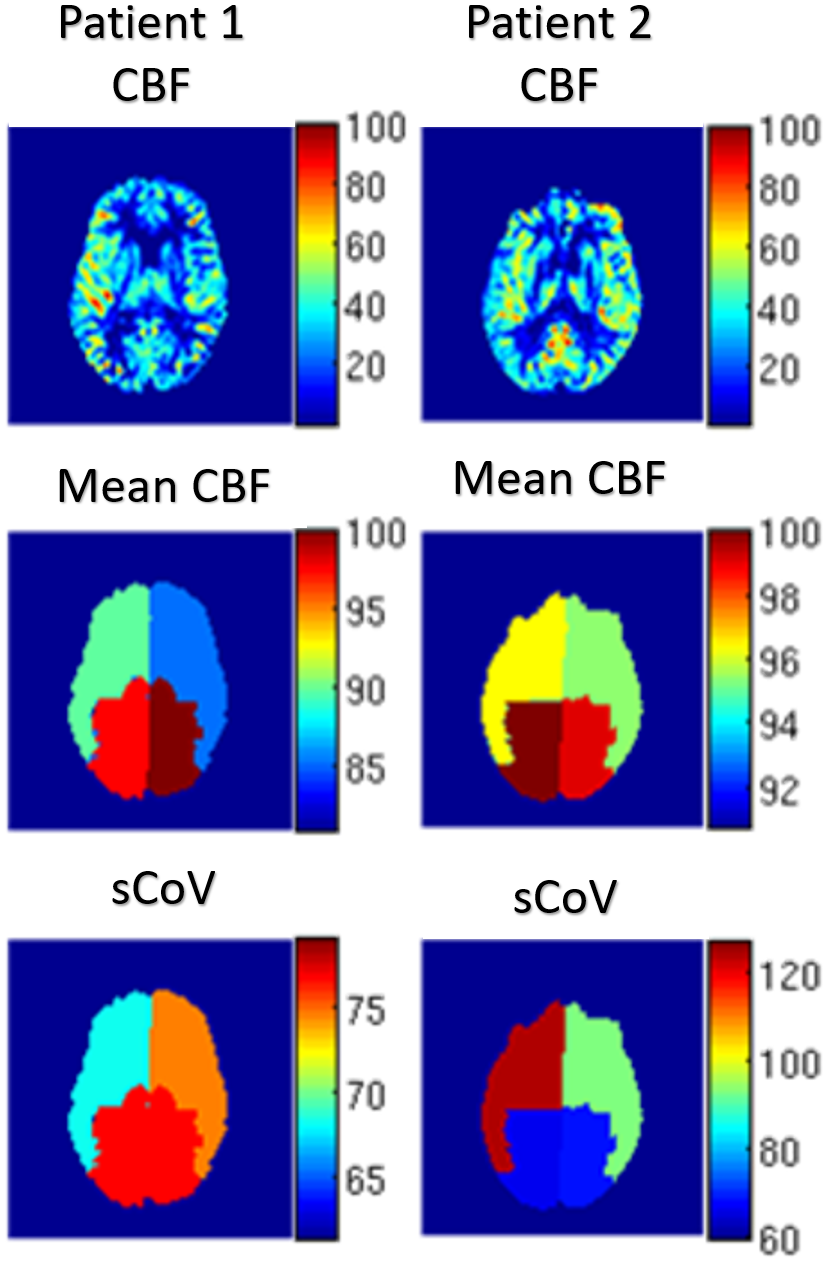
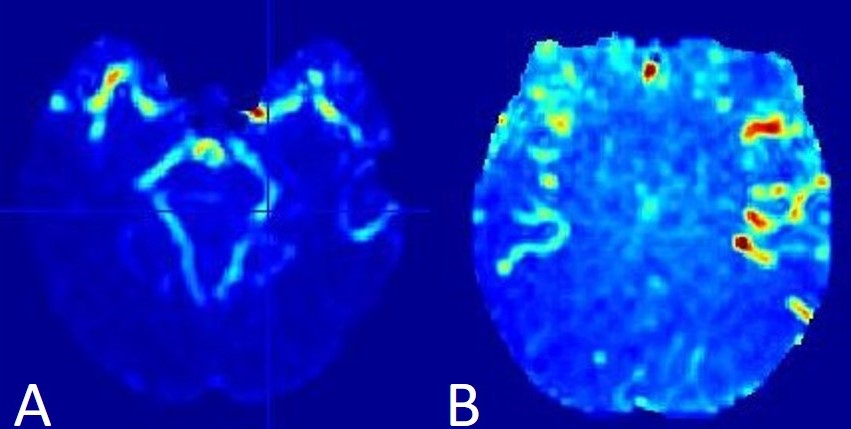
Fig. 1 is a visual display of the observed asymmetry in CBF and sCoV from two patients: one with right ICA occlusion (1st column), the other with left ICA stenosis (2nd column). Note that for the stenosis patient, the CBF alone could not predict the affected side. The sCoV, however, could; it was substantially higher (~37%) on the side of the stenosis. Results from all patients are summarized in Table 1. For the sake space and comparison with previous sCoV study4, the table contains only the CBF and sCoV data. The sCoV asymmetry was able to predict the side of the occlusion in all patients except for two. In comparison, the CBF asymmetry predicted the wrong occlusion side in 7 patients. The tVAR asymmetry in voxels identified as ‘vascular’ could predict the occluded/stenosed side with 93% accuracy. Furthermore, the predictive value of tVAR for distinguishing between occlusion and stenosis was 91%. Temporal variance (tVAR) images from a representative patient with left ICA stenosis are shown in Fig.2.Conclusions
Both spatial and temporal variability of the ASL signal were able to predict the occluded side with higher accuracy than baseline CBF asymmetry. These promising findings demonstrate the clinical potential of vascular artifacts as proxies for ATT and collateral perfusion.Acknowledgements
This work was supported by the National Institutes of Health (NINDS R01NS076277) and The Gleason Foundation.References
1 D.C. Alsop & J. Detre, JCBFM 16(6), 1996; 2 Y. Chen et al., MAGMA 25(2), 2012; 3 W.M. Teeuwisse et al., MRM 72(6) 2014; 4 H.J. Mutsaerts et al., JCBFM, 2017; 5 R.S. Marshall et al., J Neur Sci, 2016; 6 M. A. Fischler & R. C. Bolles, Communications of the ACM, 24(6) 1981Figures