0547
In Vivo Conductivity Imaging of Tissue Response after Radiation TherapyIn Ok Ko1, Bup Kyung Choi2, Nitish Katoch2, Ji Ae Park1, Jin Woong Kim3, Hyung Joong Kim2, Oh In Kwon4, and Eung Je Woo2
1Division of RI Convergence Research, Korea Institute of Radiological and Medical Sciences, Seoul, Republic of Korea, 2Biomedical Engineering, Kyung Hee University, Seoul, Republic of Korea, 3Radiology, Chonnam National University Medical School, Gwangju, Republic of Korea, 4Konkuk University, Seoul, Republic of Korea
Synopsis
Radiation therapy (RT) has been widely used as a powerful treatment to remove cancerous tissues because of its ability to control cell growth. Ionizing radiation works by damaging the DNA of cancerous tissue leading to cellular death. Medical imaging has limitations on credibility for evaluation of tissue response and prediction of therapeutic effect due to lacks of contrast information on gradual and minute tissue changes after RT. Conductivity mapping after RT may provide direct and high sensitive information on tissue response because its contrast mechanism originated from the concentration and mobility of ions in the extra- and intracellular environment.
PURPOSE
The purpose of this study is to show the clinical potential of in vivo conductivity imaging method which can provide novel contrast information on tissue response relating with the therapeutic effect in radiation therapy.METHODS
For in vivo imaging experiment, we used a total of 5 Sprague-Dawley rats (8 weeks old, weighing 260~280 g). All were healthy and without history of any known diseases. Conventional external-beam radiation therapy was delivered to rat head using a linear accelerator in dose of 1 Gy.1 To prevent dribbling during the experiments, we injected 0.1 mg/kg of atrophine sulfate. Ten minutes later, we anesthetized the rats with an intramuscular injection of 0.2 ml/kg Zolazepam (Zoletil 50, Virbac, France). Following animal preparation, rats were placed inside the bore of 3T MRI scanner (Magnetom Trio A Tim, Siemens Medical Solutions, Erlangen, Germany). A multi-spin-echo pulse sequence was applied to obtain the B1 map data which is used to recover high-frequency isotropic conductivity images.2 Before data acquisition, we applied a volume shimming method with the volume defined to cover the imaging area. Imaging parameters were as follows: repetition time TR = 1200 msec, echo-spacing TE = 15 msec, number of echoes 6, number of averaging 6, slice thickness 1 mm, number of slices 5, matrix size 128 × 128, field-of-view 50 × 50 mm2, and total imaging time was about 30 minutes. Using the time-harmonic vector representation at the Larmor frequency, the relation between the B1 map and the electrical tissue properties of conductivity σH and permittivity ϵH is expressed as ∇2B1 = iωμ0(σH + iω ϵH )B1 − ∇(σH + iω ϵH) × ((∇ × B1)/( σH + iω ϵH)) where μ0 is the magnetic permeability of the free space.3 An MRI scanner with a single transmit coil and multiple receive coils is used in this study to estimate σH from the measured B1 map. Detailed image reconstruction for high-frequency conductivity are described in the reference 3. For the analysis of brain tissue response, we measured conductivity values at five different ROIs (region-of-interest) before and 1, 3, 5 day after the RT. The time-course conductivity changes was analyzed and compared with the results from ADC (apparent diffusion coefficient) values which was measured at the same ROIs.RESULTS AND DISSCUSSION
Figure 1 is resulting conductivity images of in vivo rat head obtained before and after radiation therapy. We can confirm the morphological information of rat head in MR magnitude images (Fig. 1a). There was no significant contrast before and after RT in MR magnitude images. But in the conductivity images (Fig. 1b), the contrast showed time-course variation. Specifically, the conductivity was rapidly increased until 3 days after RT and then gradually increased, finally, reached its steady-state. This may stem from the fact that cell growth is stopped after RT and then extra- and intracellular environment were changed due to the accumulated irradiation. The high conductivity contrast in the brain cortex region, where the effect of radiation is relatively large, support this point (Fig. 1b). For quantitative analysis, we measured the conductivity values of five different ROIs and compared to the ADC vales at the same ROIs. In all ROIs, overall ADC and conductivity values were increased after RT. However, the ADC values showed within 10% of the difference over time, but the conductivity showed at least 100% differences in all ROIs. Therefore, it is possible to explain that electrical conductivity may provide information with high sensitivity in evaluating the therapeutic effect of radiation therapy.CONCLUSION
In this feasibility study, we applied MR-based electrical conductivity imaging method to image tissue response in radiation therapy. After RT, we can quantify the amount of tissue response from the electrical conductivity images. Conductivity images shown in this study indicated that conductivity contrast between the brain tissues are distinguishable in a different way compared with conventional MR image techniques. Future studies are focused on the verification and long-term evaluation of conductivity changes by various irradiation methods for clinical application.Acknowledgements
This work was supported by the National Research Foundation of Korea (NRF) and Korea Institute of Radiological and Medical Sciences(KIRAMS) grants funded by the Korea government (No. 2015R1D1A1A09058104, 2016R1A2B4014534, 2017R1A2A1A05001330 and 1711045539;1711045541/50461-2017)References
- Thwaites DI et al. Back to the future: the history and development of the clinical linear accelerator. Phys. Med. Biol. 2006;51:R342-R362.
- Katscher U et al. Determination of electrical conductivity and local SAR via B1 mapping. IEEE Trans. Med. Imaging 2009;28:1365-1374.
- Sajib SZK et al. Electrodeless conductivity tenser imaging using MRI. IEEE Trans. Med. Imaging in revision.
Figures
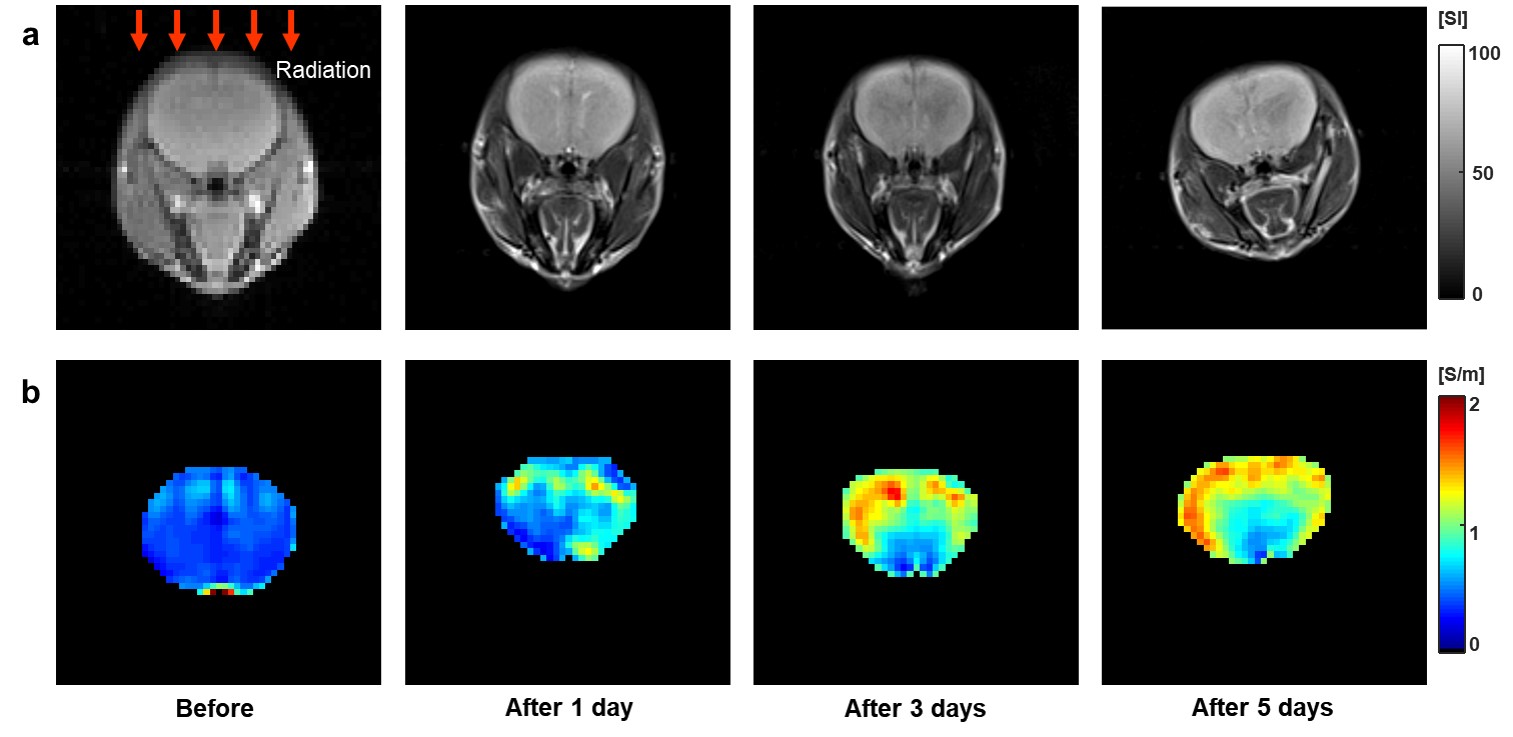
Fig. 1.
In vivo conductivity
images of rat head before and after radiation therapy. (a) MR magnitude images
provide morphological information on rat head. (b) Electrical conductivity
images of rat brain show time-course contrast related to its tissue response
after RT.
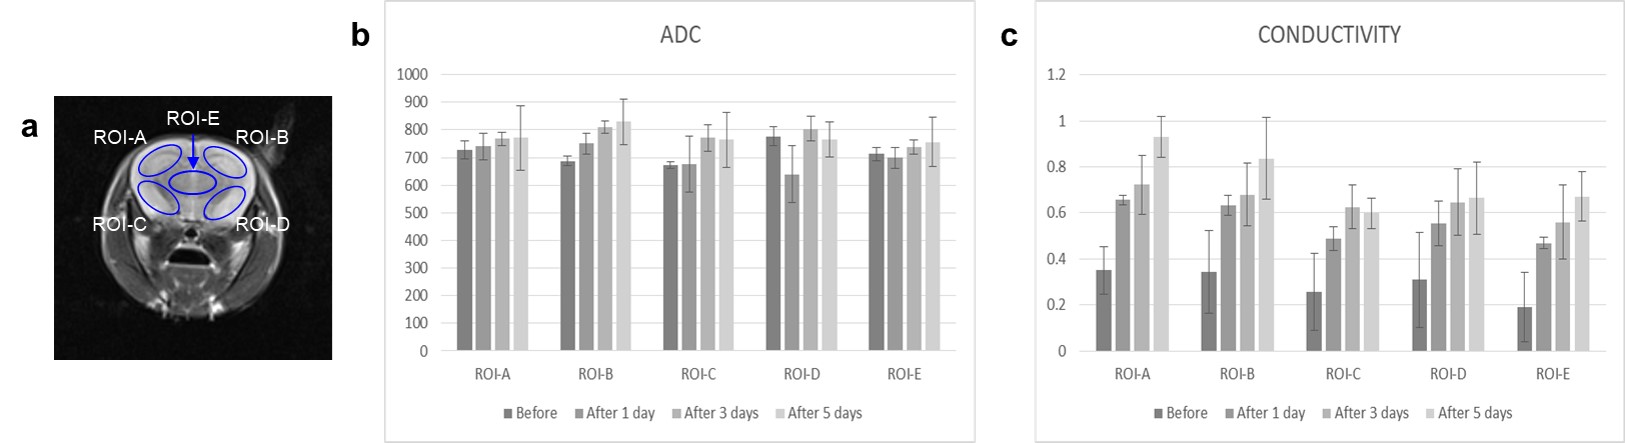
Fig. 2. Bar
graph showing the comparison of ADC and conductivity values obtained from 5
different ROIs.